Volume 10, Number 1, pp. 35–47. http://www.scpe.org c 2009 SCPE
AUTOMATIC PERFORMANCE MODEL TRANSFORMATION FROM A HUMAN-INTUITIVE TO A MACHINE-EFFICIENT FORM
SABRI PLLANA, SIEGFRIED BENKNER∗, FATOS XHAFA†, AND LEONARD BAROLLI‡
Abstract. We address the issue of the development of performance models for programs that may be executed on large-scale computing systems. The commonly used approaches apply non-standard notations for model specification and often require that the software engineer has a thorough understanding of the underlying performance modeling technique. We propose to bridge the gap between the performance modeling and software engineering by incorporating UML. In our approach we aim to permit the graphical specification of performance model in a human-intuitive fashion on one hand, but on the other hand we aim for a machine-efficient model evaluation. The user specifies graphically the performance model using UML. Thereafter, the transformation of the performance model from the human-usable UML representation to the machine-efficient C++ representation is done automatically. We describe our methodology and illustrate it with the automatic transformation of a sample performance model. Furthermore, we demonstrate the usefulness of our approach by modeling and simulating a real-world material science program.
Key words: performance modeling, model transformation, UML, simulation.
1. Introduction. It is impractical and costly to use a large-scale computing system for performance tuning during the program development. Furthermore, in the case of large-scale computing systems the program developer commonly has access to only a part of the computing system resources and for only a limited time. The model-based performance analyzes may be used to overcome these obstacles [17]. Based on the model, the performance can be predicted and design decisions can be influenced without time-consuming modifications of large portions of an implemented program. In the past the performance evaluation of computing systems was a preoccupation of many computer scientists [8, 17]. However, most of approaches [1, 9, 6, 13, 21, 10, 7] for the performance modeling of parallel and distributed programs are of limited use to support performance-oriented software engineering because of the following reasons: (1) the use of a notation that is not based on widely accepted standards, and (2) the requirement that the software engineer has a thorough understanding of the underlying performance modeling technique.
In our approach we aim to bridge the gap between the performance modeling and the software engineering by using the Unified Modeling Language (UML) [2]. We have developed an extension of UML for the domain of performance-oriented parallel and distributed programs [18, 19]. Our UML extension provides a set of UML building blocks that model some of the most important concepts of message passing and shared memory programming paradigms, which can be used to develop models for large and complex parallel and distributed programs. To provide tool support for our approach we have developed the Performance Prophet [16], which is a performance modeling and prediction system. Performance Prophet provides a UML based graphical user interface, which alleviates the problem of specification and modification of the performance model. In the context of Performance Prophet we aim to permit the graphical specification of performance model in a human-intuitive fashion on one hand, but on the other hand we aim for a machine-efficient model evaluation. The user specifies graphically the performance model using UML. Afterwards, Performance Prophet automatically transforms the performance model from UML to C++ and evaluates it by simulation.
In this paper we describe our methodology for automatic transformation of performance models from UML to C++. We show how we may develop a UML-based performance model for a given program code, and there-after we explain how the UML representation of the performance model is transformed to the corresponding C++ representation. Furthermore, we present and explain our algorithm for the performance model transfor-mation from UML to C++, which is implemented in the Performance Prophet. We illustrate our methodology with the transformation of a sample performance model using the Performance Prophet. The usefulness of our approach is demonstrated by modeling and simulating LAPW0, which is a real-world material science program that comprises about 15,000 lines of code.
∗University of Vienna, Department of Scientific Computing, Nordbergstrasse 15/C/3, 1090 Vienna, Austria, ({pllana,
sigi}@par.univie.ac.at).
†Polytechnic University of Catalonia, Department of Languages and Informatics Systems, C/Jordi Girona 1-3, 08034 Barcelona,
Spain, ([email protected]).
‡Fukuoka Institute of Technology, Department of Information and Communication Engineering, 3-30-1 Wajiro-Higashi,
Higashi-ku, Fukuoka 811-0295, Japan, ([email protected]).
The rest of this paper is organized as follows. Section 2 describes how we customized the UML for per-formance modeling and outlines the architecture of the Perper-formance Prophet. Our perper-formance model trans-formation methodology is presented in Section 3. Section 4 exemplifies the model transtrans-formation using the Performance Prophet. The usefulness of our approach is demonstrated in Section 5 by modeling and simulating a real-world material science program. Finally, Section 6 concludes the paper and briefly describes the future work.
2. Preliminaries. In this section we describe our approach for customization of the UML for performance modeling of parallel and distributed programs and give an overview of the architecture of Performance Prophet.
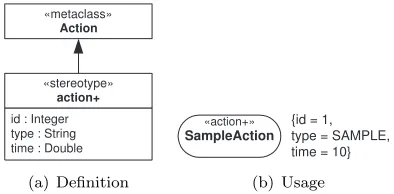
2.1. UML-Based Performance Modeling. UML [2, 14] is a graphical language that is primarily used for visualizing, specifying, and documenting the software-intensive systems. In order to make possible the modeling of different types of systems, UML modeling elements are defined in UML specification in an abstract manner without conceptual connection with a particular domain. For instance, the UML specification defines the modeling element Action as follows: “an action is the fundamental unit of behavior specification” [14]. Such an abstract definition allows us to use an action to model various kinds of behavior such as addition of two numbers in a computer system, oracceleration of a vehicular system. However, too generic semantics of UML modeling elements may present an obstacle for using UML in a specific domain. For this reason, UML specification defines the mechanisms for specializing semantics of modeling elements for a particular domain. UML extension mechanisms includestereotypes,tagged values, andconstraints.
The UML may be extended by defining new modeling elements, stereotypes, based on existing elements, base classes (i. e. metaclasses). A stereotype is defined as a subclass of an existing UML metaclass, with the associatedtagged values (i. e. metaattributes) andconstraints. Stereotypes are notated by the stereotype name enclosed in guillemets<<StereotypeName>>, or by a specific graphic icon. Stereotypes may improve the readability of models by distinguishing modeling elements of the same shape with different stereotype names.
id : Integer type : String time : Double
«stereotype» action+ «metaclass»
Action
(a) Definition
SampleAction «action+» {id = 1,
type = SAMPLE, time = 10}
(b) Usage
Fig. 2.1.Definition and usage of the stereotype<<action+>>.
Figure 2.1(a) depicts the definition of stereotype <<action+>>based on the UML metaclassAction. The list of tag definitions includesid,type, andtime. Tagid can be used to uniquely identify the modeling element <<action+>>; tagtypespecifies the type of<<action+>>, and tagtimethe time spent to complete<<action+>>. We are using<<action+>>(see example in Figure 2.1(b)) to model various types of single-entry single-exit code regions. Commonly we use tags to describe performance relevant information, such as the estimated or the measured execution time (see the tagtime in Figure 2.1(b)). The set of tag definitions is not limited to those shown in Figure 2.1(a), but it can be arbitrarily extended to meet the modeling objective. In this manner we have extended the UML for performance modeling of parallel and distributed programs [18, 19].
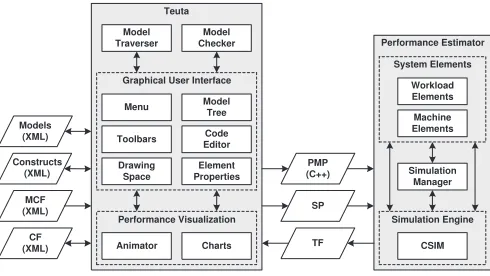
2.2. Performance Prophet. Performance Prophet [16] is a performance modeling and prediction sys-tem for parallel and distributed computing syssys-tems. The architecture of Performance Prophet is depicted in Figure 2.2. The main components of Performance Prophet areTeuta andPerformance Estimator. Teuta is a platform independent tool for graphical modeling of parallel and distributed programs. The role of Performance Estimator, in the context of Performance Prophet, is to estimate the performance of a program on a computing machine.
Teuta
Animator Charts TF
PMP (C++) Models (XML) Performance Visualization Model Traverser Model Checker Menu Drawing Space Toolbars Model Tree Code Editor Element Properties Graphical User Interface
SP MCF (XML) CF (XML) Constructs (XML) Performance Estimator Simulation Manager Workload Elements Machine Elements System Elements CSIM Simulation Engine
Fig. 2.2. The architecture of Performance Prophet. Abbreviations: Model Checking File (MCF), Configuration File (CF), Performance Model of Program (PMP), System Parameters (SP), Trace File (TF).
to the UML specification. The Model Traverser is used for generation of different model representations (XML and C++). The Performance Visualization components are used for visualization of the performance results.
Element MCF indicates the XML file, which is used for the model checking. The XML files that are used for the configuration of Teuta are indicated with the element CF.
The Performance Estimator estimates the performance of a parallel and distributed program on a target computer architecture. As input for the Performance Estimator serve the program model and architectural parameters that are specified in Teuta. The Performance Estimator generates automatically the machine model based on the specified architectural parameters. The program model is integrated with the machine model to create the model of the whole computer system. The Performance Estimator evaluates the integrated model of computing system and generates the corresponding performance results.
The communication between Teuta and the Performance Estimator is done via elements PMP, SP and TF. Element PMP indicates the C++ representation of the program’s performance model. PMP is generated by Teuta and serves as input information for the Performance Estimator. Element SP indicates a set of system parameters. The parameters of system include the number of computational nodes, the number of processors per node, the number of processes, and the number of threads. The Performance Estimator uses SP for building the model of system, whose performance is estimated. Element TF represents the trace file, which is generated by the Performance Estimator as a result of the performance evaluation. Teuta uses TF for the visualization of performance results.
3. Methodology. In this section we describe conceptually the transition: (1) from the program code to the UML based performance model, and (2) from the UML representation to the C++ representation of performance model. Thereafter, we present our algorithm that takes as input the UML representation, and automatically generates the C++ representation of the performance model.
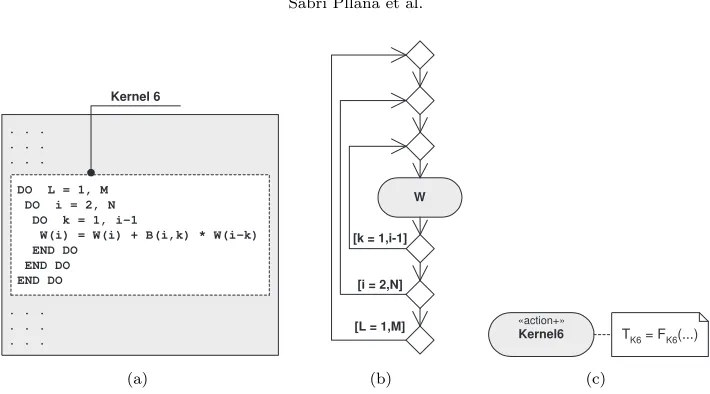
Commonly, scientific programs are written in imperative languages such as Fortran or C. This type of programs is executed on parallel and distributed computing systems, which may consist of multiple nodes (each node may have multiple processors), in order to solve large problems or to reduce the time to solution for a single problem [4]. The MPI [22, 12] is usually used to express the inter-node parallelism, whereas OpenMP [3, 15] is used to express the intra-node parallelism. We have identified that UML activity diagrams are suitable for modeling scientific imperative programs [19]. Therefore, we usually model a scientific program with one or more activity diagrams. Activity diagrams may be annotated with performance-relevant information. For instance, cost functions that model the execution time of program actions may be associated with ActionNodes of the activity diagram.
During the process of performance modeling are considered only the code blocks that strongly influence the overall performance of program. We may identify, for an existing program, code blocks that determine the overall program performance by using a profiling tool.
. . . . . . . . .
. . . . . . . . .
DO L = 1, M DO i = 2, N DO k = 1, i-1
W(i) = W(i) + B(i,k) * W(i-k) END DO
END DO END DO
Kernel 6
(a)
W
[L = 1,M] [i = 2,N] [k = 1,i-1]
(b)
Kernel6 «action+»
TK6 = FK6(...)
(c)
Fig. 3.1.From the program code to the UML based performance model.
kernel 6 is not necessary, since we are interested on the rough performance estimation. Therefore, we model the performance of the kernel 6, that is depicted in Figure 3.1(a), with the actionKernel6, which is an instance of the stereotype action+(see Figure 3.1(c)). The associated cost functionFK6(. . .) models the execution time
TK6of kernel 6.
The UML based representation of performance model of the kernel 6, that is depicted in Figure 3.1(c), is simple and intuitive. We have developed this graphical representation to streamline the specification process of performance models. However, while the UML representation is suitable as human-usable notation for performance model specification, it is not adequate for an efficient model evaluation. Therefore, we need to transform the UML representation to a form that is suitable for evaluation.
Kernel6
«action+»
(a)
ActionPlus
properties
execute()
(b)
ActionPlus kernel6(...); kernel6.execute(...,FK6(...));
(c)
Fig. 3.2.From the UML representation to the C++ representation of performance model.
Figure 3.2 depicts an example of transition from the UML representation to the C++ representation of performance model. For the illustration of this transformation process serves the model of kernel 6 that we introduced in Figure 3.1. We use the stereotypeaction+to represent a code block of a program. In Figure 3.2(a) the actionKernel6, which is an instance of stereotypeaction+, represents the kernel 6. For the modeling element action+we have defined the corresponding classActionPlus(see Figure 3.2(b)). In the context of Performance Prophet, the class ActionPlus is implemented as a C++ class. The properties of modeling elementaction+ are mapped toproperties of the classActionPlus. The performance behavior of the modeling elementaction+ is defined in the methodexecute() of the classActionPlus. Figure 3.2(c) depicts the textual representation of the model of kernel 6. We may observe that the name of the instance of modeling element (in our example Kernel6) is mapped to the name of the instance of classActionPlus (in our example kernel6).
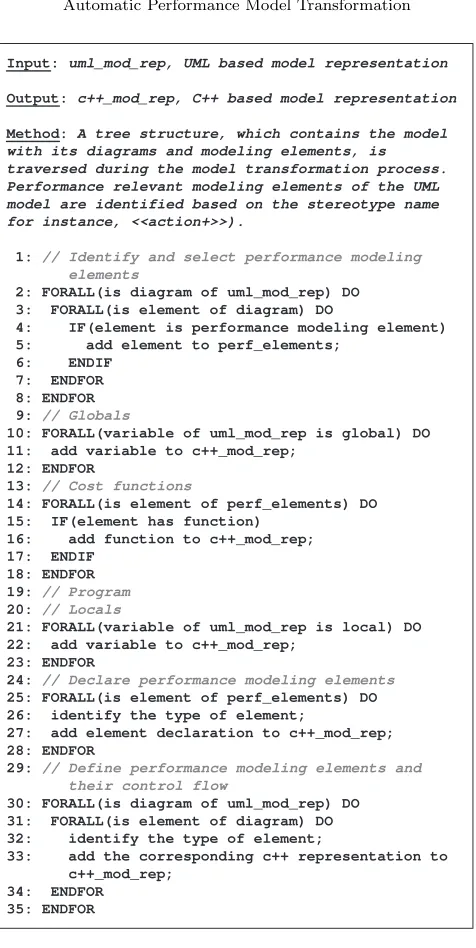
Input: uml_mod_rep, UML based model representation
Output: c++_mod_rep, C++ based model representation
Method: A tree structure, which contains the model with its diagrams and modeling elements, is traversed during the model transformation process. Performance relevant modeling elements of the UML model are identified based on the stereotype name for instance, <<action+>>).
1: // Identify and select performance modeling elements
2: FORALL(is diagram of uml_mod_rep) DO 3: FORALL(is element of diagram) DO
4: IF(element is performance modeling element) 5: add element to perf_elements;
6: ENDIF 7: ENDFOR 8: ENDFOR 9: // Globals
10: FORALL(variable of uml_mod_rep is global) DO 11: add variable to c++_mod_rep;
12: ENDFOR
13: // Cost functions
14: FORALL(is element of perf_elements) DO 15: IF(element has function)
16: add function to c++_mod_rep; 17: ENDIF
18: ENDFOR 19: // Program 20: // Locals
21: FORALL(variable of uml_mod_rep is local) DO 22: add variable to c++_mod_rep;
23: ENDFOR
24: // Declare performance modeling elements 25: FORALL(is element of perf_elements) DO 26: identify the type of element;
27: add element declaration to c++_mod_rep; 28: ENDFOR
29: // Define performance modeling elements and their control flow
30: FORALL(is diagram of uml_mod_rep) DO 31: FORALL(is element of diagram) DO 32: identify the type of element;
33: add the corresponding c++ representation to c++_mod_rep;
34: ENDFOR 35: ENDFOR
Fig. 3.3.The algorithm for model transformation from UML to C++.
the C++ model representation are included theglobal variables, cost functions, and themodel structure (that is performance modeling elements and their flow). Lines 9–12 of the algorithm are responsible for generation of C++ representation of the global variables. Lines 13–18 generate C++ representation of the cost functions (for instance,double FA1(){ ...};). The model structure is defined in the lines 19–35. If there are local variables defined in the UML model, then their C++ representation is generated in the lines 20–23. Lines 24–28 declare the performance modeling elements (for instance, ActionPlus A1(...);). In the lines 25–35 it is defined the execution flow of modeling elements. The algorithm generates the C++ code that for each performance modeling element invokes its execute() method (for instance, A1.execute(uid, pid, tid, FA1());). The execution order of performance modeling elements is in accordance with the specified flow in the UML model.
procedure, first, the Traverser sends the navigation command to the Navigator. Then, the Traverser obtains the current elementce from the Navigator. Finally, the Traverser asks the ContentHandler to visit the element ce and generate the corresponding code.
:Navigator :Traverser
:ContentHandler
1: navigationCommand() 3: visitElement(ce)
2: ce := getCurrentElement()
Fig. 3.4.The UML communication diagram of the Performance Prophet model traverser.
The Navigator, the Traverser, and the ContentHandler are independent of each other in the sense that they only communicate via well-defined interfaces (see Figure 3.4). Therefore, each implementation of one of these components can be combined with any implementation of the other two components. Performance Prophet provides the necessary interfaces and base classes and default implementations of the Navigator, Traverser and ContentHandler. Commonly, the extension of Performance Prophet for the generation of a specific model representation involves only a specific implementation of the ContentHandler interface.
In the following section we illustrate our methodology with an example using the Performance Prophet.
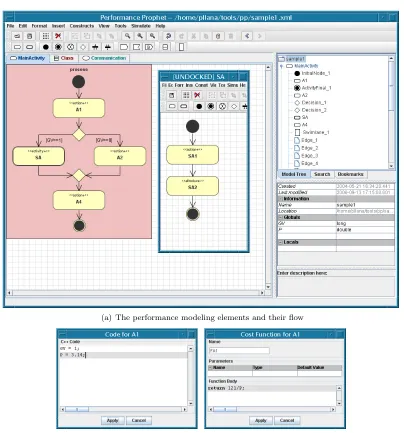
4. Example. Figure 4.1 depicts the process of UML based specification of a sample performance model for a hypothetical program. The user specifies the type of performance modeling elements and their flow. Furthermore, the user may associate a code fragment and a cost function to each performance modeling element. Each performance modeling element corresponds to a code block of a hypothetical program, whose performance is modeled. The example in Figure 4.1(a) illustrates the hierarchical modeling capabilities of Performance Prophet. On the left hand side of Figure 4.1(a) is depicted the main activity diagram, which comprises a set of instances of stereotypesaction+andactivity+. After the execution of actionA1 is completed, based on the value of variableGV, it is decided whether to execute the activitySAor the actionA2. While anaction is not further decomposed into other elements, an activity contains a set of elements. The content of an activity is described with an activity diagram. The content of activitySA, which is an instance of stereotypeactivity+, is depicted in the undocked diagramSAin Figure 4.1(a). ActivitySAcomprises performance modeling elements SA1 andSA2.
It is possible to associate global and local variables to the model. The name and the type of global and local variables may be specified as properties of the model. On the right-down corner of Figure 4.1(a), in the list of properties of sample model, we may observe that variablesGV andP are specified as global variables of the model. We are aware that this sample model could be expressed without the use of global variables, but nevertheless we opted for this solution for illustration purposes.
Figure 4.1(b) depicts an example of the code association to a performance modeling element. This feature can be used to complement C++ representation of the performance model. In this example we have associated a code fragment to the performance modeling elementA1, which assigns values to global variablesGV andP. Figure 4.1(c) depicts an example of the association of a cost function to a performance modeling element. A cost function models the execution time of the code block that is represented by the performance modeling element. A cost function may use local or global variables as parameters. Moreover, a cost function may be composed using other functions that are defined in the performance model. In this example we have associated a simple parameterized cost function to the performance modeling elementA1.
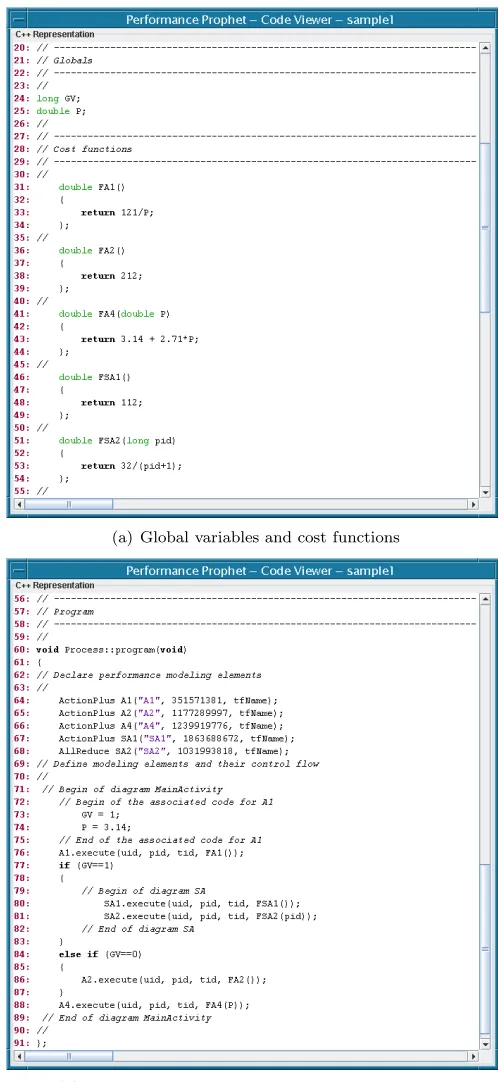
Figure 4.2 depicts the C++ representation of the sample model, which is automatically generated by the Performance Prophet based on the UML representation. The model transformation from UML to C++ repre-sentation is based on the algorithm that we presented in Figure 3.3.
(a) The performance modeling elements and their flow
(b) Code fragment association (c) Cost function association
Fig. 4.1.The UML based specification of a sample model.
modeling element{A1, A2, A4, SA1, SA2} it is defined a cost function{FA1, FA2, FA4, FSA1, FSA2}(code lines 31–54). As parameters of cost functions may be used the properties of system components (such as number of processors, or the ID of process). For instance, the cost functionFSA2 takes pid as a parameter, which is the process ID. Please note that the cost functions presented here serve the purpose of illustration of various forms of expressing cost functions, and that these cost functions are not derived from a real-world program.
(a) Global variables and cost functions
(b) Execution flow of performance modeling elements
Fig. 4.2.The C++ representation of the sample model.
element A1. The branch control flow of the UML model representation (see Figure 4.1(a)) is mapped to the if-else-ifstatement in C++ model representation (lines 77–87).
5. Case Study. In this section we demonstrate the usefulness of our approach by modeling and simu-lating a real-world material science program. For our case study we use LAPW0, which is a part of WIEN2k package [20]. WIEN2k is a program package for calculation of the electronic structure of solids based on the density-functional theory. It is worth to mention that the 1998 Nobel Prize in Chemistry was awarded to Walter Kohn for his development of the density-functional theory. LAPW0 calculates the effective potential within a unit cell of a crystal. The code of LAPW0 program is written in Fortran 90 and MPI [5]. LAPW0 comprises about 15,000 lines of code.
A1
A2 A4
A5 A7
A8 A10
A11
A0 A3 A6 A9
Process 0 Process 1 Process 2 Process 3
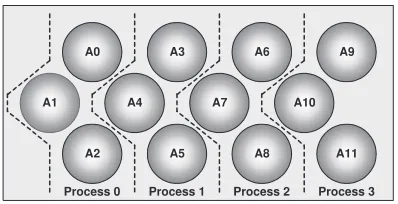
Fig. 5.1.An instance of LAPW0 domain decomposition. Number of atoms (NAT) is 12; number of atoms per process (PNAT) is 3.
LAPW0 is executed in SPMD fashion (all processors execute the same program) on a multiprocessor computing system. A domain decomposition approach is used for parallelization of LAPW0 (see Figure 5.1). The unit of material, for which LAPW0 calculates the effective potential, comprises a certain number of atoms (N AT). Atoms are evenly distributed to the available processes. This means that each process is responsible for calculation of the effective potential for a subset of atoms. ForN P available processes, each process obtains P N AT = N AT /N P atoms. LAPW0 uses an algorithm that aims to distribute a similar (if not the same) number of atoms to each process for any given positive integer values of the number of atoms and the number of processes.
. . .
Node 1 (SGI 1450)
4 x Pentium III Xeon 700MHz, 2GB ECC RAM
Node 2 (SGI 1450)
4 x Pentium III Xeon 700MHz, 2GB ECC RAM
Node 16 (SGI 1450)
4 x Pentium III Xeon 700MHz, 2GB ECC RAM
Myrinet Fast Ethernet
Fig. 5.2.Experimentation platform. Gescher cluster has 16 SMP nodes. Each node has four processors.
Figure 5.2 depicts the architecture of Gescher cluster, which is located at Institute of Scientific Computing, University of Vienna. Gescher is a 16 node SMP cluster. All nodes of Gescher are of type SGI 1450. Each node of the cluster has four Pentium III Xeon 700MHz processors , and 2GB ECC RAM. The nodes of Gescher are interconnected via a 100Mbit/s Fast Ethernet network and a Myrinet network. For our experiments we have used the Fast Ethernet network. Gescher serves as our platform for performance measurement experiments of LAPW0.
In what follows in this section we develop and evaluate the model of LAPW0 with Performance Prophet. We validate the model of LAPW0 by comparing simulation results with measurement results.
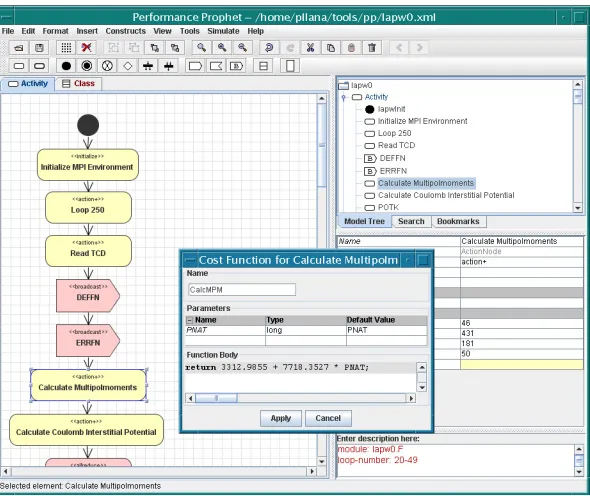
Fig. 5.3.Performance modeling of LAPW0.
This cost function was generated based on measurement data by using regression. Regression is a technique for fitting a curve through a set of data values using some goodness-of-fit criterion.
Fig. 5.4.An excerpt of C++ representation of performance model of LAPW0.
Figure 5.4 depicts an excerpt of C++ representation of performance model of LAPW0 that is generated by Performance Prophet based on the specified UML model. We may observe that C++ representation of performance model includes 302 lines of code. This C++ representation is used as input for the Performance Estimator of Performance Prophet.
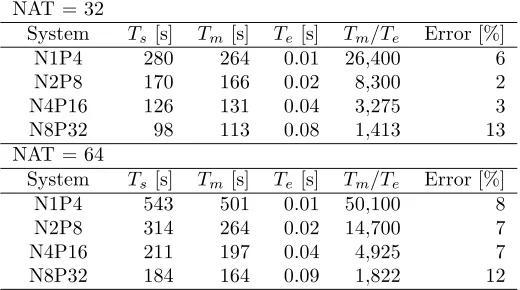
Table 5.1
Simulation and measurement results for LAPW0. In N xP y, x denotes the number of nodes N, and y denotes the total number of processesP.Tsis simulated time,Tmis measured time, andTeevaluation time. All times are expressed in seconds [s].
NAT = 32
System Ts[s] Tm[s] Te[s] Tm/Te Error [%]
N1P4 280 264 0.01 26,400 6
N2P8 170 166 0.02 8,300 2
N4P16 126 131 0.04 3,275 3
N8P32 98 113 0.08 1,413 13
NAT = 64
System Ts[s] Tm[s] Te[s] Tm/Te Error [%]
N1P4 543 501 0.01 50,100 8
N2P8 314 264 0.02 14,700 7
N4P16 211 197 0.04 4,925 7
N8P32 184 164 0.09 1,822 12
LAPW0 forN AT = 32 andN AT = 64. The system configuration is determined by the number of nodes and the number of processing units. We have validated the performance model of LAPW0 for the following system configurations: one node and four processes (N1P4), two nodes and eight processes (N2P8), four nodes and 16 processes (N4P16), eight nodes and 32 processes (N8P32). Each node comprises four processors. On each processor is mapped one process.
Table 5.1 depicts simulation and measurement results for LAPW0. The second column of table, which is indicated withTs, shows the performance prediction results for LAPW0 that we have obtained by simulation. Measurement results of LAPW0 are presented in the third column, which is indicated with Tm. The column that is indicated withTe presents the CPU time needed for evaluation of the performance model of LAPW0 by simulation. All simulations were executed on a Sun Blade 150 (UltraSPARC-IIe 650MHz) workstation. We compare the time needed to execute the real LAPW0 program on our SMP cluster with the time needed to evaluate the performance model on a Sun Blade 150 workstation in the column that is indicated withTm/Ts. We may observe that model-based performance evaluation of LAPW0 with Performance Prophet was several thousand times faster than the corresponding measurement-based evaluation. The rightmost column of the table shows the percentage error, which serves to quantify the prediction accuracy of Performance Prophet. We have calculated the percentage error using the following expression,
Error[%] = |Ts−Tm| Tm
100,
whereTsis the simulated time andTmis the measured time. We may observe that the prediction accuracy of Performance Prophet for LAPW0 was between 2% and 13%. The average percentage error was 7%. Simulation and measurement results for LAPW0 are graphically presented in Figure 5.5.
6. Conclusions. In this paper we have described our methodology for the development of performance models of programs. Our approach supports the graphical specification of performance models in a human-intuitive fashion on one hand, and on the other hand is amenable to the machine-efficient model evaluation. The model transformation, from the graphical human-intuitive form (that is, UML representation), to the form that can be efficiently evaluated by machine (that is, C++ representation), is performed automatically. We have illustrated our methodology with the transformation of a sample performance model using the Performance Prophet modeling system.
The usefulness of our approach has been demonstrated by modeling and simulating LAPW0, which is a real-world material science program that comprises about 15,000 lines of code. In our case study, the model evaluation with Performance Prophet on a single processor workstation was several thousand times faster than the execution time of the real program on our SMP cluster. We validated the model of LAPW0 by comparing the simulation results with measurement results for two problem sizes and four system configura-tions.
0 100 200 300 400 500 600
N1P4 N2P8 N4P16 N8P32
System
Execution Time [sec.]
Simulation(64) Measurement(64) Simulation(32) Measurement(32) NAT=64
NAT=32
Fig. 5.5.Simulation and measurement results for LAPW0.
REFERENCES
[1] V. Adve, R. Bagrodia, J. Browne, E. Deelman, A. Dube, E. Houstis, J. Rice, R. Sakellariou, D. Sundaram-Stukel, P. Teller, and M. Vernon, POEMS: End-to-End Performance Design of Large Parallel Adaptive Computational Systems, IEEE Transactions on Software Engineering, 26 (2000), pp. 1027–1048.
[2] G. Booch, J. Rumbaugh, and I. Jacobson,The Unified Modeling Language User Guide, Second Edition, Addison Wesley Professional, 2005.
[3] L. Dagum and R. Menon,OpenMP: An Industry-Standard API for Shared-Memory Programming, IEEE Computational Science and Engineering, 5 (1998), pp. 46–55.
[4] S. Graham, M. Snir, and C. Patterson,Getting Up to Speed: The Future of Supercomputing, The National Academies Press, 2004.
[5] W. Gropp, E. Lusk, and A. Skjellum,Using MPI—2nd Edition: Portable Parallel Programming with the Message Passing Interface (Scientific and Engineering Computation), MIT Press, 1999.
[6] D. Grove and P. Coddington,Performance Modeling and Evaluation of High-Performance Parallel and Distributed Sys-tems, Performance Evaluation, 60 (2005), pp. 165–187.
[7] C. Hughes, V. Pai, P. Ranganathan, and S. Adve,RSIM: Simulating Shared-Memory Multiprocessors with ILP Processors, IEEE Computer, 35 (2002), pp. 40–49.
[8] H. Karatza,Applied System Simulation: Methodologies and Applications, Springer, 2003, ch. Simulation of Parallel and Distributed Systems Scheduling, Concepts, Issues and Approaches.
[9] D. Kerbyson, A. Hoisie, and H. Wasserman,Use of Predictive Performance Modeling During Large-Scale System Instal-lation, Parallel Processing Letters, 15 (2005).
[10] D. Kvasnicka, H. Hlavacs, and C. Ueberhuber,Simulating Parallel Program Performance with CLUE, in International Symposium on Performance Evaluation of Computer and Telecommunication Systems (SPECTS), Orlando, Florida, USA, July 2001, The Society for Modeling and Simulation International, pp. 140–149.
[11] F. H. McMahon,The Livermore Fortran Kernels: A Computer Test of the Numerical Performance Range, Tech. Report UCRL-53745, Lawrence Livermore National Laboratory, Livermore, California, December 1986.
[12] Message Passing Interface Forum (MPIF).http://www.mpi-forum.org/
[13] G. Nudd, D. Kerbyson, E. Papaefstathiou, S. Perry, J. Harper, and D. Wilcox,PACE—A Toolset for the Performance Prediction of Parallel and Distributed Systems, International Journal of High Performance Computing Applications, 14 (2000), pp. 228–251.
[14] Object Management Group (OMG),UML 2.0 Superstructure Specification.http://www.omg.org August 2005. [15] Open specifications for Multi Processing (OpenMP). http://www.openmp.org/
[16] S. Pllana, S. Benkner, F. Xhafa, and L. Barolli,Hybrid Performance Modeling and Prediction of Large-Scale Computing Systems, in International Conference on Complex, Intelligent and Software Intensive Systems (CISIS 2008), Barcelona, Spain, March 2008, IEEE Computer Society.
[17] S. Pllana, I. Brandic, and S. Benkner,A Survey of the State of the Art in Performance Modeling and Prediction of Parallel and Distributed Computing Systems, International Journal of Computational Intelligence Research (IJCIR), 4 (2008).
[18] S. Pllana and T. Fahringer,On Customizing the UML for Modeling Performance-Oriented Applications, in UML 2002, “Model Engineering, Concepts and Tools”, LNCS 2460, Dresden, Germany, Dresden, Germany, October 2002, Springer-Verlag.
[20] K. Schwarz, P. Blaha, and G. Madsen,Electronic structure calculations of solids using the WIEN2k package for material sciences, Computer Physics Communications, 147 (2002), pp. 71–76.
[21] A. Snavely, L. Carrington, N. Wolter, J. Labarta, R. Badia, and A. Purkayastha,A Framework for Performance Modeling and Prediction, in The 2002 ACM/IEEE conference on Supercomputing, Baltimore, Maryland, USA, November 2002, ACM.
[22] M. Snir, S. Otto, S. Huss-Lederman, D. Walker, and J. Dongarra,MPI: The Complete Reference, MIT Press, 1998.
Edited by: Fatos Xhafa, Leonard Barolli Received: September 30, 2008