DOI: 10.22092/IJFS.2018.115499
Population dynamics of
Carasobarbus
luteus
in Shadegan
International Wetland, Iran
Ghorbani R.1*; Hedayati A.1; Hashemi A.R.1; Abolhasani M.H.2; Haghi Vayeghan A.1; Amini Chermahini M.3
Received: June 2016 Accepted: October 2016
Abstract
Seasonal samplings were conducted over a year to study population dynamic of Carasobarbus luteus in Shadegan Wetland. Samples were collected from five sampling stations in Shadegan Wetland (Salmane, Rogabe, Khoroosi, Mahshahr and Atish) from April 2014 to March 2015. From total number of 1608 samples, 276 individuals were male and 1332 individuals were female. Length-weight relationship was W=0.013L3.0124 (R2=0.92) for males; and W=0.0136L3.0117 (R2=0.91) for females, showing an isometric growth pattern. Condition factor (K) was calculated to be 1.308±0.15 and 1.368±0.17 for the males and females, respectively, showing significant difference between the genders (p<0.05). Also, the results show that this species spawns in April-July with a long spawning period and sexual dormant period in autumn to early winter. Mean length at maturation was 161 and 174 mm for males and females specimens; whereas, weight of matured fish was 60 and 80 g for the males and females, respectively. Growth indices including L∞, growth coefficient and t0 were 305 and 301 mm, 0.67 and 0.55 per year and 0.23 and 0.29 for the males and females, respectively. Natural mortality, fishing mortality, total mortality, Munro Ф' and coefficient of exploitation were 1.22 and 1.02 per year, 1.61 and 1.45 per year, 2.83 and 2.47 per year, 2.79 and 2.72, and 0.57 and.59, respectively for the males and females.
Keywords: Carasobarbus luteus, Shadegan Wetland, Growth and fishing indices, Von-Bertalanffy equation
1-Department of Fisheries, Gorgan University of Agricultural Sciences and Natural Resources, Gorgan, Iran
2-Department of Natural Resources, Faculty of Agriculture, Islamic Azad University, Khorasgan, Isfahan, Iran.
3-Behbahan Khatam Alanbia University of Technology, Khoozestan, Iran Corresponding author’s E-mail: rasulghorbani@gmail.com
358 Ghorbani et al., Population dynamics of Carasobarbus luteus in… Introduction
Population dynamics is one of the functional sub-divisions of population ecology and fundamentals of fish stock biology (Biswas, 1993). Population dynamic elements are fundamental of analytical models in the field of stock assessment, which provide important information about stocks’ status (King, 2007). Estimation of length at
maturation, spawning time,
determination of fishing prohibition time and optimum length for catch is important information about a fish species. Population dynamics is related to sequential processes of regeneration and production, which are known as growth and mortality. Stocks’ conservation is a global important key factor in sustainable exploitation of whole aquatic resources. Fisheries authorities focus on providing enough and assured food from natural resources considering the allowable exploitation (Jenning et al., 2000). Population dynamics is one functional sub-divisions of the population ecology and fundamentals of fish stock biology (Biswas, 1993). Carasobarbus luteus (Heckel, 1843) is a freshwater fish belonging to Carasobarbus sp. and Cyprinidae family. The maximum and average length of C. luteus is 38 and 23 cm, respectively (Ahmed, 1982; Borkenhagen, 2005). This species is
found in the middle and lower parts of rivers, preferring standing waters near aquatic plants and algae (Coad, 2006). Increased demand for C. luteus has caused increased pressure on this species population (Hashemi et al., 2012); therefore, study on biological characteristics, population structure and growth factors are important for this species. With an area of 537700 ha (the area varies in different years), Shadegan Wetland encompasses about 34% of the total wetlands of Iran according to the Ramsar Convention (1971). Shadegan Wetland is located at 3°,17′-3°,48′ N and 48°,17′-48°,50′ E (Bogutskaya et al., 2008). The aim of this study was to estimate length at maturation and spawning time and to determine fishing prohibition time and optimum length for catch of C. luteus.
Materials and methods
Samplings were conducted seasonally over a year. Five sampling stations including Salmane (30°,40′N: 48°,28′E), Mahshahr (30°,52′N: 48°,30′E), Rogabe (30°,41′N: 48°,33′E), Khoroosi (30°,39′N: 48°,40′E) and Atish (30°,54′N: 48°,40′E) were selected in such a way to cover the whole wetland area (Fig. 1).
Figure 1: Five sampling stations in Shadegan Wetland.
Length-weight relationship
Measurement of fish length and weight along with the fish age provides useful information about the stock population structure, age of maturation, life span, mortality, growth and production. The following formula was used to calculate relationship between the fish total length and weight:
W=aLb
Where, W was fish weight (g), L was fish length (cm), “a” was constant coefficient, and “b” was the equation power.
The following formula was used to find significant differences between the calculated “b” and B-3 for a fish with similar growth:
t = [(SdX)/(SdYy)] × [│b-3│/ (√ (l-r2)] × [√ (n-2)]
Where SdX is standard deviation of fork length natural log, SdY is standard deviation of weight natural log, “b” is slope, r2 is coefficient of determination and “n” is sample size (Zar, 1996). Condition factor or quality factor was calculated to investigate trend of the
fish condition over the year, using the following formula (Beckman, 1984): K= W×102/L3
Where “W” was the fish weight (g) and “L” was total length (cm).
Sexual maturation stages were determined both macroscopically and microscopically (7-stage key) and stages higher than 4 were considered as matured (Biswas, 1993; Sparre and Venema, 1998; King, 2007).
Fishes are matured just after reaching a certain size; therefore, length-maturation relationship is as useful as length-age relationship (King, 2007). Logistic model and Y=1/(1+exp(-a-bX)) equation were used to estimate length at the first maturation; where, “Y” is the proportion of matured males and females to whole fish within a same length class, “X” is total length (cm) and “a” and “b” are constant coefficients (Biswas, 1993; Sparre and Venema, 1998; King, 2007). Calculation of length-age relationship is important in fish growth study. All analytical methods for stock
360 Ghorbani et al., Population dynamics of Carasobarbus luteus in…
assessment, population dynamic and fish management are based on this information (Sparre and Venema, 1998). Infinite length (L∞) is defined as the maximum length that the fish of a stock are able reach to. There are several methods to estimate L∞ (Sparre and Venema, 1998), which Powell-Wetherall graph in the present study.
Calculation of K with Shepherd method Similar to L∞, K is one of the Von-Bertalanffy equation growth parameters. After calculation of L∞, K is calculated using FiSAT software (Gayanilo et al., 2003). The shepherd program of FiSAT software estimates the K curve best fitted on longitudinal histograms (Pauly et al., 1998).
Growth performance index
Munro Ф' test is used to compare growth indices in the studied area (Pauly, 1984):
Ф' = Log(K) + 2Log(L∞)
Where L∞ is infinite length, K is growth coefficient and Ф' is growth index.
t0 calculation
The optimum T0 is calculated according to experimental formula of Pauly (Froese and Binohlan, 2000):
Log (-t0)=-0.3922-0.2752 Log(L∞) - 1.038 Log(K)
Total mortality (Z)
Coefficient of total mortality is calculated using the method of longitudinal frequency to catch curve conversion. In this method, total mortality is calculated using growth
parameters and conversion of length mode of each longitudinal class to relative age. Proportion of fish number in each longitudinal class is calculated monthly (Gayanilo et al., 2003).
Coefficient of natural mortality (M) Natural mortality is defined as that caused by factors other than fishing. These factors include hunting by other animals, food deprivation, global climate change stresses, diseases and aging. Pauly experimental formula was used to calculate coefficient of natural mortality (M) in the present study: Ln(L∞)=0.0152– 0.279 Ln(L∞) + 0.6543 Ln(K) + 0.463 Ln(T)
Where M is annual coefficient of natural mortality, L∞ is infinite length (cm), K is curve parameter of Von-Bertalanffy growth equation and T is the mean ambient temperature (King, 2007). Coefficient of fishing mortality (F) is calculated from total mortality and natural mortality using the following formula:
F = Z – M
Coefficient of exploitation calculation (E)
Coefficient of exploitation is calculated using this formula: E=F/Z. If E is lower than 0.5, the stock is underexploited. If the stock is overexploited, the value of E would be higher than 0.5. In fact, the E value is optimum when fishing mortality is equal to natural mortality; so that E =0.5 (King, 2007).
Production/biomass ratio or population production (P/B)
Production/biomass or population production (specific production) is
Iranian Journal of Fisheries Sciences 17(2) 2018 361
calculated using this formula P/B = 2.64Wmat-0.35; where Wmat is fish weight at maturation (Randall and Minns, 2000).
Virtual model of population analysis Virtual model of population analysis and cohort analysis are obtained using FiSAT program. The value of L∞, K, M, F, a (constant) and b (power) are used as inputs for the model. t0 is considered zero. VPA functional methods have been determined by Pauly (Pauly, 1984). These analyses were conducted in SPSS, Minitab and FiSATII software.
Results
This study was conducted in Shadegan Wetland and a total number of 1608 fish were sampled that underwent biometry. 276 samples were male and 1332 samples were female. Mean length (length range) in the males was 161±28 (110-222) mm, whereas it was 174±38 (95-280) mm in the females. Mean weight (weight range) in the males was 60±31 (15-175) g, whereas it was 80±39 (15-370) g in the females. Mean length (length range) of whole samples was 217±58 (95-280) mm, whereas mean weight (weight range) of whole samples was 164±120 (15-370) g. Data classification was performed with 20 mm intervals. Longitudinal classes and frequencies of C. luteus are presented in Table 1. The maximum and minimum longitudinal frequencies are 155-175 (25.37%) and 95-115 (0%)
for the males and 175-195 (41.42%) and 275-295 (0.07%), respectively (Table 1).
Table 1. Longitudinal classification and frequency percentage of longitudinal classes of Carasobarbusluteus in Shadegan Wetland
in 2014-2015. Longitudinal
classification(mm)
Frequency (%) male
Frequency (%) female
95-115 1.12 0.43
115-135 11.57 3.76
135-155 25.37 13.86
155-175 35.82 40.82
175-195 22.01 28.03
195-215 2.99 8.06
215-235 1.12 3.01
235-255 0 1.39
255-275 0 0.53
275-295 0 0.11
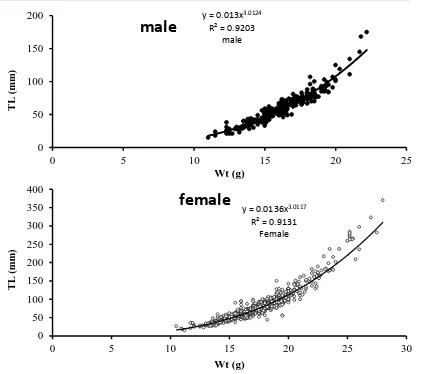
Length-weight relationship was W=0.013L3.0124 (R2=0.92) for males; W=0.0136L3.0117 (R2=0.91) for females (Fig. 2). The value of standard error was low (<0.5), so that keeps the b value within isometric growth range. There was no significant difference between the calculated b and expected B (=3) values. The value of b in the fish length-weight relationship was near 3, which is due to their isometric growth. The minimum and maximum condition factors in the males and females were observed in May and January. Condition factor (K) was calculated to be 1.308±0.15 and 1.368±0.17 for the males and females, respectively, showing significant difference between the genders (p<0.05). Overall, the males had lower condition factor than females and the maximum and minimum values were observed in winter and spring.
362 Ghorbani et al., Population dynamics of Carasobarbus luteus in…
Figure 2: Length-weight relationship in male (A) and female (B) Carasobarbus luteus in Shadegan
Wetland.
Figure 3: Condition factor in different seasons in Shadegan Wetland.
Frequency of different gonadal developmental stages was determined using the 7-stage key and is presented in Fig. 4. This figure shows that
spawning of C. luteus occurs in April-July with a long spawning period and sexual dormant period in autumn to early winter.
y = 0.013x3.0124
R² = 0.9203 male
0 50 100 150 200
0 5 10 15 20 25
T
L
(
m
m
)
Wt (g)
male
y = 0.0136x3.0117
R² = 0.9131 Female
0 50 100 150 200 250 300 350 400
0 5 10 15 20 25 30
T
L
(
m
m
)
Wt (g)
female
b a
d
c
0 0.5 1 1.5 2 2.5
Spring Summer Fall Winter
C
o
n
d
iti
o
n
Fa
cto
r
Season
Iranian Journal of Fisheries Sciences 17(2) 2018 363
Figure 4: Spawning stages of Carasobarbus luteus in Shadegan Wetland.
LM50 curve (the length at which 50% of the fish are matured) was obtained according to the fish longitudinal classification and frequency of matured individuals in each class. Length at maturation was 152 and 139 mm for the males and females, respectively (150
mm for whole individuals); whereas, weight at maturation was 42 and 100 g, respectively. P/B was 0.71 and 0.52, and consumption to biomass ratio was 15.41 and 12.37 for the males and females, respectively.
Figure 5: Length at maturation in male (A) and female (B)
Carasobarbus luteus in Shadegan Wetland.
L∞ was 305 and 310 mm, growth coefficient was 0.67 and 0.55 per year, and time for t0 was -0.23 and -0.29 for the males and females, respectively (Fig. 6). Natural mortality was 1.22 and 1.02 per year, fishing mortality was
1.61 and 1.45 per year, total mortality was 2.83 and 2.47 per year, Munro Ф' was 2.79 and 2.72, and coefficient of exploitation was 0.57 and 0.59 per year in the males and females, respectively (Fig. 7).
0 20 40 60 80 100
M
atu
ri
ty Per
ce
n
t
Month
stages 7 stages 6 stages 5 stages 4 stages 3 stages 2
364 Ghorbani et al., Population dynamics of Carasobarbus luteus in…
Figure 6: Growth coefficient of the male (A) and female (B) Carasobarbus luteus in Shadegan Wetland.
Figure 7: Catching curve obtained from longitudinal frequency data of the male (A) and female (B) Carasobarbus luteus in Shadegan Wetland.
Von-Bertalanffy equation for the male and female C. luteus population in 2015 was Lt=305 (1- exp (-0.67(t+0.23))) and Lt=310(1-exp(-0.55(t+0.29))),
respectively. In this equation Lt is the fish fork length (mm) and t is the fish age (year).
Using the curve, length of C. luteus was calculated for each longitudinal class based on virtual population analysis. In males, probability of catch maximizes in longitudinal class of 20 cm and falls afterward. In females, probability of catch maximizes in longitudinal class of 18 cm and
Iranian Journal of Fisheries Sciences 17(2) 2018 365
fluctuates afterward. Considering the virtual population analysis for either of the genders, survivorship falls and fishing mortality elevates along with increase in the fish length from 15 cm to higher values (Fig. 7).
Fig. 6. Virtual analysis of population obtained from longitudinal frequency data of the male (A) and female (B) C. luteus in Shadegan Wetland
Discussion
The biometry data show that the fish weight and length elevation reduces in higher ages and females usually have higher weight and length than males. Differences in length-weight relationships of C. luteus were reported from different geographical regions, which is due to variations in the condition of the regions. In Shadegan Wetland, higher weight was observed at same lengths in some stations, which may be related to nutritional conditions. Variation in length-weight relationships may be due to seasonal variations, environmental factors, fish physiological condition at sampling time, gender, gonad developmental stage and nutritional conditions in the environment (Yildirim et al., 2002). Trend of K data shows that the maximum and minimum values are observed in pre-spawning (winter) and spawning (spring), respectively, and the mean K values of the females were higher than those of the males. Generally, male and female populations have similar K value pattern. Variation of K values in different regions is related to several factors including population density, diseases, nutrition,
spawning style, age and aquatic resource type (King, 2007). C. luteus spawns in Shadegan Wetland in spring, which is similar to what has been reported in Hoorolazim Wetland. Studies on sexual maturation stages and percentage of matured (C.luteus in Hoorolazim Wetland show that the highest number of matured fish is present in April. This suggests that percentage of the matured fish increases in late winter with temperature elevation, which finally spawn in the middle of spring (May and June), which is somehow in line with other studies. In the other regions, most Barbus sp. species spawn in late winter to early spring, and such a negligible difference in spawning time is related to environmental characteristics and water temperature (Dutta et al. 2012). Considering other studies on C. luteus, it seems that L∞ of this species is higher in Turkey and Syria than that in Iran and Iraq; in other words, L∞ is higher in cold water than in warm water. However, variation of L∞ and other growth indices in different regions may be due to quality and quantity of feeds and climatic conditions (Bartulovic et al., 2004). Several factors can affect fish growth including age, gender, season, year, nutrition, physiological conditions, feed availability and reproduction cycle (Dutta et al. 2012). Population size of a species is dependent on survival and reproduction success and considering the constant fluctuation in environmental conditions, each species should adapt different conditions, otherwise cannot survive. Therefore, growth parameters of a
366 Ghorbani et al., Population dynamics of Carasobarbus luteus in…
species show fluctuations in different years and should be investigated in different times (Cengiz, 2012). Comparison of length at maturation of C. luteus between Shadegan and Hoorolazim Wetlands suggest that the Shadegan population matures earlier than the population in Hoorolazim. Length at maturation varies among different species depending on environmental conditions, life span and feed type; also, environmental factors directly affect age and length at maturation (Dutta et al., 2012). No systemic trend was observed in t0 values in different sampling stations being -0.37 for the whole sampling satiations of Shadegan Wetland. Age at zero length varies in different regions depending on environmental factors and change in L∞ and growth coefficient. Age at zero length elevates along with growth coefficient elevation and L∞ demotion (Sparre and Venema, 1998). Ф' value ranges 2.3-2.93 being 2.3 (Hashemi et al., 2011) for Shadegan Wetland. Variations in ecological conditions and latitude may affect infinite length and growth coefficient, which in turn affect Ф', and even in a single region, variable values are observed at different time because of variation in environmental conditions (Sparre and Venema, 1998). Coefficient of exploitation (E) of this species was higher than 0.5; thus, the stock is overexploited. Coefficient of exploitation of higher than 0.5 along with higher fishing mortality compared to natural mortality show the stock is under overfishing pressure (King, 2007). Catching size quantity and
environmental factors that affect the stock survival are the factors causing pressure on the stock (Mateus and Estupina, 2002). It seems that P/B or population production (specific production) of C. luteus is not high in Shadegan Wetland. P/B of inland water fish ranges from 0.2-3 and usually is higher in warm regions compared to cold regions. Population production (specific production) can indicate fish population growth potential in respect to habitat production capacity (Jenning et al., 2000). P/B is more important than production; because if P/B of different organisms of an ecosystem is available, production of a certain regions can be calculated and populations with different biomasses can be compared among different regions. Feed consumption rate (Q/B) of C. luteus is high, which was expected regarding the fact that this species is omnivorous. Palomares and Pauly (1999) reported that fishes with forked caudal fin have higher aspect ratio and consume more feed, which is in line with the present study. Virtual population analysis for each longitudinal class showed that catch probability for C. luteus increases along with the fish length elevation up to 18 cm (maximum fishing mortality) and fluctuates thereafter. Also, according to results it showed that females are more abundant and have higher fishing mortality than males.
References
Ahmed, H.A., 1982. Crowth (sic) of the cyprinid fish, Barbus luteus (Heckel) in Tharthar Reservoir, Iraq.
Iranian Journal of Fisheries Sciences 17(2) 2018 367
Bulletin of the Basrah Natural History Museum, 5, 3-15
Bartulovic, V., Glamuzina, B., Conides, A., Dulcic, J., Lucic, D., Njire, J. and Kozul, V., 2004. Age, Growth, mortality and sex ratio of sand smelt, Atherina boyeri, Risso, 1810 (Pisces: Atherinidae) in the Estuary of the Mala Neretva River (Middle-Eastern Adriatic, Croatia), Journal of Applied Ichthyology, 20, 427-430.
Beckman, C.W., 1984. The length-weight relationship, Factor for conversions between standard and total lengths, and coefficients of condition for seven Michigan fishes. trans. American Fisheries Society, 75, 237-256.
Biswas, S.P., 1993. Manual of methods in fish biology. Asian Publishers. Pvt. Ltd. 157P.
Bogutskaya, N.G., Naseka, A.M. and Tikhonov, P.A., 2008. A brief history of the study of fishes of the Caspian Sea and scientific results of the Caspian Expedition of 1904 headed by N. M. Knipovich. Aqua, International Journal of Ichthyology, 14(1), 1-26.
Borkenhagen, K., 2005. Systematik
und zoogeographie der
"groβschuppigen Barben" des vorderen orients. Diplomarbeitan der
Mathematisch-Naturwissenschaftlichen Fakultät der Christian-Albrechts-Universitätzu Kiel. pp. 121- 128.
Cengiz, O., 2012. Age, growth, mortality and reproduction of the chub mackerel (Scomber japonicus Houttuyn, 1782) from Saros Bay
(Northern Aegean Sea, Turkey. Turkish Journal of Fisheries and Aquatic Sciences. 12, 799-809.
Coad, B.W., 2006. Endemicity in the freshwater fishes of Iran. Iranian Journal of Animal Biosystematics, 1(1), 1-13.
Dutta, S., Maity, S., Chanda, A. and Hazra, S., 2012. Population structure, mortality rate and exploitation rate of Hilsa Shad (Tenualosa ilisha) in West Bengal Coast of Northern Bay of Bengal, India. World Journal of Fish and Marine Sciences, 4(1), 54-59.
Froese, R. and Binohlan, C., 2000. Empirical relationships to estimate asymptotic length, length at first maturity and length at maximum yield per recruit in fishes, with a simple method to evaluate length frequency data. Journal of Fish Biology, 56, 758-773.
Gayanilo, F.C. Jr., P. Sparre and Pauly, D., 2003. FAO-ICLARM stock assessment tools (FiSAT) user’s guide. FAO Computerised Information Series (Fisheries). No. 8. Rome, FAO, 266P.
Hashemi, S., Eskandary, Gh., Ansary, H. and Yooneszadeh, M., 2011. Stock assessment and production of fish species in the Shadegan Wetland, Iran. World Journal of Fish and Marine Sciences, 3(6), 502-508.
Hashemi, S., Eskandary, Gh. and Ansary, H., 2012. Biomass of fish species in the Shadegan Wetland, IRAN. Research Journal of Recent Sciences, 1(1), 66-68.
368 Ghorbani et al., Population dynamics of Carasobarbus luteus in… Jenning, S., Kasier, M. and Reynold,
J., 2000. Marine fisheries ecology. Black well Science. 391P.
King, M., 2007. Fisheries biology and assessment and management. Fishing News Press, 340P.
Mateus, A. and Estupina, B., 2002.
Fish stock assessment of piraputanga Brycon microlepis in the Cuiaba River Basin, Pantanal of Mato Grosso, Brazil. Brazilian Journal of Biology, 62(1), 165-170.
Palomares, M.L.D. and Pauly, D., 1999. Predicting the food consumption of fish populations as functions of mortality, food type, morphometrics, temperature and salinity. Marine and Freshwater Research, 49, 447-453.
Pauly, D., 1984. Fish population dynamics in Tropical waters: A manual for use with programmable calculators. Clarm. Manila. 425P.
Pauly, D., Christensen, V., Dalsgaard, J., Froese, R. and Torres, F., 1998. Fishing down marine webs. Journal Science, new series, 279(5352), 860-863.
Ramsar Convention. 1971. http://www.ramsar.org/Wetlands
International Ramsar.
http://www.ramsar.org/key_sitelist.h tm sites database. 2002
Randall, R.G. and Minns, C.K., 2000. Use of fish production per unit biomass ratios for measuring the productive capacity of fish habitats. Canadian Journal of Fisheries and Aquatic Sciences, 57, 1657-1667.
Sparre, P. and Venema, S. C. 1998.
Introduction to tropical fish stock
assessment, FAO Fisheries technical paper, Roma, 450P.
Yildirim, A., Erdogan, O. and Turkmen, T., 2002. On the age, growth and reproduction of the
barbel, Barbus plebejuse
(Steindachner, 1897) in the Oltu Stream of coruh River (Artvin-Turkey). Turkish Journal of Zoology, 25, 163-168.
Zar, J.H., 1996. Biostatistical analysis. 3rd edition. Prentice-Hall Inc., New Jersey, USA. 662P.


![[13- 21] on the mechanical behavior of different grades of](data:image/gif;base64,R0lGODlhAQABAIAAAP///wAAACH5BAEAAAAALAAAAAABAAEAAAICRAEAOw==)