ISSN: 2374-2348 (Print), 2374-2356 (Online) Copyright © The Author(s).All Rights Reserved. Published by American Research Institute for Policy Development DOI: 10.15640/arms.v5n1a4 URL: https://doi.org/10.15640/arms.v5n1a4
Using Approach Quantile Regression to Determine the Factors Affecting Measuring
Capacity in Iraq
Ali Sadig Mohommed Bager
1Meshal Harbi Odah
2Bahr Kadhim Mohammed
3Abstract
The studies relevant to taxes are so important in financial studies because of the importance of taxes of in state budget. This is on the one hand, while on the other they acquire their importance as a result of achieving their goals within their philosophy through the capacity tax for the concerned countries. It is therefore highly important to conduct studies and researches to ensure the measurement of the capacity tax in accordance with modern scientific methods because of the importance of these studies as a financial phenomenon to achieve the goals of economic and social state in addition to the financial target which is the main role in financing public expenditure . Accordingly, it has been relied on quantile regression method a statistical method to reach the scientific prediction in the measurement of capacity tax in Iraq to recognize the effect variables in their measurement.
Keywords: Capacity tax, Tax revenue, Quintile regression
Introduction
Taxes play an important role in the economies of most countries, regardless of their political and economic systems for they are considered a source of funding for the state budget as well as the role they play in the re-distribution of national income andachieving economic stability. Studies on taxation occupy the forefront place in the financial studies within the scope of science of public finance because of the importance of taxes in the state budget on the one hand, and because of their importance in achieving the goals of the state within its philosophy on the other hand, through the capacity tax for thosecountries.
It is important to identify the tax structure in Iraq to find out how the capacity tax ismeasured. The taxes that exist in Iraq are those which tax money, and there is no tax on individuals. The tax system in Iraq is based on a combination of direct taxes and indirect taxes. In the sense of the system's reliance on a multi-tax system and not a single tax system. The direct taxes in Iraq are those imposed on the income which are the income taxes and those on property which are the property taxes. There is only asingle tax imposed on capital which is called the real property or landstax. As for indirect taxes, on the other hand, they include both taxes on consumption and taxes on trade.
1 The Bucharest University of Economic Studies, Department of Statistics and Econometrics, MuthannaUniversity, Iraq . [email protected]
2 The Bucharest University of Economic Studies, Department of Statistics and Econometrics, Muthanna University, Iraq . [email protected].
There are three types of consumption taxes which are the customs taxes, production taxes and sales taxes. Below is a flipchart diagram for the current tax structure in Iraq.
1.1. Capacity tax
The concept of capacity tax or as sometimes called the estimated national cost tax or the idealistic tax burden covers the ability of the GNI's ability to afford the tax, or the ability to represent the extremities of revenue that can be collected through axes, taking into account the size of the GNP and its structure, and the amount of public expenditure and the level of productivity taking into account at the same time the individual's ability to pay taxes and the government's ability to levy and collect them. As for the measuring of tax capacity , there are many attempts to set the capacity tax some of which are the attempts by the World Bank staff and others, and the most important of which are those related to the measurement of the capacity tax such as the study by Bahle and the study by Chellia and Kole.[13][18]
1.2. Tax revenue
The tax revenue is considered one of the most important components of state revenues, as they grow and increase according to the increase in the volume of economic activity of the state, and hence emerges the importance of tax revenue because it provides the state with what enable it to fulfill its basic role. The tax revenue is the outcome of manufacturing industries, trade, mining, services, monetizing, agriculture, etc. So it has become important to plan for such a revenue, and therefore, studies and researches must be conducted to ensure the measurement of capacity tax and forecasting for the subsequent years using modern scientific methods and to identify the variables affecting its measurement.
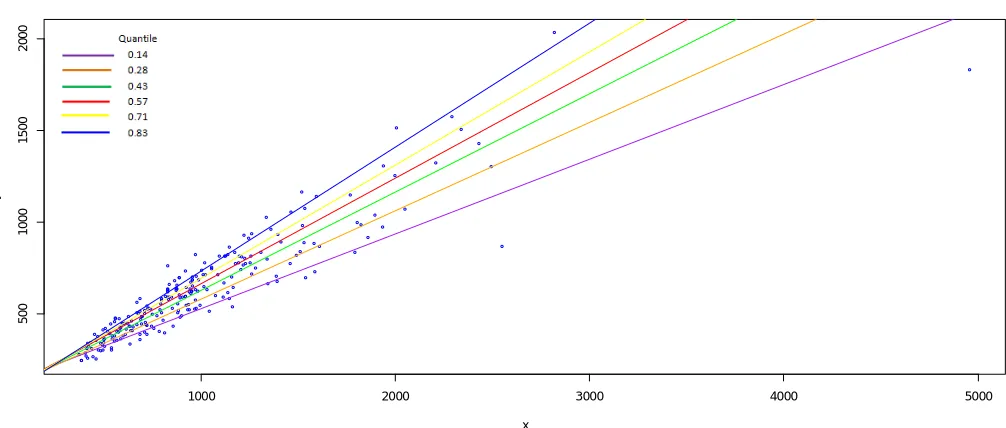
It has been relied, therefore, on the quantile regression methodwhich a statistical method is used to arrive at the scientific prediction of measuring thecapacity tax in Iraq. We will study, accordingly, the impact of six variables on the response capacity taxvariable using some regression analysis methods quantile to build models that may represent the relationship between the response variable and a set of independent variables that can provide full coverage of all sectors of the response variable tax capacity through a series of quantile regression lines and choosing the optimal
quantile regression line in the analysis of the variables of the study. We will select in this research the six lines quantile regression through ratio quantile which is a specific mathematical function.
Each line of these lines represents a separate gradient initself; later on we determine the variables that directly affect the capacity tax scale in Iraq and excluding the unimportant variables. In this paper weare using the [R] programmingwhich is a free software. Through use the packages ("quantile"), contributed by Koenker. SeeKoenker [6]. This research aims to conduct a study in which the most important factors that may influence measuring the capacity tax in Iraq are determined, while a range of factors related to capacity tax have been taken alongside trying to find the variables affecting its measurement by using the quantile regression method. This paper is organized as follows. In Section 2, we illustrate method of Quantile Regression.In Section 3, we employ these quantile regression method on a sample data. In Section 4, we present a conclusion of the study.
Methods of quintile regression
In this study we will use quantile regression model,to clarify the most important variables that affect the capacity tax measure in Iraq.
2.1 Concept of quintile regression
It is well known that the main objective of the regression analysis is to evaluate the relationship between the dependent variable and a set of independent variables. Quantile regression is progressively emerging as a comprehensive approach to the statistical analysis of linear models. A number of papers have newly appeared on the application of quantile regression (see Cole and Green, 1992; Royston and Altman, 1994; Buchinsky,1998; Yu and Jones,1998; He et al.,1998;Koenker and Machado, 1999)[1][2][8][16][22].
Analysis quantile regression is a fundamental corner of the knowledge of statistics and an important method of applied statistics when studying all economic and social phenomena among variables.It is one of the statistical tools most widely used because it gives us an easy way to determine the relationship among variables. This relationship can be expressed in the equation containing the variant response variable the dependant with one or more of the explanatory variables, independent. It is also possible to define the gradient as a set of statistical methods dealing with different formulas formathematical models that describe the relationships between variables ,so that you can use models of these relationships for the purposes of prediction. It could be argued that the regression analysis quantile regression serve three main purposes which are description, control and prediction (Koenker, R. (2005).[5]).
2.2 Quintile and quintile function
Symbolizes it
Q(p)
where define as the :
p = p X
≤
x
when x
= x
Then
x
is call (p-quantile)
value of quantile cumulative distribution function and the quantile
function is the inverse of the cumulative distribution function we can explained that as follows :
( ) =
( )
and
( ) =
( )
where isthe value of quantile proportion 0 < < 1 .
0 < < < … … … < < 1
( ) = ( ) ( ) = ( )
∞
The Quantile function (QF) , It possible takes abundant names relative to quantiles proportion (Qp) in population distribution where determine this proportion through as the following formula :
=
+ 1 = 1,2, … … …
Where quantiles operation,and is index of quantileand number of quantile lines.
And also is the selection of lines quantile according to the nature of the study data for example if we study hypertension and hypotension , if We will choose the lines that pass hypertension data if we studied hypertension and if we studied hypotension then choose the lines that pass hypotension. Where this property that motivate us to choose the quantile regression model. Which is easy in study phenomenon data representation.
2.3. Mathematical model of quantile regression.
It can be described quantile regression model by the following equation:
= + + (1)
Where it is dependent variable and ( ) they are parameters of model,
set of independent variablesassociated with the ℎ quantile , and θrandom error (where 0< P < 1) . We will get specific proportion for set of quantile regression models according to the following:
( | ) = = 0.14 ℎ . ( | ) = .
( | ) = = 0.28 ℎ . ( | ) = .
( | ) = = 0.43 ℎ . ( | ) = .
( | ) = = 0.57 ℎ . ( | ) = .
( | ) = = 0.71 ℎ . ( | ) = .
( | ) = = 0.85 ℎ . ( | ) = .
By use quantile regression must estimate its parameters, in case of prediction.
For the estimating the parameters of quantile regression model, It possible to through minimizing following equation.
|( −( + )| (2)
Where lossfunction ( )is:
( ) = (P)|( − + ) | − + ≥0
−(1− )|( − + ) | − + < 0 (3)
Form equation (3) we seek to minimize weighted sum residuals( − ) where weight ( ) takes positive residuals and weight(1− )takes negative residuals. We can estimate parameters quantile regression model through following formula:
∑ ( , ) = ∑ − + +(1− ) ∑ − +
3. The sample of study
This study is based on data taken from statistical groups Ministry of Planning, which it is a monthly tax calculated value measure thousands of dinars and for a period of five years (2011-2015) research sample are 60 observations. For the purpose of building the proposed statistical model of capacity tax (Y = ratio of tax revenue / GDP ) and as a dependent variable .This study is based on six explanatory variables (independent), which represents sectors (economic activities) involved in the calculation of GDP.
We will explain the variables as follows:
X1 : average per capita income
X2: Mining sector contributions in GDP (It means extract any wealth unlimited (such as oil, natural gas, etc.)
X3:Trade sector contributions in GDP (Mediation process and to mediate between the producer and the consumer)
X4 : Government spending sector contributions in GDP (It is a government-provided services and public expenditure)
X5 :manufacturing sector contributions in GDP (involves the conversion of raw materials to final products)
X6 :Monetization sector contributions in GDP(Monetization is the process of converting or establishing something into legal tender While it usually refers to the coining of currency or the printing of banknotes by central banks).
Description Statistic
*Source: Generated by the author, using The R Project for Statistical Computing
To calculate the results quantile regression model accounted for all of the regression line separately, each regression model quantile must be accounted for independently of each other in accordance with the percentage quantile regression. We will get six lines (according to supposition the researcher) can be calculated by the following formula:
θ = for q = 1, … . , Q.(5)
The quantile proportion are
P = 1
Q + 1=
1
7 = 0.14 , P =
2
7 = 0.28 , P =
3
7 = 0.43 , P =
4
7 = 0.57 ,
P =5
7 = 0.71 , P =
1
7 = 0.85
3.2. Results analysis quintile regression model
The results of the six tables represent the means we will depend on in determining the best analysis, which represent a phenomenon studied through of the value R square is represent ability of independent variables in explaining dependent variable (which is measure capacity tax in Iraq ) where whenever the value R-square was high represents the best option. Through the tables above for quantile regression model we will depend on the value of The pseudo-R square, which represents ability the independent variables in explaining variation to measure capacity tax, which through we will choose the best model quantile ,which represents the highest value to pseudo-R square. For the comparison between the value of pseudo-R square in the tables, we find that the value of pseudo-R square in table (2) recorded the highest value of (pseudo-R square =0.8712446). This means that independent variables they are (average per capita income X1, mining X2 , trade X3, services X4, manufacturing X5,monetizing X6 )which could explain( 87.12%) (Out of the variation in the capacity tax measure which indicates the strength of the quantile regression model in the ratio of quantile (0.28) in the representation of the studied data phenomenon. If we noticed the rest of the tables we will see that the pseudo-R square are weak ratio of any unable to interpret would be very small and therefore it will be very weak quantile model.
1000 2000 3000 4000 5000
5
0
0
1
0
0
0
1
5
0
0
2
0
0
0
x
y
Table (1) showsanalysis quantile regression model at quantile proportion = ( . ) Pr(>|t|) t value Std. Error Coefficients Variables 0.72907 -0.34820 42545.9 -14814.65 Intercept 0.34905 0.94480 0.40862 0.38606 X1 0.80918 -0.24269 0.43904 -0.10655 X2 0.35872 0.92584 0.38345 0.35502 X3 0.24038 -1.18737 0.30442 -0.36145 X4 0.00000 5.77930 0.30475 1.76123 X5 0.87264 -0.16109 0.37447 -0.06032 X6
The pseudo-R square = 0.42430
*Source: Produced by the author, using The R Project for Statistical Computing.
Table (2) showsanalysis quantile regression model at quantile proportion = ( . )
Pr(>|t|) t value Std. Error Coefficients Variables 0.87509 0.15796 42248.58 6673.75 Intercept 0.34854 -0.94580 0.34742 -0.32859 X1 0.89920 -0.12728 0.35359 -0.04501 X2 0.07584 1.81081 0.35668 0.64587 X3 0.34673 0.94940 0.30743 0.29187 X4 0.00021 6.32124 0.28207 1.88303 X5 0.42589 -0.80243 0.32014 -0.25689 X6
The pseudo-R square = 0.8712446
*Source: Produced by the author, using The R Project for Statistical Computing
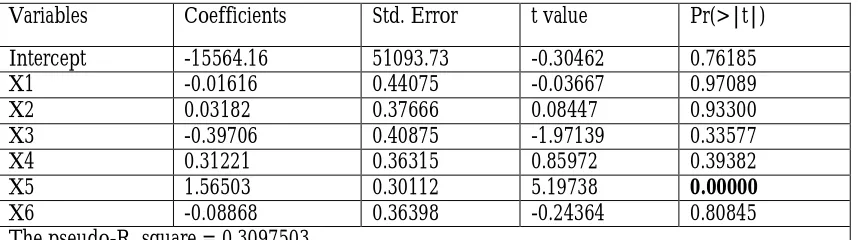
Table (3) shows analysis quantile regression model at quantile proportion = ( . )
Pr(>|t|) t value Std. Error Coefficients Variables 0.76185 -0.30462 51093.73 -15564.16 Intercept 0.97089 -0.03667 0.44075 -0.01616 X1 0.93300 0.08447 0.37666 0.03182 X2 0.33577 -1.97139 0.40875 -0.39706 X3 0.39382 0.85972 0.36315 0.31221 X4 0.00000 5.19738 0.30112 1.56503 X5 0.80845 -0.24364 0.36398 -0.08868 X6
The pseudo-R square = 0.3097503
Table (4) shows analysis quantile regression model at quantile proportion = ( . ) Pr(>|t|) t value Std. Error Coefficients Variables 0.44384 0.77149 61288.29982 47283.60811 Intercept 0.63644 0.47543 0.40515 0.19262 X1 0.90398 -0.12121 0.46485 -0.05635 X2 0.14649 -1.47364 0.33769 -0.49763 X3 0.28671 1.07621 0.40820 0.43931 X4 0.00014 4.11594 0.38470 1.58341 X5 0.97143 0.03598 0.44014 0.01584 X6
The pseudo-R square = 0.5480587
*Source: Produced by the author, using The R Project for Statistical Computing
Table (5) showsanalysis quantile regression model at quantile proportion = ( . )
Pr(>|t|) t value Std. Error Coefficients Variables 0.02075 2.38368 53404.21822 127298.59456 Intercept 0.73889 0.33507 0.39653 0.13287 X1 0.29984 -1.04702 0.44564 -0.46659 X2 0.10681 -1.64057 0.43501 -0.71367 X3 0.78272 0.27718 0.40662 0.11271 X4 0.00236 3.19397 0.49817 1.59115 X5 0.75102 0.31894 0.45054 0.14370 X6
The pseudo-R square = 0.1946801
*Source: Produced by the author, using The R Project for Statistical Computing
Table (6) showsanalysis quantile regression model at quantile proportion = ( . )
Pr(>|t|) t value Std. Error Coefficients Variables 0.40490 0.83960 60654.14952 50925.31957 Intercept 0.64558 0.46254 0.43998 0.20351 X1 0.84720 0.19364 0.42568 0.08243 X2 0.22932 -1.21615 0.40646 -0.49431 X3 0.33525 -0.97243 0.44720 -0.43487 X4 0.00042 3.76193 0.42212 1.58799 X5 0.96148 -0.04852 0.45389 -0.02202 X6
The pseudo-R square = 0.2353987
Figure(3) shows estimate of the variables coefficients
Conclusions
In this paper we studied the factors (average per capita income , Mining sector contributions in GDP ,Trade sector contributions in GDP,Government spending sector contributions in GDP, manufacturing sector contributions in GDP ,Monetization sector contributions in GDP) which affect the capacity taxes in Iraq by using quantile regression model. The results of the analytic quantile regression model have shown that the best model to represent the data from this studied phenomenon is the quantile regression model in the ratio (0.28) and this is according to the value R = 0.8712446, which shows the strength of this model in explaining the variation in measuring capacity tax through theindependent variable compared to quantile regression model in the ratio another quantile. We found that there is one variable of manufacturing X5, as an important aspect of statistics, as though the rest were of no importance.
From the results of the method, we find that the variable X5 manufacturing industry is the most important one in explaining this variation in capacity tax measurement in each ratio quantile used in this paper because of Iraq's dependence on oil export revenue source foundation to finance the development of sectors of Iraq's economy, as it depends on the prosperity of Iraq's energy sector and the oil sector represents more than 70% of GDP in Iraq. Based on the research and conclusions, we recommend using quantile regression according to its own characteristics, which is the quantile regression model representation where the full population providesthe complete picture for the observations spread through the study, to a number of quantile regression lines. We also recommend diversification in the field of employment in other areas such as agriculture or medicine.
0.2 0.4 0.6 0.8
0 e + 0 0 1 e + 0 5
(Inte rce pt)
0.2 0.4 0.6 0.8
-0 .2 0 .0 0 .2 0 .4 x 1
0.2 0.4 0.6 0.8
-0 .4 -0 .2 0 .0 x 2
0.2 0.4 0.6 0.8
-0 .7 0 -0 .5 5 -0 .4 0 x 3
0.2 0.4 0.6 0.8
-0 .2 0 .0 0 .2 0 .4 x 4
0.2 0.4 0.6 0.8
1 .2 1 .4 1 .6 1 .8 x 5
0.2 0.4 0.6 0.8
References
Buchinsky, M.,(1998). “Recent advances in quantile regression models”. J. Hum. Res. 33, 88–126.
Cole, T.J., Green, P.J.,(1992). “Smoothing reference centile curves: LMS method and penalized likelihood”. Statist. Medic. 11, 1305–1319.
Chelliah, R.J., B. Hessel and M. Kelly, (1996). “Tax Ratios and Tax Effort in Developing Countries”, 1969-1971, Staff Paper, Vol. 22, No. 1, March.
Chelliah, R.J. (1998). “Trends of Taxation in Developing Countries”, Staff Paper, Vol. XVIII,No. 1. Jones, Sally. M., (2004). “Principles of Taxation, edition”, University of Virginia,.
Kath N., P. Hall, (2000-2001). “Taxation, Theory and practice”, Financialtimes, Pearson Education, England, London, New York.
Koenker, R. (2005). “Quantile Regression”. Cambridge Books, Cambridge University Press. Koenker, R. (2013). Quantreg: Quantile regression. R package version 5.05.
Koenker, R. and G. J. Bassett (1978). “Regression quantiles”. Econometrica 46, 33-50.
Koenker, R. and J. A. F. Machado (1999). “Goodness of fit and related inference processes for quantile regression”. Journal of the American Statistical Association 94, 1296-1310.
Prest, A. R, (2003). “The Taxable Capacity of Country”, In: Taxation and Economic Development, ed., J. F. Toye, Frank Case and o. Ltd. London.
Raja J. Chelliah, “Taxation and Economic Surplus, Readings on Taxation in Developing Countries”. Edited by Richard M. Bind and Oliver Oldman. The John Hopkins Press, London, (2004).
Richard, B., and O. Oldam, (2002).“Trend in Taxation in Asia by UNEC for Asia and the Far East”, the John Hopkins Press, London.
Richard, B. and O. Oldman, (2002).“Reading on Taxation in LDCs”, 3rd.ed. The John Hopkins Press, London, Roy, W. B., “A Regression Approach to Tax Effect and Tax Ratio Analysis, Staff Paper”, Vol. 18, Nov, (2000). Royston, P., and Altman, D.G. (1994). “Regression using fractional polynomials of continuous covariates:
parsimonious parametric modeling.” Appl.Statist.43,429-468
Sayed N., (1999). “Taxation and Economic Development. A case Study of the Sudan”, Khartoum University Press, Khartoum.
Schnipper, A. J. (1999) “How To Pay Zero Taxes”. McGraw-Hill. Inc.U.S.A.
Simon, J. and C. Nobes, (2000-2001). "The Economics of Taxation", Pearson Education, Harlow, England, London, New York.
Spencer, Milton H, (1993). "ContemPorary Micro EconomicsU", New York, Worth publicshers, Inc. Spencer, M. H (2000). “Contemporary Microeconomics.” New York Worth Publishers, Inc.