A Data-Driven Hybrid Urban Flood Modelling
Approach
Xiaohan Li
1and Patrick Willems
11 KU Leuven, Dept. of Civil Engineering, Hydraulics Section, 3001 Leuven, Belgium
Abstract
Urban flood pre-warning decisions made upon urban flood modeling is crucial for human and property management in urban area. However, urbanization, changing environmental conditions and climate change are challenging urban sewer models for their adaptability. While hydraulic models are capable of making accurate flood predictions, they are less flexible and more computationally expensive compared with conceptual models, which are simpler and more efficient. In the era of exploding data availability and computing techniques, data-driven models are gaining popularity in urban flood modelling, but meanwhile suffer from data sparseness. To overcome this issue, a hybrid urban flood modeling approach is proposed in this study. It incorporates a conceptual model to account for the dominant sewer hydrological processes and a logistic regression model able to predict the probabilities of flooding on a sub-urban scale. This approach is demonstrated for a highly urbanized area in Antwerp, Belgium. After comparison with a 1D/0D hydrodynamic model, its ability is shown with promising results to make probabilistic flood predictions, regardless of rainfall types or seasonal variation. In addition, the model has higher tolerance on data input quality and is fully adaptive for real time applications.
1
Introduction
Urban catchments differ from natural ones due to their highly impervious structure such as roads and buildings. Therefore, urban sewer network efficiency is of great significance to urban hydrological responses. Failures of sewer networks result in urban flooding that leads to significant social economic impacts.
The main challenges for urban sewer modelling include accuracy in time and space, fast computing time, and, very importantly, adaptability. Extensive studies focusing on these have been done in the field of hydrodynamic modelling (detailed models) and hydrological modelling (conceptual models) respectively, which suffer from either computation inefficiency (low adaptability) or inadequacy (low accuracy) (Wolfs & Willems, 2017).
Engineering
Volume 3, 2018, Pages 1193–1200
Recently, new types of modeling that utilize computation intelligence to reproduce hydrodynamic modeling accuracy is gaining interest (Wolfs & Willems, 2017). However, the application of this type of models is exceptionally restricted for urban applications, for the acquisition of detailed field sewer data including pipe flows and water levels are hardly possible.
Another type of data - flood reports, becomes more commonly available for urban area, thanks to the ever rising popularity of social media and the rising in public awareness of the urban flood impacts. Commonly reported by residents’ on social media and local news, it contains information about the real flooding occurrence of a certain neighborhood, and has the advantage of containing specific street names (sometimes a picture showing the severity of the surrounding area) and time stamps.
While gaining more and more attention (Gaitan, van de Giesen, & ten Veldhuis, 2016), due to the binary nature of the these flood reports, studies of their application are still limited. In the field of urban flood modelling, flood reports are simply used to validate detailed models performance at a certain location for post-event analysis. In the field of risk analysis, they are frequently combined with damage reports or insurance claims for flood damage modelling (Van Ootegem, et al., 2018).
In this study, a hybrid modelling approach based on this type of flooding information is proposed. Based on a conceptual model to represent real hydrological responses of an urban catchment, it incorporates a logistic regression model able to predict the probabilities of flooding on a sub-urban scale. The proposed approach is tested for the case study of Merksem, a district of the city of Antwerp in Belgium. Comparison is also made with the results of a 1D/0D hydrodynamic model.
2
Data and Study Area
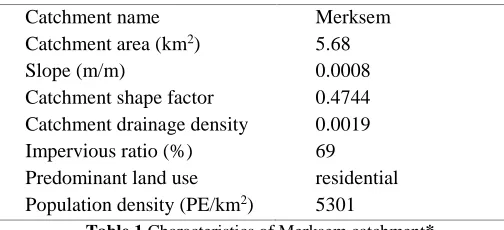
Antwerp is a highly urbanized city in Belgium. Previous study has shown that higher rainfall extremes are observed in the city Centre in comparison with its surrounding area, probably due to the urban heat island effect (Willems, et al., 2016). District of Merksem, located in the north of the Antwerp city center, is chosen as pilot catchment. Table 1 provides a description of this pilot catchment.
Catchment name Merksem
Catchment area (km2) 5.68
Slope (m/m) 0.0008
Catchment shape factor 0.4744 Catchment drainage density 0.0019 Impervious ratio (%) 69 Predominant land use residential Population density (PE/km2) 5301
Table 1 Characteristics of Merksem catchment*
Sewer model
For the purpose of comparison, a 1D/0D hydrodynamic model has been made available for the pilot catchment by the water company Water-link. Main characteristics of this model are summarized in Table 2.
Radar Rainfall
Radar rainfall data were made available for this study by the Royal Meteorological Institute of Belgium. They consist of composite quantitative precipitation estimates (QPEs) from two C-band radars: Wideumont and Jabbeke, with temporal resolution of 5min and spatial resolution of 1km. Detailed description of the QPE algorithm applied can be find in Goudenhoofdt & Delobbe (2009).
Total pipe length (m) 109588 Number of subcatchments 1390 Mean/median/STD contributing
area of subcatchments (ha) 0.396/0.216/0.568 Mean/median/STD slope of
subcatchments (m/m) 0.003/0.002/0.0056 Rainfall-runoff volume estimation
model
Fixed percentage runoff model (Runoff coefficient of impervious surface as 1, pervious surface as 0.8) Runoff routing model Double linear reservoir
Pipe flow routing model Dynamic wave (Full de St Venant Equation) Modelling software InfoWorks ICM 8.0
Table 2 Characteristics of the 1D/0D hydrodynamic model for Merksem catchment
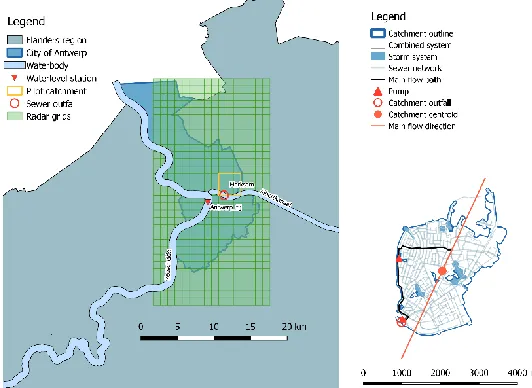
Figure 1 Geographical settings and sewer system layout of Merksem Catchment
Water level
Rainfall-runoff processes in urban hydrology are considered to be dominated by short-duration, local rainfall intensities. In many urban modelling approaches, this process is simplified by assigning a constant runoff coefficient based on land-use characteristics. However, the preliminary analysis of this study has indicated that the accuracy of such estimation is insufficient when using historical rainfall and validation data.
urban canopy and drains it to the downstream water body, the discharge or water level in this water body can be seen as a proxy of the wetness state of the catchment.
The main outfall of the pilot catchment (Figure 1) is located on the Albertkanaal, which is a canal connecting the inland area to the Antwerp port. Located behind the tidal lock structure, the water level in the canal is provisioned to remain at a certain level for shipping purposes, thus cannot be used. Instead, we choose to use the downstream water level in the neighboring river Zeeschelde, whose gauging station is 2.5 km downstream from the outfall of the Merksem sewer. The water level at this station is recorded at a 10 min frequency.
Historical urban flood records
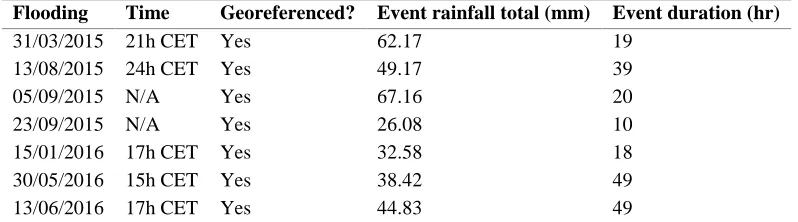
Between 2015 and 2016, 7 flooding events were recorded for the study area. Flood reports were manually collected from fire brigade intervention records, from disaster journalists and from online sources including twitter and local news websites. Due to the different sources, there are discrepancies in the types of information collected for each event in terms of whether it is time stamped or georeferenced. See Table 3 for details of each event.
Flooding Time Georeferenced? Event rainfall total (mm) Event duration (hr)
31/03/2015 21h CET Yes 62.17 19
13/08/2015 24h CET Yes 49.17 39
05/09/2015 N/A Yes 67.16 20
23/09/2015 N/A Yes 26.08 10
15/01/2016 17h CET Yes 32.58 18
30/05/2016 15h CET Yes 38.42 49
13/06/2016 17h CET Yes 44.83 49
Table 3 Information of flooding events collected for Merksem
3
Methodology
3.1
Logistic regression model
Logistic regression is a statistical model to estimate the probability of an event to occur based on one or more independent variables (Kleinbaum D. , 1994). It has been widely used in the field of risk analysis for many natural hazard phenomena including landslides (Althuwaynee, Pradhan, Park, & Lee, 2014), thunderstorm events (Thiery, et al.) and river flooding (Van Dyck & Willems, 2013). In this study, and based on the approach applied by Van Dyck & Willems (2013), it is used to estimate the probability of a flooding event. The response variable Y are categorized events: Y = 1 for flooding events and Y = 0 for non-flooding events; the probability of Y is defined as follows:
𝑃(𝑌) = 1
1+𝑒−𝑋 (1)
Where P(Y) is the probability of flooding of a certain event, in percent, referred as POF hereafter; X is a linear combination of multiple explanatory variables (𝑋𝑖), where 𝑋 = 𝛽0+ 𝛽1𝑋1+ 𝛽2𝑋2+ ⋯ +
3.2
Model variables
We consider in this study two explanatory variables (𝑋1, 𝑋2). One (𝑋1) is the instantaneous system
volume in the sewer network, which is obtained by a linear reservoir model, and the other (𝑋2) is the
catchment wetness, which is approximated from the downstream water level measurements.
Sewer system volume model
The most simple linear reservoir approach has been considered for simulating the system volume of the sewer network. Governed by the continuity equation with a linear outflow-storage relation, analytical solution of the instantaneous storage based on the previous time step is as follows (Vaes, 1999):
𝑉𝑡= 𝑄𝑖𝑛 𝑡 1 𝑘(1 − 𝑒
(−𝑘𝑑𝑡)) + 𝑉
(𝑡−1)𝑒(−𝑘𝑑𝑡) (2)
Where 𝑄𝑖𝑛 [m3] is the inflow volume into the sewer system, approximated as the rainfall amount accumulated on the impervious surface of the catchment, and 𝑘 [hr-1] is the reservoir constant (also known as response factor).
Catchment wetness
The reason of using Zeeschelde water level as a surrogate to catchment wetness has been explained in Section 2. However, these measurements suffer from two drawbacks: 1) the river has a dominating tidal influence; 2) during a heavily overflow event, the water level is affected by nearby urban discharges and can therefore not be considered as an independent variable.
To overcome this, the following approach is adopted: 1) the water level is smoothed by moving average over 12 hours to get rid of the tidal influence; 2) water level at least 1 hours before time of interest, and 48 hours after the time of flooding is considered.
The catchment wetness is then defined as in Equation (3):
𝑊𝑡 = 𝐿𝑡−𝑛 (3)
where 𝑊𝑡 [m] is the catchment wetness, 𝐿𝑡−𝑛 [m] is the water level n hours before current time 𝑡.
3.3
Model optimization
In the model described in Section 3.2, there are two parameters that need to be optimized, the reservoir constant k [hr-1] and the time shift n [hr] respectively. The optimization is initialized by a preselected range based on authors experience working with sewer system characteristics of the study region: 1-3 hr-1 for k; and 1-12 hr for n. It is noted that after optimization, the parameter values aim to represent the variation pattern of the data, but may differ from the true values. Once calibrated, it is assumed that the two parameters are independent from the input rainfall and water level data, unless there is a significant modification in the infrastructure. In the latter case, recalibration of the model would be required.
The calibration process is then to optimize the prediction performance of the logistic regression by maximizing a chosen skill score. The score selected here is the Area Under Curve (AUC) where the curve refers to the Precision-Recall Curve due to the robustness of the P-R curve for imbalanced data, in which the positive samples (flooding events) are significantly less than the negative ones (non-flooding events) (Saito & Rehmsmeier, 2015).
3.4
Model validation
To test the model’s ability to make flood predictions, we split the time series into 2 parts, one for calibrating the model, and the other one for validation. However, due to the limited dataset available for this preliminary study, the parameters k and n are in this study based on all the available data.
4
Result and Discussion
4.1
Acquisition of model variable parameters
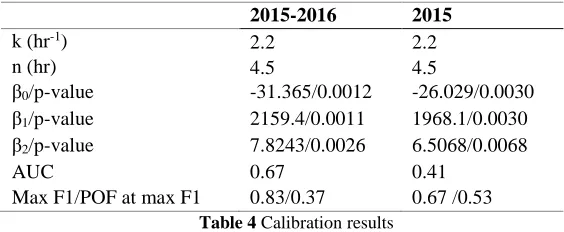
Calibrated based on flood records for the year of 2015 and 2016, the results are shown in Table 4. It is noted that the reservoir constant k has an uncertain range of 2.18-2.32hr-1 with similar performance, due to the limited data. When data for a longer period would become available, the model could be refined, yeilding lower uncertainty in its parameters. However, under the current model setup, the variation is insignificant for the model outcome. Therefore, in the following, a value of 2.2hr-1 is assigned for k.
In addition, p-values obtained for all variables are below 0.05 (significance level of 95%), indicating the importance of chosen variable to the proposed model.
4.2
Calibration and validation result
Using k = 2.2hr-1 and n = 4.5hr, the model is recalibrated for the year 2015 only. Results are given in Table 4.
It is can be seen that the regression model calibrated for 2015 has worse prediction performance compared with the one calibrated for 2015-2016. This confirms the importance of considering a sufficiently long time series or flood records.
2015-2016 2015
k (hr-1) 2.2 2.2
n (hr) 4.5 4.5
β0/p-value -31.365/0.0012 -26.029/0.0030 β1/p-value 2159.4/0.0011 1968.1/0.0030 β2/p-value 7.8243/0.0026 6.5068/0.0068
AUC 0.67 0.41
Max F1/POF at max F1 0.83/0.37 0.67 /0.53
Table 4 Calibration results
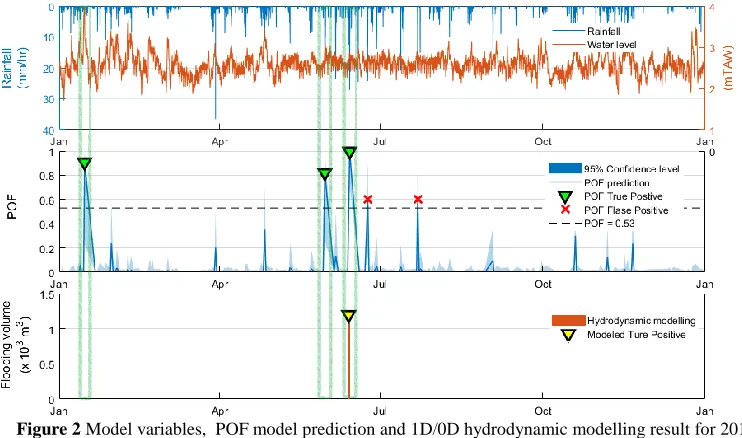
The model calibrated for 2015 only is then applied for validation of the year 2016. A warning threshold of POF = 0.53 is considered for the evaluation of the prediction performance. As a way of comparison, the existing hydrodynamic model for the pilot catchment was run and simulated flooding volumes were obtained for each of the calculation nodes. Figure 2 illustrates the performance of both models and the comparison of their results in flood prediction.
of 0.75, which is also better than the calibration result. On the other hand, the hydrodynamic model predicts only 1 out of the 3 flooding events, which corresponds to a F1 score of 0.5, hence is worse than the POF model. Moreover, the probabilistic nature of the POF model also provides a range of uncertainty that could provide additional information for users to make better waning decisions (flood warning accounting for the uncertainty).
Figure 2 Model variables, POF model prediction and 1D/0D hydrodynamic modelling result for 2016 (Green boxes mark the real flooding occurrences)
5
Conclusions
This paper proposed a new hybrid approach for using crowd sourced information to predict urban flooding at sub-urban scales. The promising results for the Merksem Antwerp case confirm that this kind of information and approach, despite of its coarse resolution and large uncertainty, has significant potential. The success of this approach also introduced a new concept of building an urban flooding warning system that could be optimized regardless of rainfall types or seasonal variations, by incorporating two dominant processes: the time varying sewer storage volume due to rainfall input, drainage and accumulation, and the catchment wetness condition due to antecedent rainfall, ground water recharge and evapotranspiration.
More specifically, below conclusions could be drawn upon this study:
The proposed surrogate method to approximate the catchment wetness state from the water level in a close-by nature waterbody provides , beside the rainfall input, extra insight to the complex urban hydrological responses for the case of Merksem, Antwerp (impervious percentage of 69%).
By adding this extra information about the catchment wetness, the complex highly non-linear hydrological flood process in urban sewers can be simplified by a 0D non-linear conceptual model.
The proposed logistic regression model provides uncertainty estimations which could be useful for decision makers.
The proposed data-driven approach requires data on historical flood records from a consistent data source for calibration and prediction. Compared with hydrodynamic models that demand accurate (unbiased) quantitative rainfall estimates, which are often not available, it is more flexible in terms of model set up and model application.
The parsimonious structure of this model makes it suitable for real time application where new data could be quickly added to the calibration data set by a Bayesian procedure.
This paper also raised the potential of building a warning system for finer scale urban floods in the case where more detailed flooding information is available. However, despite the use of any sewer characteristics, the proposed approach is driven by the real hydrological and hydraulic sewer processes: it therefore can only be applied on a sewer system area that is known to be independent , such that the water is coming from only the area of interest but not routed from other surrounding sewer networks.
References
Althuwaynee, O. F., Pradhan, B., Park, H. J., & Lee, J. H. (2014). A novel ensemble bivariate statistical evidential belief function with knowledge-based analytical hierarchy process and multivariate statistical logistic regression for landslide susceptibility mapping. Catena, 114, 21-36.
Gaitan, S., van de Giesen, N. C., & ten Veldhuis, J. A. E. (2016). Can urban pluvial flooding be predicted by open spatial data and weather data?. Environmental Modelling & Software, 85, 156-171.
Goudenhoofdt, E., & Delobbe, L. (2009). Evaluation of radar-gauge merging methods for quantitative precipitation estimates. Hydrology and Earth System Sciences, 13(2), 195-203.
Kleinbaum, D. (1994). Introduction to Logistic Regression. In D. Kleinbaum, Logistic Regression (pp. 1-38). New York, NY: Springer New York.
Ochoa-Rodriguez, S., Wang, L.-P., Gires, A., Pina, R., Reinoso-Rondinel, R., Bruni, G., . . . ten Veldhuis, M.-C. (2015). Impact of spatial and temporal resolution of rainfall inputs on urban hydrodynamic modelling outputs: A multi-catchment investigation. Journal of Hydrology, 531, 389-407.
Saito, T., & Rehmsmeier, M. (2015). The precision-recall plot is more informative than the ROC plot when evaluating binary classifiers on imbalanced datasets. PloS one, 10(3), e0118432.
Thiery, W., Gudmundsson, L., Bedka, K., Semazzi, F. H., Lhermitte, S., Willems, P., ... & Seneviratne, S. I. (2017). Early warnings of hazardous thunderstorms over Lake Victoria. Environmental Research Letters, 12(7), 074012.
Vaes, G. (1999). The influence of rainfall and model simplification on combined sewer system design. PhD, KU Leuven, Belgium.
Dyck, J., & Willems, P. (2013). Probabilistic flood risk assessment over large geographical regions. Water Resources Research, 49(6), 3330-3344.
Ootegem, L., Herck, K., Creten, T., Verhofstadt, E., Foresti, L., Goudenhoofdt, E., ... & Willems, P. (2017). Exploring the potential of multivariate depth‐damage and rainfall‐damage models. Journal of Flood Risk Management.
Willems, P., Tabari, H., De Niel, J., Van Uytven, E., Lambrechts, G., & Wellens, G. (2016). Current and future pluvial flood hazard analysis for the city of Antwerp. EGU General Assembly 2016, held 17-22 April, 2016 in Vienna Austria, id. EPSC2016-16295, 18.