Wave and tidal power measurement using HF radar
Lucy R Wyatt
School of Mathematics and Statistics University of Sheffield Sheffield, UK S10 2TN Email: l.wyatt@sheffield.ac.uk
Telephone: (44) 114 2223794 and
Seaview Sensing Ltd Sheffield, UK
Email: lucywyatt@seaviewsensing.com
Abstract—The use of HF radar systems located on the coast to measure ocean surface waves and currents is reviewed. Examples are given showing temporal, spatial and directional variability in the wave and tidal power resource. HF radars are unique in being able to provide such data continuously and over wide areas of sea where marine renewable installations are being considered or already in place. Two projects just getting underway at the time of writing are described. One will use HF radar to provide current and wave data for a French tidal stream power application and the other is aimed at supporting the Welsh Wave Hub site whilst also exploring methods to improve the robustness of the HF radar wave measurements.
Index Terms—HF radar, wave directional spectrum, surface current, power, direction.
I. INTRODUCTION
Wave and tidal power installations need information about the available resource and its temporal, spatial and directional variability in order to optimise siting decisions. The same information is also needed for monitoring performance of devices and for ensuring safe installation, testing and opera-tions. Wave buoys and ADCPs provide very useful information for these applications but, unless they are deployed in large numbers, cannot provide information about spatial variability. Satellite measurements are not continuously available at indi-vidual coastal locations and anyway do not provide sufficient information for detailed resource assessment studies. X-band radars can provide some continuous spatial information over ranges up to a few km from the radar although there are some limitations when it is raining. Suitably configured, phased-array [1] HF radars can provide wave measurements to over 100km, and surface currents to over 150km from the coast with spatial resolutions of typically 3-7 km down to 1km at shorter ranges [2], [3], [4]. The most commonly used radar system is the US CODAR Seasonde [5] which provides surface currents over wide ranges but, because it uses a more compact antenna than a phased-array radar, wave measurements [6] are limited to a region close to the radar sites. HF radars also have the advantage that they are normally located on the coast and thus much more easily accessible for maintenance and repairs than an instrument deployed offshore. The ability to measure both waves and currents simultaneously provides
very useful information for renewable system designers and for siting decisions.
The use of HF radar for marine renewable applications has been discussed at previous EWTEC conferences [7], [8] and systems are now beginning to be deployed with this application as the main focus [9]. In this paper the technology will be reviewed, measurements demonstrating the capability presented, and two new deployments discussed, one for a tidal stream power application, the other for a wave power application.
II. HFRADAR CAPABILITIES
A. Current power
HF radar is now a well-accepted technology for surface current measurement and is an important part of many op-erational oceanographic measurement networks ( [4], [10], [11], [12]). Current measurements are made from the Doppler shifts of the dominant peaks in the power spectrum of the radar signal which are induced by the movement of surface waves with half the radio wavelength. Linear ocean wave theory makes it possible to separate the ocean wave phase speed from any underlying current. However the radar is only measuring the surface current so, except in very well mixed seas, cannot provide exact estimates of current power at depth. It can however measure surface currents over a wide area and thus provide guidance for siting of tidal stream devices. In addition the co-spatial co-temporal wave measurements will be important for assessing survivability of devices and providing operational guidance.
Fig 1(a) shows surface current power measurements made with a Pisces HF radar [2] in the Celtic Sea during an operational trial from Dec 2003 to June 2005. The dominant tidal semi-diurnal and spring-neap cycles are clearly seen. To emphasise the joint wave/current measurement capability, Fig 1(b) shows the wave power measured at the same time and place.
B. Wave power
Non-linear ocean wave-wave interactions generate waves that are also half the radio wavelength. These travel at different
SPECIAL ISSUE OF THE TWELFTH EUROPEAN WAVE AND TIDAL ENERGY CONFERENCE, 27 SEPTEMBER - 1 AUGUST 2017, CORK, IRELAND
©EWTEC 2017. THIS IS AN OPEN ACCESS ARTICLE DISTRIBUTED UNDER THE TERMS OF THE CREATIVE COMMONS ATTRIBUTION 4.0 LICENCE (CC BY
h p://creativecommons.org/licenses/by/4.0/). UNRESTRICTED USE (INCLUDING COMMERCIAL), DISTRIBUTION AND REPRODUCTION IS PERMITTED PROVIDED THAT CREDIT IS GIVEN TO THE ORIGINAL AUTHOR(S) OF THE WORK, INCLUDING A URI OR HYPERLINK TO THE WORK, THIS PUBLIC LICENSE AND A COPYRIGHT NOTICE.
02/02 09/02 16/02 23/02 02/03 09/03 16/03 23/03 30/03
05
0.00 0.05 0.10 0.15 0.20 0.25 0.30 0.35
Cu
rre
nt
Po
we
r k
W
pe
r sw
ep
t a
rea
(sq
m
) radar
(a)
02/02 09/02 16/02 23/02 02/03 09/03 16/03 23/03 30/03
05
0 50 100 150 200
Wa
ve
Po
we
r k
W/
m
radar buoy
(b)
Fig. 1. (a) Surface current power; (b) wave power measured with the Pisces HF radar in the Celtic Sea compared with a directional waverider buoy
speeds from the linear waves and generate a lower ampli-tude signal over a range of frequencies in the radar power spectrum. In addition there are non-linear electromagnetic-ocean wave interactions generating responses although these are even lower in amplitude and thus less important over the range of frequencies that are used for wave measurement. These two mechanisms are described by a non-linear integral equation which can be inverted to obtain the ocean wave directional spectrum [13], [14], [15], [16]. Two examples of comparisons of Pisces radar measured directional spectra with those obtained from a directional waverider are shown in Fig 2. It should be noted that the buoy is not measuring the full directional wave spectrum, it only measures the first five Fourier coefficients at each frequency. In this example the buoy spectra are obtained from the Fourier coefficients using a max-imum likelihood method (MLM) [17]. Fig 2(a) is an example showing a wind-sea broad in both frequency and direction. The radar spectrum also includes a low frequency/high period
(a)
(b)
Fig. 2. Comparisons of Pisces radar and wavebuoy directional spectra. In each panel, top left is the energy spectrum, bottom left the mean direction, top right the radar directional spectrum and bottom right that of the buoy. The horizontal axis is period in each case. Log scales are used for the energy and directional spectra.
10' 20' 30' 40'
48' 36' 24' 12'
0 10 20 km pend perr
Wave power
0 10 20 30 40 50 60 70 80 90 100 kW /m (a) 10' 20' 30' 40'48' 36' 24' 12'
0 10 20 km pend perr
Te
6.4 7.2 8.0 8.8 9.6 10.4 11.2 12.0 s (b) 10' 20' 30' 40'48' 36' 24' 12'
0 10 20 km pend perr
Current power
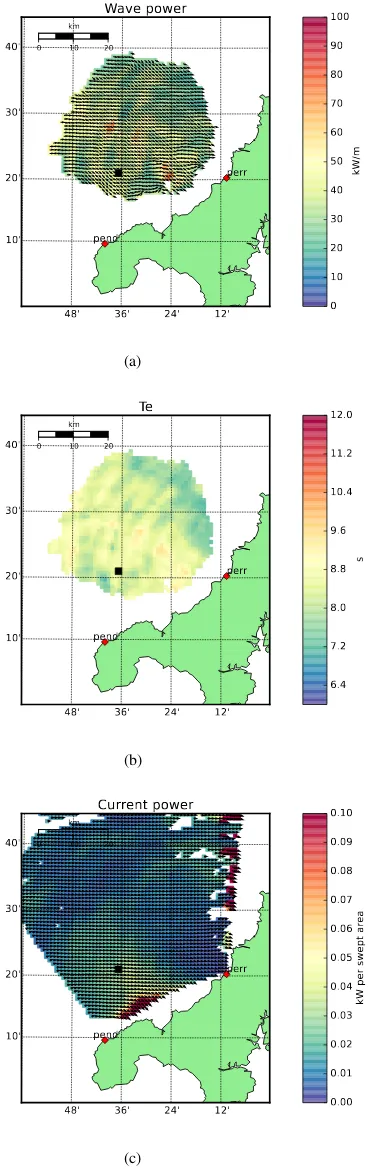
0.00 0.01 0.02 0.03 0.04 0.05 0.06 0.07 0.08 0.09 0.10 kW pe r sw ep t a rea (c)Fig. 3. Maps of (a) wave power and peak direction map measured with University of Plymouth HF radar (at sites indicated with) at Wave Hub (black circle), (b) energy period and (c) current power all measured at the same time 05/02/2012 at 03:00. The Wave Hub location is indicated with. Data provided by Daniel Conley, University of Plymouth
unreliable at low frequencies. The second example, Fig 2(b), shows a spectrum bimodal in frequency, with a larger swell contribution, but with little variation in direction. Apart from the obvious high period issue, in both cases the spectra are in good agreement. In general radar-measured spectra tend to be more spread in both frequency and direction with lower peaks than those seen in the MLM buoy spectra.
Wave parameters, such as significant waveheight, peak direction, wave power and energy period, can be obtained from the directional spectrum using standard methods. Fig 1(b) shows an example of wave power measurements compared with a directional waverider.
Fig 3(a) shows an example of spatial variability in both power and peak direction obtained with WERA HF radars deployed by the University of Plymouth in connection with Wave Hub. The radar provides a measurement of the direc-tional spectrum at each location where there is an arrow on the figure and wave power and peak direction are obtained from this spectrum using standard techniques. Fig 3(b) shows the plot of energy period,TE. For completeness Fig 3(c) shows the surface current power measured at the same time although this is not an area being considered for exploiting this resource. Surface current information is useful for wave power develop-ers as well both for survivablity of systems and for modelling resource in regions of strong wave-current interaction. Note that the intermittent current data along the eastern boundary and the large values on the southern boundary of the radar coverage are most likely contaminated by antenna sidelobes which are a known problem at the northern radar site at this time. Interference of different sorts can limit the range of the coverage at certain times of day; limiting this impact is an area of ongoing active research.
The ability to measure such information at locations such as this over many years (this system has been in place since 2011) provides a wealth of data for statistical evaluation of the resource and its directionality. The lower cost of system main-tenance compared to offshore buoys ensures more continuous data return. Another example of long-term near-continuous HF radar data return was the deployment of a WERA system in Liverpool Bay from 2004 to 2011 as part of the Liverpool Bay Observatory [18].
III. PLANNED PROJECTS
A. HYD2M
some modifications to existing methods may be required. Fig 4 shows the proposed deployment locations and anticipated coverage for radars operating at 24MHz. Surface currents (Fig 4(a)) can be measured over a much wider range than waves (Fig 4(b)) because they are obtained from the so-called first order part of the radar power (Doppler) spectrum whereas waves are obtained from the much lower amplitude second-order spectrum. It is expected that preliminary results from these radars will be presented. See http://hyd2m.criann.fr/en/ for more information.
(a) surface current
(b) wave
Fig. 4. Planned HYD2M 24MHz HF radar sites and expected coverage. The grey region, seen mostly in outline, is the area of possible tidal stream power extraction
B. Pisces in the Celtic Sea
An area off the coast of S. Wales is being developed as a new wave energy site by Wave Hub. http://www.wavehub.co. uk/pembrokeshire-wave-zone. This is at the northern edge of the region covered by the Pisces radars from 2003 to 2005 [2] and the results from that period have raised interest in the use of this technology for wave measurements for the Wave Hub application. Fig 5 shows the spatial variation in power and direction measured by the radar during February 2004 and 2005 demonstrating year on year differences in the distribution. One of the Pisces radars will be operational later in 2017 as part of a project involving Seaview Sensing Ltd and
Neptune Radar Ltd aimed at increasing the reliability of the HF radar wave measurements by exploiting the fact that different radar frequencies have different responses to wave conditions. Swansea University will be validating the wave data obtained to establish whether they meet the requirements of wave power developers and, if not, what the key requirements are so that further work can be done to meet them.
(a) 2004
(b) 2005
Fig. 5. Polar histogram of February wave power in the Celtic Sea. Circles are at 25%.
IV. CONCLUSION
ACKNOWLEDGMENT
The author would like to thank Neptune Radar and Daniel Conley, University of Plymouth for provision of the Pisces and WERA radar data respectively. The 2003-2005 Pisces operations were funded in part by the UK Met Office. The buoy data were provided by Centre for Environment, Fisheries and Aquaculture Science (CEFAS) who are now also hosting these radar wave measurements on their WaveNet site. The 2017-18 Pisces deployment in the Celtic Sea is co-funded by the UK’s-innovation-agency Innovate UK. HYD2M is funded by the Agence Nationale de la Recherche and France Energies Marines.
REFERENCES
[1] K.-W. Gurgel, H.-H. Essen, and S. Kingsley, “HF radars: physical limitation and recent developments,”Coastal Engineering, vol. 37, pp. 201–218, 1999.
[2] L. R. Wyatt, J. J. Green, A. Middleditch, M. D. Moorhead, J. Howarth, M. Holt, and S. Keogh, “Operational wave, current and wind measure-ments with the Pisces HF radar,”IEEE Journal of Oceanic Engineering, vol. 31, pp. 819–834, 2006.
[3] L. R. Wyatt, J. J. Green, K.-W. Gurgel, J. C. N. Borge, K. Reichert, K. Hessner, H. G¨unther, W. Rosenthal, O. Saetra, and M. Reistad, “Validation and intercomparisons of wave measurements and models during the EuroROSE experiments,”Coastal Engineering, vol. 48, pp. 1–28, 2003.
[4] J. Paduan and L. Washburn, “High Frequency radar observations of ocean surface currents,”Annu. Rev. Mar. Sci., vol. 5, pp. 17.1–17.22, 2013.
[5] D. E. Barrick, “30 years of CMTC and CODAR,” inProc. IEEE OES Ninth Working Conf. Curr. Meas. Technol., Charleston, South Carolina, USA, 2008.
[17] J. Capon, “Multidimensional maximum-likelihood processing of a large aperture seismic array,”Proc. IEEE, vol. 55, pp. 192–211, 1967.
[6] B. J. Lipa and B. Nyden, “Directional wave information from the SeaSonde,”IEEE Journal of Oceanic Engineering, vol. 30, pp. 221– 231, 2006.
[7] L. R. Wyatt, “Wave and tidal power measurement using HF radar,” inProceedings of EWTEC09, Uppsala, Sweden, 7-10 September 2009, 2009.
[8] ——, “Using HF radar to measure the directionality of the wave energy resource:,” inProceedings of EWTEC11, Southampton, UK, 2011, 2011. [9] B. Proenc¸a, D. Conley, and D. Greaves, “Initial evaluation of a WERA HF radar as a resource assessment tool for wave energy,” in4th ICOE Dublin, Ireland, 17-19 Oct 2012, 2012.
[10] L. Wyatt, “The IMOS ocean radar facility, ACORN,” inCoastal Ocean Observing Systems, Jun 2015, pp. 143–158.
[11] S. Fujii, M. Heron, K. Kim, J.-W. Lai, S.-H. Lee, X. Wu, X. Wu, L. Wy-att, and W.-C. Yang, “An overview of developments and applications of oceanographic radar networks in Asia and Oceania countries,”Ocean Science Journal, vol. 48, pp. 69–97, Mar 2013.
[12] A. Rubio, J. Mader, L. Corgnati, C. Mantovani, A. Griffa, A. Novellino, C. Quentin, L. Wyatt, J. Shulz-Stellenfleth, J. Horstmann, P. Lorente, E. Zambianchi, M. Hartnett, C. Fernandes, V. Zervakis, P. Gorringe, A. Melet, and I. Puillat, “HF radar activity in European coastal seas: Next steps toward a pan-European HF radar network,” Frontiers in Marine Science, vol. 4, no. 8, Jan 2017.
[13] B. J. Lipa, “Derivation of directional ocean-wave spectra by inversion of second order radar echoes,”Radio Science, vol. 12, pp. 425–434, 1977. [14] Y. Hisaki, “Nonlinear inversion of the integral equation to estimate ocean wave spectra from hf radar,”Radio Science, vol. 31, pp. 25–39, 1996. [15] N. N. Hashimoto and M. Tokuda, “A bayesian approach for estimating
directional spectra with hf radar,”Coastal Engineering Journal, vol. 41, pp. 137–149, 1999.
[16] L. R. Wyatt, “Limits to the inversion of HF radar backscatter for ocean wave measurement,”Journal of Atmospheric and Oceanic Technology, vol. 17, pp. 1651–1666, 2000.