220
Original Article
Examining Changes Trend of Fluoride Concentration
in Groundwater Using Geo-Statistical Technique Case
Study: Drinking Water wells in Yazd-Ardakan Plain
Razieh Charkhkarzadeh 1, zahra derakhshan2, Mohammad Miri 2, Mohammad Hassan Ehrampoush 2, Mohammad Hasan Lotfi3, Vahid Jafari Nodoshan2
1-Department of environmental engineering, Sciences and Researches Unit, Islamic Azad University, Yazd, Iran 2- Department of Environmental Health Engineering, Faculty of Public Health, Shahid Sadoughi University of
Medical Sciences, Yazd, Iran
3- Department of Epidemiology, Health Faculty, Shahid Sadoughi University of Medical Sciences, Yazd, Iran
Received: 2015/09/29 Accepted: 2015/12/14
Abstract
Introduction: Studies have demonstrated that the presence of standard amount of fluoride in drinking water can prevent tooth decay. Meanwhile, higher concentration than permitted amount in drinking water causes bone disease and dental fluorosis. Given the importance of fluoride in drinking water as well as GIS ability in spatial analysis of various factors in the groundwater, this study aimed to evaluate concentration of fluoride in the plain of Yazd-Ardakan using two IDW (Inverse Distance Weighting) and Kriging models.
Materials and Methods: In this descriptive study, the applied data on the water quality of underground water of Yazd Regional Water Company and the average annual fluoride in 2014 were related to 76 rural wells and 107 urban wells in the studied area. The fluoride rate in groundwater in rural and urban areas was compared to the standard amount of Institute of Standard and Industrial Researches and then was analyzed via Arc GIS software using IDW and Kriging interpolation methods.
Results: The mean concentration of fluoride was 0.68 mg/l in rural areas and 0.7 mg/l in urban areas. With regard to the minimum and maximum concentrations of fluoride as well as standard deviation of 0.364, fluoride concentration fluctuations in rural areas were reported higher than urban areas, For both rural and urban areas, Kriging interpolation method was more efficient than IDW method.
Conclusion: The study findings revealed shortage of fluoride in drinking water and the risk of tooth decay within the residents of southern districts of Yazd-Ardekan which necessary management needs to be taken in regard with these areas. It is worth mentioning that Geo-statistical methods can greatly assist in understanding the environmental issues.
Keywords: Drinking water; Fluoride concentration; Geographic information systems; Interpolation
*
Corresponding author; Tell: +983538209114; Email: [email protected]
221
Introduction
Fluorine is regarded as a halogen being
yellow in its gas form. It is a strong
oxidizing element so that itcan react
explosively with hydrogen gas in cold and
dark conditions [1]. Fluoride can be effective
in preventing tooth decay, that is why it is
added to toothpaste and drinking water [2].
The conducted studies have proved the
effectiveness of this element in prevention
and control of tooth decay [3, 4]. Fluoride
accumulates in bones and teeth of the
growing children that contributes to the
strength of teeth enamel before their
emergence of decay. It also aids with
hardening the teeth enamel within the adults
[5]
. Despite the benefits and the necessity of
its existence in body, exposure to high
concentration of fluorine can be very
dangerous. According to the experiments
conducted on animals in connection with
high exposure to fluoride in drinking water,
the results suggest the possibility of adverse
effects on the nervous system as well as
cumulative toxic symptoms such as dental
and skeletal fluorosis [6, 7]. Furthermore,
drinking over-fluoridated water can be
followed by bone diseases, including bone
pain hypersensitivity in some people.
Epidemiological studies have confirmed
that exposure to excessive fluoride in
drinking water can lead to a decrease in
mental ability and an increase in the
prevalence of dental fluorosis in children
[8-11]
. Therefore, in order to control fluoride
concentration and to match with the
standards, public water supply systems
are required to be monitored based on a
regular schedule. Drinking water can be
obtained through municipal water systems,
private wells, water reservoirs, springs, and
bottled water. The fluoride rate in such
sources might be remarkably different
depending on the source, season, and
treatment level. For instance, an inverse
relationship can be observed between the
concentration of the ion and temperature so
that according to World Health
Organization (WHO) standard, the
maximum acceptable fluoride in drinking
water at 8-12°C is 1.5 mg/l and at 25-30°C
is 0.7 mg/l [12]. The amount of fluorine is
different in the groundwater depending on
the type of soil layers. Its concentration in
groundwater in areas with iron ore,
dolomite, and clay is 0.3-0.4 mg/l, with
alkaline rocks is 7.8 mg/l, with basaltic
rocks is less than 0.1 and with granite rocks
is 9.2 mg/l. Since fluorine concentration in
atmosphere is so low (0.5 mg/l), it can be
negligible compared with the total fluorine
to be absorbed into the body [13].
One proper way to prevent groundwater
contamination is to investigate spatial
variability of groundwater quality as well as
to manage utilization of water resources and
land use [14]. Geographic information
system (GIS) is considered as a technology
or machine that can be used to identify data
(thematic maps), analyze, interpret, and
consequence the data, ecological potential
222
assessment and social-economic
requirements of human for the use of land,
identify environmental changes,
destructives, waste, and pollution, and
above all it can be used for regional
planning or in other words for
environmental planning [15]. Inverse
distance weighting (IDW) is one of the
spatial analysis methods in which the only
effective factor is the distance fort
weighting. Another method used in spatial
analysis is Kriging model. In this
interpolation method which is based on
regression, the weight is not only allocated
to the distance between the surrounding
points, but also is based on the correlation
between the measured points [16, 17].
Several studies have been conducted on the
fluoride amount in drinking water in
different parts of Iran. Noori Sepehr et al.
(2006) investigated the amount of fluorine
in drinking water in villages of Semnan and
reported its range as 0-1.94 mg/l [18]. In
another study conducted in Sistan and
Baluchestan during 2004-2006, fluoride
concentration in some areas was 1.9 mg/l
[19]
. Asghari Moghadam et al. (2006) stated
that the concentration of fluorine in
drinking water was above the world
standards in Bazargan and Poldasht and all
people who were consuming spring water in
that area were suffering from dental
fluorosis and skeletal fluorosis in some
cases [20]. Pour Islami et al. (2007) studied
fluorine concentration in drinking water in
Kerman Province and reported that the
average concentration was 0.38 mg/l [21].,
As it was mentioned above, since fluorine
concentration was regarded important in
drinking water, and the ability of GIS in
spatial analysis of different factors in
groundwater is well established, this study
aimed to investigate the fluorine
concentration in groundwater in the plain of
Yazd-Ardekan using IDW and Kriging
model. Ultimately, an optimal model was
selected concerning zoning fluorine
concentration.
Materials and Methods
The research area involved Yazd province
including north to the south of the Yazd
province at longitude 53.778 to 54.64 and
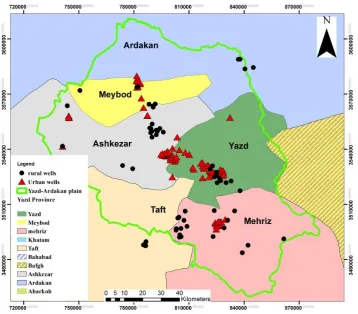
latitude 32.52 to 31.43. As it is depicted in
figure 1, cities of Ardekan, Meibod and
Sadough are located in the northern part of
Yazd province, Taft is in the southwest and
Mehriz is in the south of Yazd province).
Due to its geographical location in the
central plateau of Iran, Yazd province has a
hot and dry desert climate.
223
Figure (1):Geographic scope of the research site
In this discriptive study, the data related to
the quality of underground water of Yazd
Regional Water Company as well as the
average annual fluoride in 2014 (two
sampling period per year) were used.,
which were related to 76 rural wells and
107 urban wells in the studied area. The
fluoride rate of groundwater in rural and
urban areas was measured.
GIS Arc software was used from ESRI
Company in order to spatially analyze the
data concerning the fluoride concentration
in ground water in the plain of
Yazd-Ardekan.
Krigging method, based on the average
moving weighting, is recognized as the best
unbiased estimator, that in addition to the
estimated values, specifies the estimated
error rate in each point.
In the past decade, Kriging has been
introduced as a powerful interpolation
technique used in various disciplines of
earth sciences such as hydrology, soil
science, and mining. Despite all the
advantages of this method, soft changes
during estimation make the variance of the
estimated samples change less than the real
points; i.e. the amount of changes in the
model prediction is less than the reality [22].
In general, the success of this method in
interpolation of variables completely
depends on the accuracy in selecting data
model with toxic variogram experiment. If
the model is not selected accurately, the
224
interpolation result won't be appropriate. In
some cases, the results are not sufficiently
accurate in this model due to some reasons
as inconsistency of spatial structure and
public structure, low accuracy of data and
lack of spatial homogeneity of data.
In this study, ordinary Kriging models have
been applied to investigate concentration
changes of fluorine in groundwater in Yazd
in terms of space and time. Kriging is a
method that makes use of spatial correlation
structure of phenomena in spatial
estimation. In ordinary Kriging method, a
certain range of points can be considered in
interpolation for each destination point. It
should be noted that coordinate is the points
of sample relationship in UTM system. The
general equation is as follows:
Equation (1)
Where Z*(xi) is the estimation grade,
λ
i is the weight or importance of the amountrelated to I sample and z(xi) is the value of
measured variable.
The other zoning method applied in this
study was IDW. IDW for each
measurement point considers a weight
according to the distance between that point
and the position of unknown point. Then
the weights are controlled by the weighting
so as larger powers reduce the effect of
farther points from the point under
estimation and smaller powers distribute the
weights more evenly between adjacent
points. It should be noted that this method
only considers the distance between points
regardless of their position and
arrangement. That is, the points with similar
distance from the estimate point have the
same weight. The weight factor is
calculated using the following equation:
Equation (2)
Where
λ
i is the weight of i station, Di is thedistance of I station from the unknown
point and α is the weighting power.
Model validation was fulfilled using the
following evaluation criteria [23].
Equation (3)
Equation (4)
In these equations n is the number of data,
qi is the measured value and qˆi is the value
predicted by the model. μ is referred to as
the mean of each measured component.
The RMSE (Root Mean Square Error) is
zero in the optimal state or when the
estimated and measured values equal to
zero. The smaller is RMSE, the more
accurate is the prediction of interpolation
model. RMSE is sensitive to outliers,
therefore, RMSE% can be used. Smaller
amount of this feature indicates more
precise estimates that is to say the little
difference between actual and estimated
values [24]. Acceptable limit of RMSE% is
introduced 40% and RMSE% above 70% is
the sign of inaccuracy in estimating points
and large variations between estimated and
measured values.
Results
In the present study, the fluorine
concentration of the groundwater was
investigated in the plain of Ardekan –Yazd.
225
Thus, the sampling results of 76 wells in
rural areas and 107 wells in urban areas
were analyzed. Statistical description
(mean, minimum, maximum, standard
deviation) related to fluorine concentration
in the water of urban and rural wells are
displayed in Table (1).
. In order to compare fluorine concentration
with the standards in the studied area, Iran's
1053 standard for drinking water was
utilized[25]. The standard is displayed in
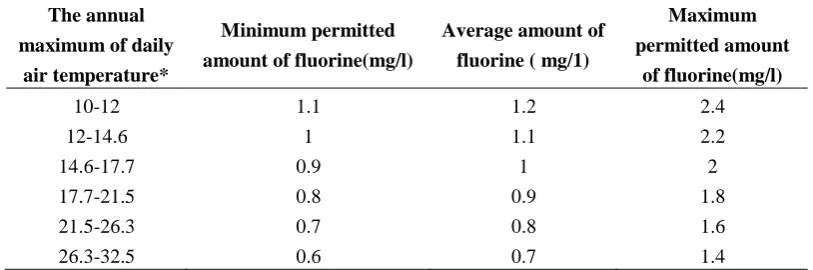
Table (2).
Table (1): Statistical description (mean, minimum, maximum, standard deviation) of fluorine in the water of wells
Type of
well Mean
concentration of
fluorine (mg/l)* Maximum
concentration of
fluorine (mg/l) Minimum
concentration of
fluorine (mg/l) Standard deviation Urban 0.7 1.5 0.16 0.278 Rural 0.68 1.96 0.02 0.364
*confidence interval (CI) 95%
Table (2):Water Standard (1053), minimum and maximum concentrations of fluoride in drinking water
The annual
maximum of daily
air temperature*
Minimum permitted
amount of fluorine(mg/l)
Average amount of
fluorine ( mg/1)
Maximum
permitted amount
of fluorine(mg/l)
10-12 1.1 1.2 2.4
12-14.6 1 1.1 2.2
14.6-17.7 0.9 1 2
17.7-21.5 0.8 0.9 1.8
21.5-26.3 0.7 0.8 1.6
26.3-32.5 0.6 0.7 1.4
* Average temperature is based on the average maximum temperature of the region in five consecutive years.
According to Iran's standard of drinking
water within the studied region as well as
considering weather conditions, fluorine
concentration should range from 0.6 to 1.4.
Table 1-4 demonstrates that the mean
concentration of fluorine in urban and rural
areas was reported in the standard range,
though with regard to the minimum and
maximum concentration presented in some
areas, the fluorine rate was less than the
allowable amount and in some areas fluride
concentration was exceeds. In general, the
total concentration of fluorine in urban
areas is more than that of rural areas.
However, fluctuation in fluorine
concentration in rural areas with regard to
minimum concentration of 0.02, maximum
concentration of 1.96 mg/l and standard
deviation of 0.364 was more than that of
urban areas. The main reason of greater
226
fluctuation in rural areas isprobably related
to more distribution of wells in these areas
as well as more varied texture of soil in
comparison to urban areas. In urban areas,
the fluorine concentration in 38 wells was
lower than the permitted limit (0.6 mg/l),
though the fluorine concentration in 2 wells
exceeded the maximum permitted limit (1.4
mg/l). In rural areas, the fluorine
concentration in 36 wells was lower than
the permitted limit (0.6 mg/l), whereas the
fluorine concentration in 2 wells exceeded
the maximum permitted limit (1.6 mg/l).
To select the optimum conditions for
Kriging model, at first the date was
normalized via Box-Cox model and then all
the models in the software were analyzed.
Ultimately, given the amount of RMSE it
was found that Gaussian model was the best
model for zoning fluorine concentration in
rural areas through Kriging method. In
IDW method, 1, 2, and 3 powers were used
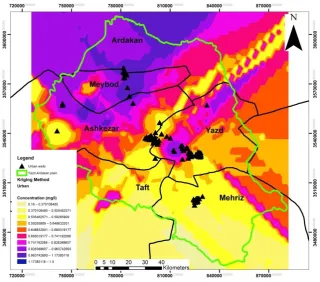
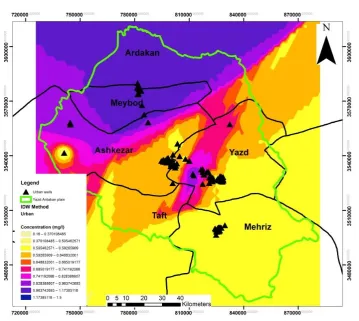
to select the optimum conditions. Figures
2-A and 2-B respectively indicate zoning via
Kriging method and IDW in rural areas and
Figures 3-A and 3-B show zoning in the
urban areas.
Figure 2 (a):Zoning fluorine concentration in rural areas using kriging method
227
Figure 2 (b): Zoning fluoride concentration in rural areas using IDW
Figure 3 (a):Zoning fluorine concentration in urban areas using kriging method
228
Figure 3(b):Zoningfluorine concentration in urban areas using IDW In order to compare Kriging and IDW
methods, RMSE criterion was used which
was equal to 0.378 for Kriging model and
0.447 for IDW in rural areas. In urban
areas, it was equal to 0.266 and 0.294 for
Kriging model and IDW, respectively. In
this way, Kriging model had better
conditions than IDW in regard with zoning
fluorine concentration in both rural and
urban areas. RMSE percentage for rural
areas was 55% and 65% respectively,
which indicated the average performance of
the two models on the fluorine
concentration data in rural areas. This may
be due to outliners in the zoning of rural
areas. In Urban areas, RMSE was equal to
38% for Kriging method and 42% for IDW
method which indicated good conditions of
Kriging method in regard with zoning
fluorine concentration (Table 3).
Table 3:comparing interpolation methods in rural and urban areas
Kind of area Interpolation method RMSE %RMSE
Rural IWD 0.447 65
Kriging 0.378 55
Urban IDW 0.294 42
Kriging 0.266 38
229
In order to show zoning maps better and
more simply in both urban and rural areas,
the maps were classified according to
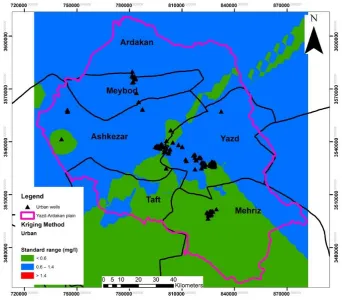
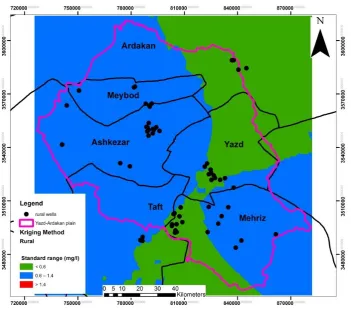
standard rate in Iran as shown in Figures 4
and 5. According to Figure 4, it can be
concluded that the main problem of fluoride
shortage in drinking water is related to
northeastern villages and parallely, to the
southwestern villages of the studied region.
Figure (5) also reportsthat lack of fluoride is
more related to cities in central areas such as
Yazd southeast area.
Figure (4):The classification of fluorine concentration based on the relative standard of rural areas and Kriging method
230
Figure (5):The classification of fluorine concentration based on the relative standard of urban areas and Kriging method
Discussion
In this study, the concentration of fluorine
in the wells in rural and urban areas in
Yazd - Ardekan was studied. Given the
average concentration in 2014, it was
found that concentration fluctuations of
fluoride in various rural areas were more
than those of urban areas. In urban areas,
wells with standard concentration were
more than those of rural areas. According
to the maps of fluorine concentration in
urban and rural areas, it can be concluded
that in urban and rural areas no problem
of fluorine concentration over the
permitted limit (more than 1.4 mg/l) was
observed and therefore there is no
concern regarding diseases such as dental
or skeletal fluorosis.
Since groundwater is largely affected by
the type of terrain textures through which it
passes, it has different mineral components.
If the terrain texture through which
groundwater passes contains feldspar rocks,
the groundwater contains high amount of
fluoride, as well. Otherwise, the majority of
groundwater entails small amount of
fluoride and in order to prevent tooth decay,
it is necessary to develop fluoridation unit
for such water [15, 16].
231
In Iran, there are some areas where fluoride
concentration has exceeded the allowable
limit. Generally, northern and central
provinces have the lowest and southern
provinces have the highest percentage of
fluoride in their water. However, in most
parts of Iran, fluoride deficiency has been
reported via the number of referrals to
dentistry [18, 26].
Among different studies conducted in Iran,
the one conducted by Shams et al. can be
referred, in which the rate of fluoride
drinking in water in Tabas was examined.It
was observed that the fluoride rate in
summer and winter months was equal to
0.71 mg/l and 0.58 mg/l respectively which
was very close to the rate of fluoride in the
present study [27]. In another study, the rate
of fluoride ion in Maroon, Karun, and
Karkhe Rivers was examined.The average
concentration of fluoride ion was detected
to be equal to 0.5 mg/l, which was smaller
than the average rate of fluoride in urban
and rural areas in the present study [28]. In
examining the quality of water in Noor
Abad, Mamasani Plain, the minimum and
maximum rate of fluoride was reported as
0.19 and 1.36 mg/l, respectively [29].
Omrani et al. studied fluoride concentration
in drinking water and its relationship with
decayed missed filled teeth (DMFT) within
the 7-11-year-old students in Shiraz. After
measuring fluoride concentration in the
studied areas, they found that in some areas
with less fluoride concentration than the
standard, the fluoride rate was significantly
different from other areas (the mean
concentration of fluoride in urban drinking
water was measured as 0.69 mg/l) [30].
Conclusion
Examining the quality of groundwater
through GIS-based approaches can greatly
contribute to better understanding of spatial
conditions of each component in
groundwater, which is highly potential in
this regard. As the study findings revealed,
fortunately fluoride concentration above the
standard limit was observed in none of the
areas, though northeastern parts, central,
and southern parts of rural areas as well as
central and southeastern parts of urban
areas in the study are facing shortage of
fluoride in drinking water. In order to
prevent tooth decay and fluoride deficit
problems in drinking water, necessary
management should be done such as adding
fluoride to drinking water, mixing
low-fluoride-concentration water with
high-fluoride-concentration water as well as
teaching people to use fluoride mouthwash
and toothpaste.
References
1. Whitford G.M. Acute and chronic fluoride toxicity. Journal of .Dent Res 1992;71: 1249–54. 2. Environmental Protection Agency. Fluoride: Exposure and Relative Source Contribution Analysis.
Washington D.C, U.S; 2010.
232
3. World Health Organization. Fluorides and oral health. Geneva: WHO. 1994; (WHO Technical Report Series 846).
4. Whitford GM. The Metabolism and Toxicity of Fluoride. 2th Ed. New York: Karger; 1997.
5. Centers for Disease Control and Prevention. Achievements in Public Health, 1900-1999: Fluoridation of Drinking Water to Prevent Dental Caries for Water Fluoridation. MMWR 1999; 48: 933-40.
6. Mullenix PJ, Denbesten PK, Schunior A, et al. Neurotoxicity of sodium fluoride in rats. Neurotoxicol. Teratol 1995;17(2):169–77.
7. Sudhanshu S, Anjali S, Pankaj G .Effect of high fluoride water on intelligence of school children in India. J Neurosci Rural Pract 2012; 3(2): 144–49.
8. Chen YX, Han FL, Zhou ZL, et al. Research on the intellectual development of children in high fluoride areas. Fluoride; 2008; 41(2):120–04.
9. Sun DJ. Surveillance on endemic fluorosis of drinking water type in China a two-year report of 2003 and 2004. Chin Journal of Epidemiology 2007; 26:161–4.
10. Suthar S, Garg VK, Jangir S, et al. Fluoride contamination in drinking water in rural habitations of Northern Rajasthan, India. Environ Monit Assess 2008; 145(1-3):1-6.
11. Gupta RK, Agarwal P, Kumar S, et al. Compressive myelopathy in fluorosis MRI. Neuroradiology. 1996 May;38(4):338-42.
12. APHA, AWWA, WPCF. Standard methods for the examination of water and wastewater 21th Ed. Washington DC, USA: American Public Health Association; 2005; 1168-9.
13. Zandevakili F, Doghashmeh M, Daneshmand Irani K. Investigation of Physico chemical and microbiological quality of mineral waters and packed Iran. The 8th National Congress on Environmental Health, hamedan.2005 (Persian).
14. Ehsani H JA, Hasani A, Shariat M, et al. Evaluation of nitrate variation and Total dissolved solids trend in drinking water using GIS Hamedan plain ground. 10th national Conference on Environmental Health. 2007.
15. Manimaran D. Groundwater Geochemistry Study Using GIS in and Around Vallanadu Hills, Tamilnadu, India ResJRecent Sci. 2012;15:52-8.
16. Cressie N. A. C, Statistics for spatial data; J. Wiley, 1993.
17. Schabenberger O, Gotway C A. Statistical methods for spatial data analysis; CRC Press, 2005. 18. Noori Sepehr M, Arab F, Shahravi M, et al. investigation of fluoride concentrating in Semnan
Village at 2006. Proceedings of the Tenth conference of environmental Health, 12-15 October 2007, Hamadan, Iran: 17-23. (Persian).
19. Nori MA, Bazrafshan E, Hosseini AR, et al. survay the level of fluride in drinking water sources in Sistan & Balochestan province Cities in 2003, 2004, 2005. 11th national Conference on Environmental Health, Zahedan univercity of medical science. 2007:87 (Persian).
20. Asghari moghadam A, Jamiri R, Mohammadi A. The source of high level concentration of fluride in ground water of Bazargan-Poldasht plain and harm effects on citizenry of this regain journal of environmentology. 2007;41:42.
233
21. poreslami HR, Khazaeli P, Masood por H. survay the level of fluride in drinking water sources in Kerman province Cities. journal of Kerman uiversity of medical science. 2008;15(3):238.
22. Xu C. GL, Jiang T, Chen D, et al. Analysis of spatial distribution and temporal trend of reference evapotranspiration and pan evaporation in Changjiang (Yangtze River) catchment. Journal of Hydrology. 2007;327:81-93.
23. Mehrjerdi R ZM, Mahmodi Sh, Heidari A. Spatial distribution of groundwater quality with geostatistics (Case study: Yazd- Ardakan plain). World Applied Science Journal. 2008;4(1):9-17. 24. Hengel T. HGBMaSA. A generic framework for spatial prediction of soil variables based on
regression–kriging. Geoderma. 2004;120:75-93.
25. Institute of Standard and Industrial Researches. Drinking water charachtersitics. 5th ed. 2010. (Persian).
26. Golshani H. investigation of relationship between fluoride concentration in water with dental caries in Esfahan.1996,Tehran, MPSH Thesis. (Persian).
27. Shams M, Mahvi A, Mohammadi A. Investigation of Nitrate and Fluoride concentration in Tabas water supply. Proceedings of the Twelfth conference of environmental Health. 12-15 October 2009. Tehran, Iran: 47-53.(Persian).
28. Basir L, Khaneh Masjedi M, Haghighi M, et al. investigation of relationship between fluorosis and DMFT outbreak with fluoride concentration in Khozestan drinking water in 10-12 old children at 2002. Den. J. Shahid Beheshti Un. Med. Sci. 2006; 24: 14-23.(Persian).
29. Fallah H, Molana Z, Mir Arab Razi M. investigation of fluoride in Ramian drinking water and determination of DMFT in children. Proceedings of the Twelfth conference of environmental Health, 12-15 October 2009, Tehran, Iran: 59-65. (Persian).
30. Emrani M, Dehghani .Detection of DMFT in 7-11 years old student in shiraz. Proceeding of the 12th of environmental health congress. Tehran, Shahid beheshti university, 2009. (Persian).