VOLUME 41, ARTICLE 34, PAGES 1007
-
1020
PUBLISHED 11 OCTOBER 2019
https://www.demographic-research.org/Volumes/Vol41/34/ DOI: 10.4054/DemRes.2019.41.34
Descriptive Finding
Investigating China’s inter-prefecture migration
from a place attractivity perspective, its spatial
patterns, and demographic characteristics
Zhang Yaojun
Yu Danlin
Cen Qiao
© 2019 Zhang Yaojun, Yu Danlin & Cen Qiao.
This open-access work is published under the terms of the Creative Commons Attribution 3.0 Germany (CC BY 3.0 DE), which permits use, reproduction, and distribution in any medium, provided the original author(s) and source are given credit.
1 Introduction 1008
2 Method: Place attractivity and its measurement 1009
3 Results of the RIA calculation 1010
3.1 The spatial pattern of China’s place attractivity 1010
3.2 Place attractivity at different city sizes 1013
3.3. Place attractivity for various population groups 1013 3.3.1 RIA scores for different age groups and their spatial distributions 1013 3.3.2 RIA scores for different educational groups and their spatial
distributions
1015
4 Conclusion 1016
5 Acknowledgements 1017
Investigating China’s inter-prefecture migration from a place
attractivity perspective, its spatial patterns, and demographic
characteristics
Zhang Yaojun1 Yu Danlin2
Cen Qiao3
Abstract
BACKGROUND
Urbanization has been regarded as a strategic process to alleviate rural poverty, support local economic growth, and facilitate national sustainable development in China. Scholars have long realized that urbanization is a comprehensive process that can be understood through studies of population migration among places where population flows occur.
OBJECTIVE
Place attractivity is a concept derived from the place interaction model, which measures the ability for urban areas to attract migrants, hence the “ability” of urbanization. By studying the spatial patterns of China’s place attractivity, the study attempts to depict the current migration and urbanization dynamics in China and support sustainable urbanization strategies in China.
METHODS
The Relative Intrinsic Attractivity (RIA) index provides an excellent quantification strategy to measure place attractivity. With data obtained at the prefecture level from China’s 2005 1% census sampling survey (the most recent of such data), the study calculated RIA for each prefecture units and various population groups.
RESULTS
The results suggest that cities in central China have the lowest place attractivity. There is a diverging trend of China’s place attractivity with a rather unbalanced urban system
1 School of Sociology and Population Studies, Renmin University of China, Beijing, China.
Email:[email protected].
2 (Corresponding Author) School of Sociology and Population Studies, Renmin University of China, Beijing,
China and Department of Earth and Environmental Studies, Montclair State University, Montclair, NJ, USA. Email:[email protected].
development. Cities of different sizes have a different place attractivity, with large cities having the highest attractivity. A city’s attractivity also varies between population groups.
CONTRIBUTIONS
The study suggests from a place attractivity perspective that urbanization in China requires careful coordination and planning. The top priority for China’s urbanization is to devise relevant policies and support rational and sustainable industrial development in small cities and towns to increase their attractivity.
1. Introduction
Maintaining orderly migration in China has been regarded as “a significant strategic choice for realizing China’s modernizations” (Li 2012) and a new engine to boost China’s socioeconomic development in the new century (Fang and Yu 2016). China is now vigorously implementing its new urbanization strategy in the new century (Fang and Yu 2016; Fang and Yu 2017). It is imperative for China to initiate studies to understand how cities attract various migrants (place attractivity) and the spatial distribution of such attractivity (Chen 2011; Li and Zahniser 2002). Understanding the spatial patterns of China’s place attractivity might provide insights into better planning and designing strategies for China’s current urban systems. It might also provide better ways for channeling China’s large number of migrants within the urban system more reasonably and efficiently.
receive the majority of urbanized rural residents in the next few decades (de Jong et al. 2015; Fang and Lin 2009; Fang and Yu 2016; Fang and Wang 2013; Luo and Wei 2009).
2. Method: Place attractivity and its measurement
Urban attractivity refers to how well a location attracts people. A place having higher attractivity is more appealing to migrants usually because of its economic and job opportunity pulling forces as well as better amenities. Traditionally, net in-migration and relevant indices are often used to imply place attractivity (Fotheringham and O’Kelly 1989; Fotheringham et al. 2000). These measures might not reflect a place’s true attractivity because it is possible that some cities receive more in-migrants simply because they are located closer to a population center. Such locational bias are discussed by Fotheringham et al. (2000) in their study of migration in Great Britain. Based on their review of a range of widely used migration attractivity indices, Fotheringham et al. (2000) propose the Relative Intrinsic Attractivity (RIA) index. From a geographic interaction perspective, the RIA index assumes that for any place, all other places have the possibility of sending migrants to it. The possibility, however, decreases as the distance between the two places increases. Following Fotheringham et al. (2000), population migration between two places can be expressed as:
, (1)
whereMijis the number of migrants from originito destinationj;Oi represents the total
number of migrants leaving origini;Aj represents the intrinsic attractivity of destination
j; dijmeasures the spatial interaction between i and j and are often represented by a
function of distance between the two places, or simply the distance itself; β is a distance-decaying parameter representing the influence of spatial separation on migration flows (which needs to be estimated from the model); andεij is an error term representing idiosyncratic features of the flows that are not captured by the model (Fotheringham and O’Kelly 1989). Per Fotheringham et al. (2000)’s discussion, the model presented in Equation 1 essentially describes the allocation of the total population leaving the sources to the destinations based on the destinations’ relative drawing power (the intrinsic attractivity). By manipulating Equation 1, we have:
ln − ∑ ln = +∑ +β ln − ∑ ln + , (2)
j ij ij i ij
where
= ln −(1/ )∑ ln (j = 0, …, n – 1). (3)
The term(1/ )∑ ln is a constant across all the destinations. Dk is a control
dummy variable taking the value of 1 when population flows to destination k, and 0 otherwise. eij is an i.i.d. error term with zero mean. Equation 2 can be calibrated via
least squares to obtain allαjs (one city will be omitted from the calibration. The results are not dependent on which city it omits). With the estimatedαjs, through Equation 3, we will obtain the RIA score of any placej with
RIA0 = exp (α0) (4)
and
RIAj = exp (α0+αj) (5)
Since all the RIA values are relative, for actual measurement, it makes more sense to scale all the RIA values by
RIA (rescaled)j = RIAj / min (RIA), (wherej = 0, …,n – 1). (6)
The current study investigates various spatial patterns of China’s place attractivity. We collected migration data based on the 2005 1% national population survey (Statistics 2005). We are aware that there are newer demographic data sets in China, such as the 2010 decennial census and 2015 1% survey data. Unfortunately, for both newer data sets, the data that is required to calculate the RIA score is not available at the prefecture level.
3. Results of the RIA calculation
3.1 The spatial pattern of China’s place attractivity
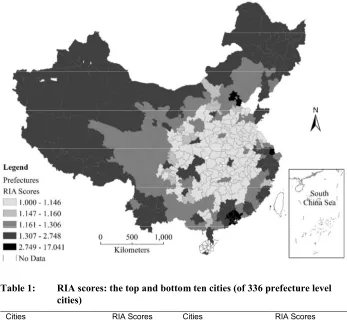
Figure 1: RIA scores in China (2005)
Table 1: RIA scores: the top and bottom ten cities (of 336 prefecture level cities)
Cities RIA Scores Cities RIA Scores
Top ten cities Bottom ten cities
Shenzhen (Guangdong) 17.041 Hebi (Henan) 1.024
Shanghai 16.029 Ezhou (Hubei) 1.023
Beijing 12.377 Xinyang (Henan) 1.023
Guangzhou (Guangdong) 8.457 Huanggang (Hubei) 1.022
Tianjin 7.723 Suizhou (Hubei) 1.021
Dongguan (Guangdong) 5.325 Pingdingshan (Henan) 1.021
Foshan (Guangdong) 4.324 Shangqiu (Henan) 1.012
Huizhou (Guangdong) 3.544 Zhumadian (Henan) 1.007
Zhuhai (Guangdong) 3.318 Luohe (Henan) 1.006
The spatial pattern of China’s place attractivity as depicted in Figure 1 clearly suggests that cities in the East coastal China have high attractivity, while cities with the lowest attractivity concentrate in the central part of China. Previous studies of China’s migration patterns often suggest that population migration in China follows a clear East–Central–West division that the majority of the migrants moves first to East coastal cities, then cities in Central China, and last to cities in West China (Chan and Zhang 1999; Day and Ma 1994; Deng et al. 2015; Fan 2005; Han et al. 2014; Li 2004), which agrees with the spatial distribution of China’s regional economic development and availability of job opportunities (Yu and Wei 2003) – a typical economic pull-push pattern. The RIA measure reveals that though cities in East China indeed are more attractive due to their relatively developed status, the attractivity of cities in Central China is lower than cities in both the East and the West parts of China. Their larger number of in-migrants observed in other studies might mainly be attributed to their proximity to large population centers in East China or Central China. Cities in West China often are socioeconomic and political central locations for their immediate surrounding areas. For instance, many of the capital cities in West China, such as Kunming, Urumqi, and Lhasa are more attractive to their immediate local migrants than more developed, but more distant cities in Central and East China.
3.2 Place attractivity at different city sizes
In China, cities are classified into four categories based on their sizes: mega cities (over 1 million), large cities (0.5–1 million), medium sized cities (200,000–500,000) and small cities (less than 200,000). For megacities, the average RIA score is 2.611; for large cities, the average RIA score is 1.347; and for medium-sized and small cities, the average RIA scores are 1.209 and 1.216. These results suggest that China’s ‘mobile population’ selects the megacities or large cities as their preferred destinations because of almost ‘better everything’ in large and mega cities. Such preference also puts enormous pressure on these cities’ infrastructure and public service systems. Because of such pressure, China’s current urbanization policy aims to control the urbanization rate of mega and large cities but actively promote the capability of medium-sized and small cities’ migrant absorption so that a well-balanced urban system can be maintained for sustainable urban development. The results also suggest that the majority of the medium-sized and small cities have very little difference regarding their migrant attractivity. This is because in 2005, economic development levels and job opportunities in those cities were very similar regardless of locations.
3.3 Place attractivity for various population groups
3.3.1 RIA scores for different age groups and their spatial distributions
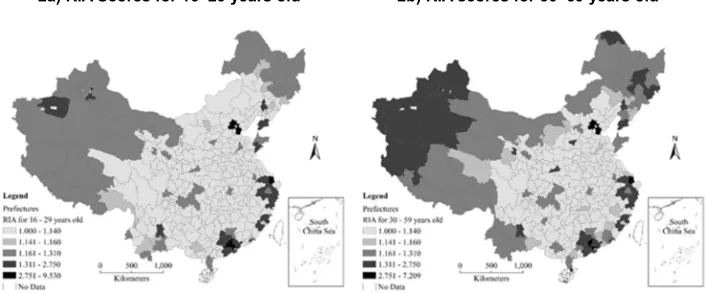
Figure 2: RIA scores for different age groups in China (2005)
2a) RIA Scores for 16–29 years old 2b) RIA scores for 30–59 years old
2c) RIA scores for 60 years and older
abundant there. On the other hand, people in the older working age group concern more about quality of life and stability. They are generally in the stage of family building and are less willing to take higher risks lest they could lose their gradually stable lives. Affordable housing becomes a major concern that often is scarce in megacities. The capital cities of some central, west and northeastern provinces, such as Yunnan, Xinjiang, Liaoning, etc., provide rather balanced locations for this age group. For the retiree group, Figure 2c suggests that except for the megacities that often has “better everything,” all cities are about the same. Existing studies suggest that the primary push-pull factors that move retirees are the quality of public service resources (especially health care resources) and quality of life (Rogers and Frey 1992; Rogers and Watkins 1987; Rogers and Woodward 1988; Warnes and Law 1984). In China, except for megacities, all other cities, at least in 2005, exhibit little difference in terms of quality of public services and quality of life.
3.3.2 RIA scores for different educational groups and their spatial distributions
The RIA scores for the relatively educated individuals (who receive more than the nine-year mandatory school training) and the relatively under-educated individuals (who receive just about the nine-year mandatory school training or even less) are rather different indeed (Figures 3a and 3b).
Figure 3: RIA scores for different education levels China (2005)
3a) RIA Scores for educated population 3b) RIA scores for under-educated population
higher attractivity scores, most other cities remain less attractive. On the other hand, for the relatively under-educated group, their choice of migrating destinations is less restrictive. Still, for this group, only cities that are close to the more developed megacities are more attractive (Figure 3b). The rest remains less attractive. The spatial patterns of RIA scores for both the educated and under-educated groups are like a snapshot of contemporary China’s urban industrial structures and industrial transfer process. The most developed cities have then (2005) completed their industrial upgrade from traditional manufacturing industries to high-end service industries (such as finance, education, high technology, etc.) oriented cities. These cities are in increasing demand of large number of well-trained and well-educated labors, hence are attractive to this group of migrants. On the other hand, the neighboring cities of these more developed ones often are the ones that receive the transferred (upgraded-out) manufacturing and labor-intensive service industries. These cities have a high demand for labor forces but less on educational requirement (Figure 3b).
4. Conclusion
By using the place attractivity measurement, RIA, proposed in Fotheringham et al. (2000), this study investigates China’s place attractivity from various perspectives using prefecture-level migration data. A few interesting results emerge from the practice, which we hope could be used for better urban planning and population policy design in China.
First, contrary to common understanding that place attractivity might follow the economic development gradient that declines from East to West, the RIA score suggests that Central China has the lowest place attractivity. Second, further analysis also suggests that large cities’ place attractivity is stronger than that of medium-sized and small cities. Urbanization strategies and planning will need to address such issues adequately to create a relatively balanced urbanization future in China. Third, a place’s attractivity is different among different age groups and educational levels. These varying patterns provide a more detailed guidance for sustainable and successful population management strategies for China in the new century.
5. Acknowledgements
References
Carbonaro, G., Leanza, E., McCann, P., and Medda, F. (2018). Demographic decline, population aging, and modern financial approaches to urban policy. International Regional Science Review 41(2): 210‒232. doi:10.1177/0160017 616675916.
Chan, K.W. and Zhang, L. (1999). The hukou system and rural-urban migration in China: Processes and changes.The China Quarterly 160: 818‒855.doi:10.1017/ S0305741000001351.
Chen, Y. (2011). Occupational attainment of migrants and local workers: Findings from a survey in Shanghai’s manufacturing sector. Urban Studies 48(1): 3‒21. doi:10.1177/0042098009360685.
Day, L.H. and Ma, X. (1994). Migration and urbanization in China. Armonk, NY: M.E. Sharpe.
de Jong, M., Joss, S., Schraven, D., Zhan, C., and Weijnen, M. (2015). Sustainable-smart-resilient-low carbon-eco-knowledge cities; making sense of a multitude of concepts promoting sustainable urbanization. Journal of Cleaner Production 109: 25‒38.doi:10.1016/j.jclepro.2015.02.004.
Deng, Y., Liu, S.H., Cai, J.M., Lu, X., and Vielsen, C.P. (2015). Spatial pattern and its evolution of Chinese provincial population: Methods and empirical study. Journal of Geographical Sciences 25(12): 1507‒1520. doi:10.1007/s11442-015-1248-x.
Fan, C.C. (2005). Interprovincial migration, population redistribution, and regional development in China: 1990 and 2000 census comparisons. The Professional Geographer 57(2): 295‒311.doi:10.1111/j.0033-0124.2005.00479.x.
Fang, C. and Lin, X.Q. (2009). The eco-environmental guarantee for China’s urbanization process. Journal of Geographical Sciences 19(1): 95‒106. doi:10.1007/s11442-009-0095-z.
Fang, C. and Yu, D. (2016). China’s new urbanization: Developmental paths, blueprints and patterns. Beijing: Science Press/Springer. doi:10.1007/978-3-662-49448-6.
Fang, C.L. and Wang, J. (2013). A theoretical analysis of interactive coercing effects between urbanization and eco-environment. Chinese Geographical Science 23(2): 147‒162.doi:10.1007/s11769-013-0602-2.
Fotheringham, A.S., Champion, T., Wymer, C., and Coombes, M. (2000). Measuring destination attractivity: A migration example. International Journal of Population Geography 6(6): 391‒421. doi:10.1002/1099-1220(200011/12)6:6< 391::AID-IJPG200>3.0.CO;2-5.
Fotheringham, A.S. and O’Kelly, M.E. (1989). Spatial interaction models: Formulations and applications. Dordrecht: Kluwer Academic Publishers. Han, B.L., Wang, R.S., Tao, Y., and Gao, H. (2014). Urban population agglomeration
in view of complex ecological niche: A case study on Chinese prefecture cities. Ecological Indicators 47: 128‒136.doi:10.1016/j.ecolind.2014.08.002.
Li, H.Z. and Zahniser, S. (2002). The determinants of temporary rural-to-urban migration in China.Urban Studies 398(12): 2219‒2235.doi:10.1080/00420980 22000033836.
Li, K. (2012). Coordinating the promotion of urbanization is a major strategic choice to realize modernization. Administrative Reform 11: 4‒10. doi:10.14150/j.cnki. 1674-7453.2012.11.001.
Li, Sm. (2004). Population migration and urbanization in China: A comparative analysis of the 1990 population census and the 1995 national one percent sample population survey.International Migration Review 38(2): 655‒685.doi:10.1111/ j.1747-7379.2004.tb00212.x.
Luo, J. and Wei, Y.H.D. (2009). Modeling spatial variations of urban growth patterns in Chinese cities: The case of Nanjing.Landscape and Urban Planning 91(2): 51‒ 64.doi:10.1016/j.landurbplan.2008.11.010.
Ma, S., Zhou, X.D., Jiang, M.M., Li, Q., Gao, C., Cao, W., and Li, L. (2018). Comparison of access to health services among urban-to-urban and rural-to-urban older migrants, and rural-to-urban and rural older permanent residents in Zhejiang Province, China: A cross-sectional survey. BMC Geriatrics 18(1): 10. doi:10.1186/s12877-018-0866-4.
Rogers, A. and Watkins, J. (1987). General versus elderly interstate migration and population redistribution in the United States.Research on Aging 9(4): 483‒529. doi:10.1177/0164027587094002.
Rogers, A. and Woodward, J. (1988). The sources of regional elderly population growth: Migration and aging-in-place.The Professional Geographer 40(4): 450‒ 459.doi:10.1111/j.0033-0124.1988.00450.x.
Statistics NBo (2005).2005 1% Sample Survey Data in China.
Warnes, A. and Law, C. (1984). The elderly population of Great Britain: Locational trends and policy implications. Transactions of the Institute of British Geographers9(1): 37‒59.doi:10.2307/621866.
Wei, Y.H.D. (2004). Trajectories of ownership transformation in China: Implications for uneven regional development. Eurasian Geography and Economics 45(2): 90‒113.doi:10.2747/1538-7216.45.2.90.
Wei, Y.H.D. (2007). Regional development in China: Transitional institutions, embedded globalization, and hybrid economies. Eurasian Geography and Economics 48(1): 16‒36.doi:10.2747/1538-7216.48.1.16.
Yu, D.L. (2006). Spatially varying development mechanisms in the Greater Beijing Area: A geographically weighted regression investigation. Annals of Regional Science 40(1): 173‒190.doi:10.1007/s00168-005-0038-2.