https://doi.org/10.5194/gi-6-537-2017
© Author(s) 2017. This work is distributed under the Creative Commons Attribution 4.0 License.
Application of unsupervised pattern recognition approaches
for exploration of rare earth elements in Se-Chahun
iron ore, central Iran
Mohammadali Sarparandeh and Ardeshir Hezarkhani
Department of Mining and Metallurgical Engineering, Amirkabir University of Technology, Tehran, 9821, Iran Correspondence:Ardeshir Hezarkhani ([email protected])
Received: 16 June 2017 – Discussion started: 11 August 2017
Revised: 28 October 2017 – Accepted: 9 November 2017 – Published: 15 December 2017
Abstract. The use of efficient methods for data processing has always been of interest to researchers in the field of earth sciences. Pattern recognition techniques are appropri-ate methods for high-dimensional data such as geochemi-cal data. Evaluation of the geochemigeochemi-cal distribution of rare earth elements (REEs) requires the use of such methods. In particular, the multivariate nature of REE data makes them a good target for numerical analysis. The main subject of this paper is application of unsupervised pattern recogni-tion approaches in evaluating geochemical distriburecogni-tion of REEs in the Kiruna type magnetite–apatite deposit of Se-Chahun. For this purpose, 42 bulk lithology samples were collected from the Se-Chahun iron ore deposit. In this study, 14 rare earth elements were measured with inductively cou-pled plasma mass spectrometry (ICP-MS). Pattern recogni-tion makes it possible to evaluate the relarecogni-tions between the samples based on all these 14 features, simultaneously. In addition to providing easy solutions, discovery of the hid-den information and relations of data samples is the advan-tage of these methods. Therefore, four clustering methods (unsupervised pattern recognition) – including a modified basic sequential algorithmic scheme (MBSAS), hierarchi-cal (agglomerative) clustering,k-means clustering and self-organizing map (SOM) – were applied and results were eval-uated using the silhouette criterion. Samples were clustered in four types. Finally, the results of this study were validated with geological facts and analysis results from, for exam-ple, scanning electron microscopy (SEM), X-ray diffraction (XRD), ICP-MS and optical mineralogy. The results of the k-means clustering and SOM methods have the best matches with reality, with experimental studies of samples and with field surveys. Since only the rare earth elements are used in
this division, a good agreement of the results with lithology is considerable. It is concluded that the combination of the pro-posed methods and geological studies leads to finding some hidden information, and this approach has the best results compared to using only one of them.
1 Introduction
devel-538 M. Sarparandeh and A. Hezarkhani: Unsupervised pattern recognition of REEs in Se-Chahun deposit
oped semi-hierarchical correspondence cluster analysis and showed its application for division of geological units with the help of geochemical data that are systematically collected from an area around Tahe in Heilongjiang Province, north China. Meshkani et al. (2011) used hierarchical andk-means clustering for identifying distribution of lead and zinc in the Sanandaj–Sirjan metallogenic zone in Iran. Ziaii et al. (2009) introduced the neuro-fuzzy method for separating anomalies and showed that this method is more efficient than using multivariate statistics. Ellefsen and Smith (2016) evaluated a clustering method called the Bayesian finite mixture mod-eling procedure by applying it to geochemical data collected in the State of Colorado, United States of America.
The proposed method of the self-organizing maps (SOMs) is likely to become a complementary or an alternative tool to the clustering methods (Kalteh et al., 2008; Iseri et al., 2009). The SOM method is related to adaptivek-means method but performs a topological feature map that is more complex than just cluster analysis. After training, the input vectors are spa-tially ordered in the array; i.e., the neighboring input vec-tors on the map are more similar than the more remote ones (Du and Swamy, 2006). The self-organizing map approach is based on unsupervised learning algorithms and has excel-lent visualization capabilities including techniques that ap-ply the reference vectors of the SOM to give an informative picture of the data (Lu et al., 2003). Sun et al. (2009) applied the SOM method to classify Pb–Zn–Mo–Ag anomalies in the mining area around Sheduolong in Qinghai Province, China. In 2012, Abedi et al. the used the SOM and fuzzyk-means techniques to provide a deposit exploration map for the Now Chun copper deposit in Iran. Sarparandeh and Hezarkhani (2016) examined the application of SOMs in evaluation of the geochemical distribution of REEs in the Choghart Fe– REE deposit in Bafq district and showed its good perfor-mance. Generally, in cases where there are too many param-eters and samples, pattern recognition is a suitable approach for data processing. Exploration of rare earth elements is one of these cases because of the multi-elemental nature of the data. For instance, in this study, 14 rare earth elements were measured with inductively coupled plasma mass spectrome-try (ICP-MS). Pattern recognition makes it possible to eval-uate the relations between the samples based on all these 14 features simultaneously. In addition to providing easy solu-tions, discovery of the hidden information and relations of data samples is the advantage of these methods. This paper suggests a new approach for exploration of REEs, which is more applicable and compatible with the multivariate nature of them.
2 Geological settings of study area
There are several deposits of iron ore in central and north-eastern Iran, and magnetite is the main mineral in most of them. In most iron ore deposits of Iran, metasomatism is
the main cause of concentration (NISCO, 1975). Systematic exploration work during the 1960s and 1970s outlined 34 zones of aeromagnetic anomalies between Bafq in the south and Saghand in the north with a total reserve of more than 1500 Mt iron ore (Torab, 2008). The Se-Chahun deposit is composed of two major groups of ore bodies, called the X and XI anomalies (NISCO, 1975). Anomaly X crops out as some small black hills containing 11 Mt iron ore reserve with mainly rich magnetite ore (Torab, 2008). Anomaly XI occurs 3 km northeast of anomaly X. Each anomaly consists of two or three smaller tabular to lens-shaped ore bodies in asso-ciation with other small bodies (Bonyadi et al., 2011). The mineralization is mainly hosted by metasomatized tuffs of andesite composition. A geological map of the Se-Chahun deposit (anomaly X) and the location of samples within the study area are shown in Fig. 1.
3 Mineralogy and lithology
Figure 1.Geological map of Se-Chahun deposit (anomaly X) and sample locations. Contours of open pits are shown on the map, and the open pits are numbered from 1 to 4 (supplementary part of pit 2 is known as pit 4) (modified after NISCO, 1975).
540 M. Sarparandeh and A. Hezarkhani: Unsupervised pattern recognition of REEs in Se-Chahun deposit
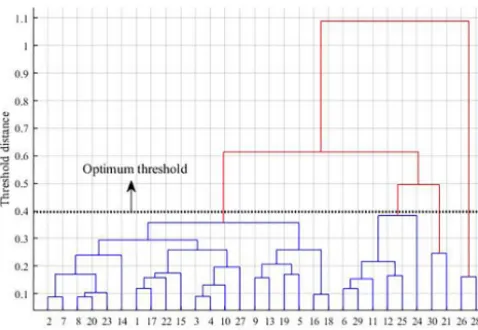
Figure 3. Dendrogram for identifying the optimum threshold and number of clusters.
by clustering methods. This was confirmed by evaluation of samples under SEM. After a complete survey of samples un-der SEM, it was found that the samples of this cluster (e.g., Fig. 7b) contain monazite with an absence of apatite.
4 Scanning electron microscopy
Several samples were analyzed with SEM, and the results were used for evaluation of mineralogy and also validity of this study. Figure 2 shows the BSE images of a sample from phosphate rocks. Monazites are brightly colored and include Ce, La and Nd. Apatites are dark gray and include P, Ca and La but no Ce. As can be seen in Fig. 2, there are small amounts of monazite. Monazites can be seen in two ways: (1) small crystals around the apatite and (2) inclusions in ap-atite crystals (Fig. 2a).
5 Chemical analysis
In this study, 42 bulk lithology samples were collected from anomaly X of Se-Chahun iron ore deposits. They are from pit 1, 2 and 4 (supplementary part of pit 2 is known as pit 4, Fig. 1). 19 samples were taken from pit 1, 9 samples from pit 2 and 14 samples from pit 4. Samples were taken from the ore body and metasomatic zones. After preparation of the sam-ples, they were analyzed with ICP-MS. The concentrations of REEs were normalized between 0 and 1 and were used as input data for clustering. These data can be divided roughly into three groups: samples with high, medium and low con-centration of REEs. Accurate determination of groups re-quires multivariate analysis and data processing. Another im-portant point is that the samples are enriched by LREEs and Y. Large amounts of REEs occur in phosphorus iron ores, and they are more in the supplementary part of pit 2 (or pit 4). Assayed REEs are 14 elements: La, Ce, Pr, Nd, Sm, Eu,
Gd, Tb, Dy, Er, Tm, Yb, Lu and Y. Mean, variance, minimum and maximum of these rare earth elements are presented in Table 1.
6 Methodology
Four methods – a modified basic sequential algorithmic scheme (MBSAS), hierarchical (agglomerative) clustering, k-means clustering and SOM – were applied in this study. These methods have been applied in diverse aspects of sci-ence and engineering, somewhat in geochemistry and never for exploration of REEs. The papers of Sarparandeh and Hezarkhani (2016) and Zaremotlagh and Hezarkhani (2016) are the only efforts which have been made in this area. How-ever, there is no study that applies and compares several types of algorithms. In this study, in addition to providing such use-ful information and experience, the authors show that some extra information such as the relation between REEs content and lithology of samples can be achieved by the proposed methods. Moreover, a good discrimination based on lithol-ogy is attained just by using REEs. The general concepts of each method are explained in the following.
6.1 Sequential clustering
Sequential methods are easy and fast algorithms. These in-clude a basic sequential algorithmic scheme (BSAS) as well as a modifed version (MBSAS). In BSAS two parameters should be defined by the user: the maximum number of clus-ters and dissimilarity threshold. The basic idea behind BSAS is that each input vectorx is assigned to an already created cluster or a new one is formed. Therefore, a decision for vec-torxis reached prior to the final cluster formation, which is determined after all vectors have been presented. The refine-ment of BSAS, which is called modified BSAS (MBSAS), overcomes this drawback. The algorithmic scheme consists of two phases. The first phase involves the determination of the clusters, via the assignment of some of the vectors of xto them. During the second phase, the unassigned vectors are presented for a second time to the algorithm and are as-signed to the appropriate cluster (Theodoridis and Koutroum-bos, 2003). Therefore, in this study the MBSAS algorithm was applied for clustering of samples based on REEs. In this study, the mean of each group and the Euclidean distance were used as the cluster centers and a measure of dissimilar-ity, respectively.
6.2 Hierarchical clustering
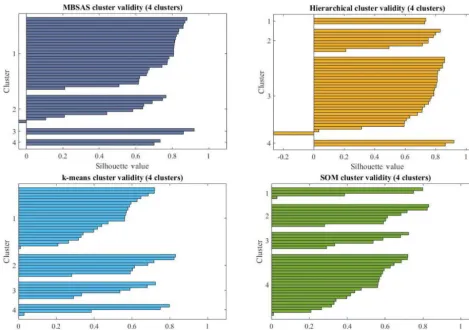
Figure 4.Silhouette plots for each method show the validity of each sample in a certain cluster. Positive values show that the sample has been clustered in the correct group and its magnitude is a measure of accuracy.
Table 1.Mean, variance, minimum and maximum of 14 assayed rare earth elements in 42 samples.
Elements (ppm) La Ce Pr Nd Sm Eu Gd Tb Dy Er Tm Yb Lu Y
Mean 73 154 20 75 13 2 13 2 12 7 1 13 1 56
Variance 27 180 111 800 1202 15 180 299 3 242 4 121 40 1 64 0 2869
Minimum 3 2 0 5 1 0 1 0 1 1 0 1 0 9
Maximum 995 2037 203 740 102 9 90 12 60 32 4 42 3 305
There are several different algorithms for finding a hierarchi-cal tree. An agglomerative algorithm begins with n subclus-ters, each containing a single data point, and at each stage merges the two most similar groups to form a new cluster, thus reducing the number of clusters by one. The algorithm proceeds until all the data fall within a single cluster. A divi-sive algorithm operates by succesdivi-sively splitting groups, be-ginning with a single group and continuing until there are n groups, each of a single individual. Generally, divisive algo-rithms are computationally inefficient, except where most of the variables are binary attribute variables (Webb, 2002). In this study, an agglomerative approach was used.
6.3 K-means clustering
542 M. Sarparandeh and A. Hezarkhani: Unsupervised pattern recognition of REEs in Se-Chahun deposit
Figure 5.SOM topology and determining the number of samples for each cluster(a), SOM neighbor weight distances and neighbor connec-tions(b).
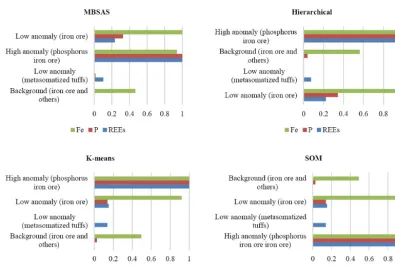
Figure 6.Comparative bar charts of normalized values of REE, P and Fe for all clustering methods.
6.4 Self-organizing map
An SOM is a kind of artificial neural network (ANN). It can be used for unsupervised clustering. This method was intro-duced by Kohonen in 1980, and their main application is to reduce the dimensional (Kohonen, 1998). In this method, topological structure of the input space will be saved. The net of neurons can be a right angle or hexagonal grid, and the adjacent cells upgrade during successive stages (Engel-brecht, 2002).
6.5 Cluster validity
The optimum number of clusters was found by the silhouette method. In this method, a graphical validation was used for evaluating the number of clusters and comparing different
scenarios. Therefore, by calculating the distances between samples in the clusters and distances between the prototypes the optimal number was determined (Rousseeuw, 1987).
7 Results and discussion
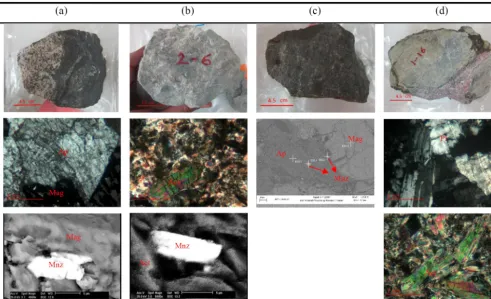
Figure 7.Some examples for samples which have been classified in four types along with their microscopic images.(a)Type 1: high anomaly (phosphorus iron ore), sample 4–1, iron ore sample including apatite and monazite;(b)type 2: low anomaly (metasomatized tuffs), sample 2–6, including actinolite, calcite, feldspar and monazite;(c)type 3, low anomaly (iron ore), sample 4–6, iron ore sample including apatite (mostly depleted from REEs) and monazite;(d)type 4: background (iron ore and others), sample 1–16, metasomatite including plagioclase, feldspar and actinolite. Abbreviations: Ap – apatite; Mnz – monazite; Act – actinolite; Mag – magnetite; and Pl – plagioclase.
The input of the methods is a dataset of 42 vectors with 14 dimensions (42 samples and 14 rare earth elements). First, outliers should be put aside. For this purpose, the dendro-gram based on the average of each cluster and Euclidean dis-tance between the clusters was composed. Linkage analysis showed that two samples have more distance from others and can be put aside as outliers. They are phosphorous iron ore with high concentrations of REEs. Contents of REEs in these two samples are much higher than in others. They belonged to certain clusters (due to the similarity) at the end of calcu-lations.
In MBSAS and hierarchical methods, two parameters (i.e., optimum threshold and number of clusters) should be identi-fied. To this end, the dendrogram was drawn. Figure 3 shows the dendrogram for identifying the optimum threshold and number of clusters. It has been calculated based on the aver-age of each cluster and Euclidean distance between the clus-ters. The optimum threshold was identified as 0.4 based on the endrogram (Fig. 3). In this way, four clusters were ob-tained. However, for all four methods, the number of clusters was changed in the range of 2–6, and then results were eval-uated using the silhouette criterion. Finally, four clusters was
decided upon as the optimal number. In this case the best re-sults of silhouette values were attained for all methods. Sil-houette plots for each method show the validity of each sam-ple in a certain cluster. Positive values show that the samsam-ple has been clustered in the correct group and its magnitude is a measure of accuracy. Results of the silhouette method are shown in Fig. 4. As can be seen in Fig. 4, one sample in the MBSAS and hierarchical methods has a negative value. This means that this sample is in the wrong cluster. Comparing the results of the methods shows that the MBSAS and hier-archical methods had the same outputs, and so thek-means and SOM methods have similar outputs. Moreover, results of thek-means and SOM methods have the best matches with reality, with experimental studies of samples and with field surveys.
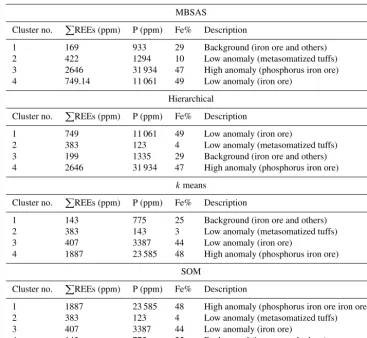
Characteristics of each cluster in each method are summa-rized in Table 2. For this purpose, averages ofP
(metasom-544 M. Sarparandeh and A. Hezarkhani: Unsupervised pattern recognition of REEs in Se-Chahun deposit
Table 2.Characteristics of each cluster in each method. Iron and phosphorus concentrations are shown for comparison.
MBSAS
Cluster no. P
REEs (ppm) P (ppm) Fe% Description
1 169 933 29 Background (iron ore and others)
2 422 1294 10 Low anomaly (metasomatized tuffs)
3 2646 31 934 47 High anomaly (phosphorus iron ore)
4 749.14 11 061 49 Low anomaly (iron ore)
Hierarchical
Cluster no. P
REEs (ppm) P (ppm) Fe% Description
1 749 11 061 49 Low anomaly (iron ore)
2 383 123 4 Low anomaly (metasomatized tuffs)
3 199 1335 29 Background (iron ore and others)
4 2646 31 934 47 High anomaly (phosphorus iron ore)
kmeans
Cluster no. P
REEs (ppm) P (ppm) Fe% Description
1 143 775 25 Background (iron ore and others)
2 383 143 3 Low anomaly (metasomatized tuffs)
3 407 3387 44 Low anomaly (iron ore)
4 1887 23 585 48 High anomaly (phosphorus iron ore)
SOM
Cluster no. P
REEs (ppm) P (ppm) Fe% Description
1 1887 23 585 48 High anomaly (phosphorus iron ore iron ore)
2 383 123 4 Low anomaly (metasomatized tuffs)
3 407 3387 44 Low anomaly (iron ore)
4 143 775 25 Background (iron ore and others)
Table 3.Concentrations of REEs (ppm), P (ppm) and Fe (%) for the samples of Fig. 7.
Element La Ce Pr Nd Sm Eu Gd Tb Dy Er Tm Yb Lu Y P Fe
4–1 330 644 72.16 233 33.93 3.38 31.9 4.3 23.88 13.07 1.53 25.9 1.06 125.1 16 201 51.59 2–6 109 309 64.5 260.3 48.41 5.02 45.49 7.57 43.2 28.51 3.82 26.3 2.77 168.8 168 2.8869 4–6 93 183 21.42 69.4 10.49 1.14 9.9 1.41 8.85 4.91 0.62 16.8 0.43 42.1 3396 52.88 1–16 15 50 6.76 28.4 6.62 1.02 6.64 1.11 7.67 4.79 0.64 6.9 0.59 38.4 127 3.79
atized tuffs), (3) low anomaly (iron ore), and (4) background (iron ore and others). Since only the rare earth elements are used in this division, a good agreement of the results with lithology is considerable. Type 1 is comprised of iron ore with a high anomaly of REEs (about 1900 ppm) and the high content of phosphorus (more than 2 %). Figure 2 shows SEM images of a sample from type 1. This type is the most prone to rare earth elements and containing apatite and monazite. However, fluorapatite is the main mineral of REEs in this type (due to the X-ray diffraction (XRD) and SEM analy-ses). The second type (i.e., metasomatized tuffs) has a low anomaly of REEs, whereas the concentration of P is low. Samples of this group are metasomatized tuffs of andesite composition and mainly consist of actinolite and plagioclase
with low concentrations of Fe and P, but the contents of REEs are considerable (on average about 400 ppm). SEM analysis shows that monazite is the mineral of REEs and apatite does not exist in this type. The third type shows a low anomaly of REEs with the lithology of the ore body and relatively high content of P (about 3400 ppm in SOM andk-means results and about 1 % in MBSAS and hierarchical clustering). The last type is background (low concentrations of REEs) and comprised of various samples of iron ore and others (mainly metasomatic samples).
present a two-dimensional map (for visual evaluation of clus-ters) from multidimensional data. In addition, the weight dis-tance matrix provides a tool to compare clusters. These ad-vantages of the SOM method make it more applicable for data processing in exploration works. Figure 5a shows the SOM topology which has been used in this study as well as the number of samples for each cluster. Since a SOM has a two-dimensional topology, the relations between centers of 14-dimensional clusters have been illustrated on a two-dimensional map. Weight distance matrix or unified distance matrix (U matrix) is one of the SOM’s tools. Figure 5b shows neighbor weight distances. Lines are used to display the rela-tionship between neighboring neurons. The darker the color, the greater the distance between the neurons; the lighter the color, the smaller the distance between the neurons. There-fore, as can be seen in Fig. 5b, type 1 (i.e., high anomaly or phosphorus iron ore) has the maximum distance with type 3 and to a lesser degree with type 2. Also, type 3 and 4 are closest together and most similar to each other in terms of REEs. Finally, type 1 or phosphorus iron ore type is the most promising type for rare earth elements. This type oc-curs mainly in the supplementary part of pit 2 (or pit 4). For a better comparison of the four methods, the outputs of clus-tering algorithms (Table 2) were normalized, and the results were summarized in four bar charts (Fig. 6).
In this study, pattern recognition helped to divide the sam-ples into appropriate groups, according to the contents of REEs, and results are consistent with the concentration of P and with the lithology of the samples. The variety of parame-ters, especially in case of REE explorations, somewhat com-plicates for interpretation of the data and exploration area. Since single-variable methods do not provide useful infor-mation, the authors proposed four common clustering algo-rithms, which have been explained above. The output of these four methods (Fig. 6 and Table 2) shows that the discrimi-nation of clusters is based on the lithology of the samples, in addition to the REEs. Therefore, it is proven that pro-posed methods have found the relation between the distri-bution of REEs and the lithology of the study area. In this regard, we claim that pattern recognition helps to find some hidden information associated with the complicated nature of REE systems. Figure 7 is prepared to show the application and efficiency of unsupervised methods in evaluating geo-chemical distribution of REEs in the Kiruna type magnetite– apatite deposit of Se-Chahun, while it does not need to do additional geological studies with extra cost and time. These samples are shown as the representative samples for each cluster. Their contents of REEs are presented in Table 3. Sample 4–1 (phosphorus iron ore, Fig. 7a) contains about 9 % apatite (based on XRD analysis). There are high con-tents of REEs (P
REEs=1543 ppm) and P (16 201 ppm) in this sample. Figure 7b is an example (sample no. 2–6) for type 2 (low anomaly, metasomatized tuffs). Rare earth ele-ments of this type are from monazite. Apatite was not ob-served in this type, and therefore the concentration of P is
relatively lower. BSE image of a monazite in sample 2–6 is shown in Fig. 7b. Figure 7c is a sample (4–6) for iron ore with a low anomaly of REEs. Apatites of this sample are mainly depleted from REEs. They were observed under SEM (depleted apatites are darker in BSE images). Therefore, al-though there are large amounts of P in it, the concentrations of REEs are relatively lower (Table 3). A metasomatite sam-ple (nos. 1–16) is shown in Fig. 7d as an examsam-ple for back-ground. Plagioclase and actinolite are the main minerals of it. Concentrations ofP
REEs and P in this sample are 175 and 127 ppm, respectively.
Four methods – MBSAS, hierarchical (agglomerative) clustering,k-means clustering and SOM – were applied in this study. However, thek-means clustering and SOM meth-ods are more advanced in comparison to others. They im-prove and modify the weights or centers of the clusters con-tinuously in several stages. In contrast, the MBSAS and hi-erarchical methods are more simple and elementary, because the centers of clusters are determined in one stage. Further-more, SOM has the advantage that the distances between the clusters can be assessed visually on a two-dimensional map (Fig. 5b). Since the input dataset is comprised of 14-dimensional vectors (14 REEs), SOM is a good tool for eval-uating it in a two-dimensional space.
8 Conclusions
The following points were concluded:
– Successful clustering of a dataset which is consistent with geological facts and laboratory and field studies was achieved.
– The results of thek-means clustering and SOM methods have the best matches with reality, with experimental studies of samples and with field surveys.
– Since only the rare earth elements were used in this di-vision, a good agreement of the results with lithology is considerable.
– Results showed that the unsupervised pattern recog-nition helps to find some hidden informations, which would be difficult to achieve in usual ways (i.e., find-ing the appropriate clusters). Methods which have been presented in this study will help better interpretation of data, despite there being many variables.
– A combination of numerical models and geological studies leads to the best outputs and outcomes in ex-ploration programs of REEs.
546 M. Sarparandeh and A. Hezarkhani: Unsupervised pattern recognition of REEs in Se-Chahun deposit
Data availability. Data can be obtained on request from the au-thors.
Competing interests. The authors declare that they have no conflict of interest.
Acknowledgements. We thank the Iranian Mines and Mining Industries Development and Renovation Organization (IMIDRO) for financial support. We also thank the Iran Central Iron Ore Company and the personnel of the mine for their cooperation and contributions regarding mine visitations, sampling and field operations.
Edited by: Luis Vazquez
Reviewed by: Amir Mollajan and one anonymous referee
References
Abedi, M., Norouzi, G. H., and Torabi, S. A.: Clustering of mineral prospectivity area as an unsupervised classification approach to explore copper deposit, Arab. J. Geosci., 10, 3601–3613, 2012. Bonyadi, Z., Davidson, G. J. Mehrabi, B., Meffre, S., and
Ghazban, F.: Significance of apatite REE depletion and mon-azite inclusions in the brecciated Se–Chahun iron oxide apatite deposit, Bafq district, Iran: insights from para-genesis and geo-chemistry, Chem. Geol., 281, 253–269, 2011.
Du, K. L. and Swamy, M. N. S.: Neural Networks in a Softcomput-ing Framework, SprSoftcomput-inger-Verlag, London, 194, 2006.
Ellefsen, K. J. and Smith, D. B.: Manual hierarchical clus-tering of regional geochemical data using a Bayesian finite mixture model, Appl. Geochem., 75, 200–210, https://doi.org/10.1016/j.apgeochem.2016.05.016, 2016. Engelbrecht, A., P.: Computational Intelligence, Wiley, Chichester,
63–73, 2002.
Guler, C., Thyne, G. D., McCray, J. E., and Turner, K. A.: Evalu-ation of graphical and multivariate Statistical methods for clas-sification of water chemistry data, Hydrogeol. J., 10, 455–474, 2002.
Hilario, L. G. and Ivan, M. G.: Self-organizing map and clustering for wastewater treatment monitoring, Eng. Appl. Artif. Intel., 17, 215–225, 2004.
Iseri, E., Matsuura, T., Iizuka, S., Nishiyama, K., and Jinno, K.: Comparison of pattern extraction capability between self-organizing maps and principal component analysis, Memoirs of the Faculty of Engineering, Kyushu University, 69, 37–47, 2009.
Ji, H., Zeng, D., Shi, Y., Wu, Y., and Wu, X.: Semi-hierarchical cor-respondence cluster analysis and regional geochemical pattern recognition, J. Geochem. Explor., 93, 109–119, 2007.
Kalteh, A. M., Hjorth, P., and Berndtsson, R.: Review of the self-organizing map (SOM) approach in water resources: analysis, modeling and application, Environ. Modell. Softw., 23, 835–845, 2008.
Kohonen, T.: The self-organizing map, Neurocomputing, 21, 1–6, 1998.
Lu, H., Wu, Y., and Chen, S.: A new method based on SOM network to generate coarse meshes for overlapping unstructured multigrid algorithm, Appl. Math. Comput., 140, 353–360, 2003
Meshkani, S. A., Mehrabi, B., Yaghubpur, A., and Alghalandis, Y. F.: The application of geochemical pattern recognition to re-gional prospecting: a case study of the sanandaj–sirjan metallo-genic zone, Iran, J. Geochem. Explor., 108, 183–195, 2011. National Iranian Steel Corporation: Report on detailed exploration
of Se-Chahun iron ore deposit in central Iran, National Iranian Steel Corporation (NISCO), Tehran, 1975.
Nguyen, T. T., Kawamura, A., Tong, T. N., Naoko, N., Hideo, A., and Romeo, G.: Clustering spatio–seasonal hydrogeochemical data using self-organizing maps for groundwater quality assess-ment in the Red river delta, Vietnam, J. Hydrol., 522, 661–673, 2015.
Rousseeuw, P. J.: Silhouettes: a graphical aid to the interpretation and validation of cluster analysis, J. Comput. Appl. Math., 20, 53–65, 1987.
Sarparandeh, M. and Hezarkhani, A.: Application of self-organizing map for exploration of REEs’ deposition, Open J. Geol., 6, 571– 582, 2016.
Sun, X., Deng, J., Gong, Q., Wang, Q., Yang, L., and Zhao, Z.: Kohonen neural network and factor analysis based approach to geochemical data pattern recognition, J. Geochem. Explor., 103, 6–16, 2009.
Theodoridis, S. and Koutroumbos, K.: Pattern Recognition, Elsevier Academic Press, San Diego, 2003.
Torab, F.: Geochemistry and metallogeny of magnetite apatite de-posits of the Bafq mining district, Central Iran, Dissertation, Clausthal University of Technology, Germany, 2008.
Webb, A. R.: Statistical Pattern Recognition, John Wiley & Sons Ltd., England, 2002.
Zaremotlagh, S. and Hezarkhani, A.: A geochemical modeling to predict the different concentrations of REE and their hidden pat-terns using several supervised learning methods: choghart iron deposit, Bafq, Iran, J. Geochem. Explor., 165, 35–48, 2016. Ziaii, M., Pouyan, A. A., and Ziaii, M.: Neuro-fuzzy modelling in