Geosci. Instrum. Method. Data Syst., 1, 185–196, 2012 www.geosci-instrum-method-data-syst.net/1/185/2012/ doi:10.5194/gi-1-185-2012
© Author(s) 2012. CC Attribution 3.0 License.
RGB
Geoscientific
InstrumentationMethods and
Data Systems
Discussions
Geoscientific
InstrumentationMethods and
Data Systems
Open
Access
Atmospheric muons: experimental aspects
S. Cecchini1and M. Spurio1,2
1INFN, sezione di Bologna, Viale Berti Pichat 6/2, 40100 Bologna, Italy
2Dipartimento di Fisica dell’Universit`a di Bologna, Viale Berti Pichat 6/2, 40100 Bologna, Italy Correspondence to: M. Spurio ([email protected])
Received: 17 July 2012 – Published in Geosci. Instrum. Method. Data Syst. Discuss.: 20 August 2012 Revised: 17 October 2012 – Accepted: 2 November 2012 – Published: 21 November 2012
Abstract. We present a review of atmospheric muon flux and
energy spectrum measurements over almost six decades of muon momentum. Sea level and underground/water/ice ex-periments are considered. Possible sources of systematic er-rors in the measurements are examined. The characteristics of underground/water muons (muons in bundle, lateral distri-bution, energy spectrum) are discussed. The connection be-tween the atmospheric muon and neutrino measurements are also reported.
1 Introduction
Primary cosmic rays (CRs) are particles accelerated at astro-physical sources continuously bombarding the Earth. When entering the Earth’s atmosphere, primary CRs interact with the air nuclei and produce fluxes of secondary, tertiary (and so on) particles. All these particles together create a cascade, called air shower. As the cascade develops longitudinally the particles are less and less energetic since the energy of the in-coming CR is split and redistributed among more and more participants. The transverse momenta acquired by the secon-daries cause the particles to spread laterally as they propagate in the target. Muons predominantly originate from the decay of secondary charged pions and kaons. The most important decay channels and respective branching ratios are
π± →µ±(−)νµ(∼100 %) (1a)
K±→ µ±(−)νµ(∼63.5 %). (1b) Atmospheric muons are the most abundant charged parti-cles arriving at sea level and the only ones able to penetrate deeply underground. The reason relies on their small energy
loss in the whole atmosphere (∼2 GeV), the relatively long lifetime and the fairly small interaction cross section. Be-cause of the close relation between muon and neutrino duction, the parameters characterizing muon physics can pro-vide important information on atmospheric neutrino flux.
An important parameter to describe the interactions and the subsequent propagation of the particles produced is the atmospheric depthX, measured in g cm−2, defined as the in-tegral in altitude of the atmospheric density above the obser-vation levelh:
X = ∞ Z
h
ρ(h0) d h0 'X0e−h/ h0. (2)
In the last step, an approximation for an isothermal atmo-sphere was used, whereX0= 1030 g cm−2is the atmospheric depth at sea level andh0'8.4 km is the scale height (for mid latitudes) in the atmosphere. Equation (2) is valid for verti-cally incident particles. For zenith angles<60◦, for which the Earth surface can be approximated as flat, the atmo-spheric depth is scaled with 1/cosθ, giving the slant depth. For larger zenith angles, the curvature of the Earth has to be accounted for. The atmospheric profile gives a total horizon-tal atmospheric depth of about 36 000 g cm−2.
The air shower is described by a set of coupled cascade equations with boundary conditions at the top of the atmo-sphere to match the primary spectrum. Using the transport equations, analytic expressions of the cascade can be con-structed. The solutions of these equations allow to compute the differential particle flux anywhere within the atmospheric target. Some approximate analytic solutions are valid in the limit of high energies (Gaisser, 1990, 2002; Lipari, 1993). Numerical or Monte Carlo calculations are needed to account accurately for decay and energy loss processes, and for the
186 S. Cecchini and M. Spurio: Atmospheric muons: experimental aspects
energy-dependences of the cross sections and of the primary spectral index. The nucleon mean free pathλN in the atmo-sphere is given (in g cm−2units) by
λN =
A mp
σNair (3)
whereσNairis the interaction cross section of nucleon in air,
Ais the mean mass number of air nuclei and mp the pro-ton mass. For nucleons in the TeV range,σNair'300 mb. In the context of air shower development, the energy-dependent cross section for an inelastic collision of a nucleon with an air nucleus is assumed to be constant. The atmosphere of the Earth consists mainly of nitrogen and oxygen: the inter-action target for the primary beam is half protons and half neutrons. Assuming an average atmospheric nucleus with
A∼14.5, λN'80 g cm−2. The total vertical atmospheric depth is about 1000 g cm−2and it corresponds to more than 11 interaction lengths.
Most muons are produced through processes (Eqs. 1a and 1b) high in the atmosphere in the first few interaction lengths. The decay mean free path of pionsdπ in units of slant depth, is defined as
1
dπ
= mπc 2h
0
E c τπXcosθ
= π
E Xcosθ (4)
whereE,mπ,τπare the pion energy, mass and lifetime, re-spectively. A similar relation holds for the kaon. Decay or interaction dominates depending on whether 1/dπ or 1/λπ is larger. λπ is defined through Eq. (3) replacing σN with
σπ. At the critical energyE=π=mπc2h0/τπc= 115 GeV the interaction probability in the atmosphere equals the decay probability.
As for the pion, all long-lived unstable particles (Braibant et al., 2012) are subject to competition between interaction and decay as they propagate in the atmosphere. The probabil-ity for either process to occur depends on the lifetime of the particle and is a function of its kinetic energy and on the lo-cal atmospheric density, which is a function of altitude. This interrelationship is responsible for the zenith angle enhance-ment of the bulk of the muons in air showers.
The zenith angle enhancement phenomenon does not af-fect the distribution of muons produced in semileptonic de-cays of charmed mesons, likeD±,D0and others. As the life-time of charmed particles is smaller than∼10−12s (prompt decays), they yield so-called prompt (or direct) muons that are in general highly energetic for kinematic reasons. Since the production cross section of charmed mesons in proton-nucleon interactions is rather small,Ddecays contribute sig-nificantly only at very high energies.
2 Cosmic rays at the sea level
Muons are the dominant component of charged particles at sea level. The integral fluxes of particles arriving at
2 S. Cecchini and M. Spurio: Atmospheric muons:experimental aspects
whereσair
N is the interaction cross section of nucleon in air,
Ais the mean mass number of air nuclei andmp the
pro-ton mass. For nucleons in the TeV range,σair
N '300mb. In
the context of air shower development, the energy-dependent cross section for an inelastic collision of a nucleon with an air nucleus is assumed to be constant. The atmosphere of the Earth consists mainly of nitrogen and oxygen: the inter-action target for the primary beam is half protons and half neutrons. Assuming an average atmospheric nucleus with
A∼14.5, λN'80g cm−2. The total vertical atmospheric
depth is about 1000 g cm−2and it corresponds to more than
11 interaction lengths.
Most muons are produced through processes (Eq. 1a and 1b) high in the atmosphere in the first few interaction lengths. The decay mean free path of pionsdπin units of slant depth, is defined as:
1 dπ
= mπc 2h0
EcτπXcosθ = π
EXcosθ (4)
whereE,mπ,τπare the pion energy, mass and lifetime, re-spectively. A similar relation holds for the kaon. Decay or interaction dominates depending on whether1/dπor1/λπ is larger. λπ is defined through Eq. (3) replacingσNwith
σπ. At the critical energyE=π=mπc2h0/τπc= 115GeV the interaction probability in the atmosphere equals the decay probability.
As for the pion, all long-lived unstable particles (Braibant et al., 2012) are subject to competition between interaction and decay as they propagate in the atmosphere. The prob-ability for either process to occur depends on the lifetime of the particle and is a function of its kinetic energy and on the local atmospheric density, which is a function of altitude. This interrelationship is responsible for the zenith angle en-hancement of the bulk of the muons in air showers.
The zenith angle enhancement phenomenon does not af-fect the distribution of muons produced in semileptonic de-cays of charmed mesons, likeD±,D0and others. As the
life-time of charmed particles is smaller than∼10−12s (prompt decays), they yield so-calledprompt(ordirect) muons that are in general highly energetic for kinematic reasons. Since the production cross section of charmed mesons in proton-nucleon interactions is rather small,Ddecays contribute sig-nificantly only at very high energies.
2 Cosmic rays at the sea level
Muons are the dominant component of charged particles at sea level. The integral fluxes of particles arriving at geomag-netic latitudes∼40◦ vs. their kinetic energy are presented in Fig. 1. Fluxes are averaged over the 11-yr solar cycles. The muon flux withEµ>1GeV through a horizontal area amounts to roughly one particle per cm2 and per minute: Iv(Eµ>1GeV)∼70m−2s−1sr−1(Grieder, 2010).
Fig. 1. Integral fluxes averaged over the 11-yr solar cycle ofµ,e,p
and photons (ph) arriving at geomagnetic latitudes∼40◦ vs. their kinetic energy.
The muon energy spectrum at sea level is a direct con-sequence of the meson source spectrum. Below the few GeV energy range, the muon decay probability cannot be neglected. A muon of 1 GeV has a Lorentz factor γ= Eµ/mµc2∼10and it has a mean decay lengthdµ=γτµc∼ 6km. Since pions are typically produced at altitudes of 15 km and decay relatively fast (forγ= 10the decay length is
dπ∼78m, which is almost the same value ofλπ), the daugh-ter muons do not reach the sea level but rather decay them-selves or get absorbed in the atmosphere.
At higher energies, the situation changes. For pions of 100 GeV (dπ∼5.6km, corresponding to a column density of 160 g cm−2measured from the production altitude) the
in-teraction probability starts to dominate over decay. Pions of these energies will therefore produce further tertiary pions in subsequent interactions, which will also decay eventually into muons, but providing muons of lower energy. There-fore, the muon spectrum at high energies is always steeper compared to the parent pion spectrum.
The muon energy and angular distribution is the effect of a convolution of production spectrum, energy losses in the at-mosphere and decay. The competition of decay and interac-tion plays a crucial role and the relative importance of the two processes depends on energy. The mean energy of muons at the ground is about 4 GeV (Nakamura et al., 2010).
Three different energy regions in the muon spectrum are distinguishable:
– Eµ≤µ, whereµ∼1GeV. In this case, muon decay and muon energy loss are important and must be taken Fig. 1. Integral fluxes averaged over the 11-yr solar cycle ofµ,e,p
and photons (ph) arriving at geomagnetic latitudes∼40◦vs. their kinetic energy.
geomagnetic latitudes∼40◦vs. their kinetic energy are pre-sented in Fig. 1. Fluxes are averaged over the 11-yr solar cycles. The muon flux withEµ>1 GeV through a horizontal area amounts to roughly one particle per cm2and per minute:
Iv(Eµ>1 GeV)∼70 m−2s−1sr−1(Grieder, 2010). The muon energy spectrum at sea level is a direct consequence of the meson source spectrum. Below the few GeV energy range, the muon decay probability can-not be neglected. A muon of 1 GeV has a Lorentz fac-tor γ=Eµ/mµc2∼10 and it has a mean decay length
dµ=γ τµc∼6 km. Since pions are typically produced at al-titudes of 15 km and decay relatively fast (forγ= 10 the de-cay length isdπ∼78 m, which is almost the same value of
λπ), the daughter muons do not reach the sea level but rather decay themselves or get absorbed in the atmosphere.
At higher energies, the situation changes. For pions of 100 GeV (dπ∼5.6 km, corresponding to a column density of 160 g cm−2measured from the production altitude) the in-teraction probability starts to dominate over decay. Pions of these energies will therefore produce further tertiary pions in subsequent interactions, which will also decay eventually into muons, but providing muons of lower energy. Therefore, the muon spectrum at high energies is always steeper com-pared to the parent pion spectrum.
The muon energy and angular distribution is the effect of a convolution of production spectrum, energy losses in the atmosphere and decay. The competition of decay and inter-action plays a crucial role and the relative importance of the two processes depends on energy. The mean energy of muons at the ground is about 4 GeV (Nakamura et al., 2010).
S. Cecchini and M. Spurio: Atmospheric muons: experimental aspects 187
Three different energy regions in the muon spectrum are distinguishable:
– Eµ≤µ, where µ∼1 GeV. In this case, muon decay and muon energy loss are important and must be taken into account. Semi-analytical solutions (as those used in the higher energy range) overestimate the flux. The energy spectrum is almost flat, starting to steepen grad-ually in the same way as the primary spectrum above 10 GeV.
– µ≤Eµ≤π,K, where π= 115 GeV and K= 850 GeV are the critical energies for the vertical directions. Above∼100 GeV, the muon flux has the same power law of the parent mesons, and hence of the primary CRs. Below 100 GeV, the effect of the muon energy loss in the atmosphere it still important, particularly going to-wards the horizontal direction.
– Eµπ,K. The meson production spectrum has the same power law dependence of the primary CRs, but the rate of their decay steepens one power ofEµsince the pion and kaon decay probability is suppressed. The thickness of the atmosphere is not large enough for pi-ons to decay, because of the high Lorentz factor. For
E > π the inclined muon spectrum is flatter than the vertical one and the muon flux is respectively higher. In the intermediate and high energy region (above 100 GeV) and for zenith angleθ <60◦an approximate formula holds: d Nµ Eµ, θ
d Eµd
=A Eµ−γ
1
1+ a E
µ π
cosθ
+ B
1+ b E
µ K
cosθ
(5) where the scale factorA, the power indexγ, the balance fac-torB (which depends on the ratio of muons produced by kaons and pions), and thea,bcoefficients are adjustable pa-rameters. Different best estimates of these parameters were published by several authors. For a review, see Lesparre et al. (2010). Because pions decay more easily in non-vertical showers, a zenith angleθ factor enters in the formula and muons at large angles have a flatter energy spectrum.
Angular distribution at sea level
The muon intensity from horizontal directions at low ener-gies is naturally reduced because of muon decays and absorp-tion effects in the thicker atmosphere at large zenith angles. At high energy the parent particles of muons travel relatively long distances in rare parts of the atmosphere. As a conse-quence, their decay probability is increased compared to the interaction probability.
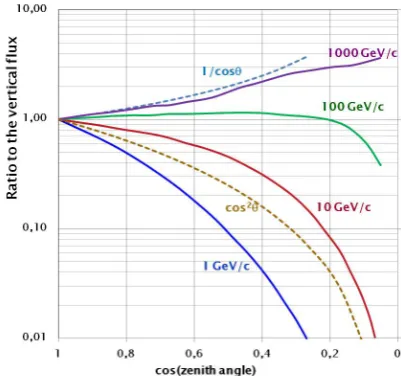
Figure 2 gives a quantitative description of this ef-fect. Muons below the few GeV/c momentum range fade fairly quickly with increasing zenith angle, with dependence ∝cosnθ, wheren∼2÷3.
S. Cecchini and M. Spurio: Atmospheric muons:experimental aspects 3
into account. Semi-analytical solutions (as those used in the higher energy range) overestimate the flux. The energy spectrum is almost flat, starting to steepen grad-ually in the same way as the primary spectrum above 10 GeV.
– µ≤Eµ≤π,K, whereπ= 115 GeV andK = 850 GeV are the critical energies for the vertical directions. Above∼100 GeV, the muon flux has the same power law of the parent mesons, and hence of the primary CRs. Below 100 GeV, the effect of the muon energy loss in the atmosphere it still important, particularly going to-wards the horizontal direction.
– Eµπ,K. The meson production spectrum has the same power law dependence of the primary CRs, but the rate of their decay steepen one power ofEµsince the pion and kaon decay probability is suppressed. The thickness of the atmosphere is not large enough for pi-ons to decay, since the high Lorentz factor. ForE > π the inclined muon spectrum is flatter than the vertical one and the muon flux is respectively higher.
In the intermediate and high energy region (above 100 GeV) and for zenith angleθ <60◦an approximate formula holds:
dNµ(Eµ,θ) dEµdΩ
=AE−γµ
1
1 + (aEµ
π )cosθ
+ B
1 + (bEµ
K)cosθ
(5) where the scale factorA, the power indexγ, the balance fac-torB (which depends on the ratio of muons produced by kaons and pions), and thea,bcoefficients are adjustable pa-rameters. Different best estimates of these parameters were published by several authors. For a review, see (Lesparre et al., 2010). Because pions decay more easily in non-vertical showers, a zenith angleθfactor enters in the formula and muons at large angles have a flatter energy spectrum.
2.1 Angular distribution at sea level
The muon intensity from horizontal directions at low ener-gies is naturally reduced because of muon decays and absorp-tion effects in the thicker atmosphere at large zenith angles. At high energy the parent particles of muons travel relatively long distances in rare parts of the atmosphere. As a conse-quence, their decay probability is increased compared to the interaction probability.
Figure 2 gives a quantitative description of this effect. Muons below the few GeV/c momentum range fade fairly quickly with increasing zenith angle, with dependence∝ cosnθ, wheren∼2÷3.
The flux of muons in the 100 GeV/c range is relatively flat up tocosθ'0.2and then quickly declines. At 1 TeV/c the flux monotonically increases with the zenith angle, ap-proaching the1/cosθdependence. The flux of TeV muons is particularly sensitive to large values of the zenith angle.
Fig. 2. Angular distribution of muons at the ground for differ-ent muon energies. The overall angular distribution of muons mea-sured at sea level is∝cos2θ, which is characteristic of muons with
Eµ∼3GeV. At lower energy the angular distribution becomes in-creasingly steep, while at higher energy it flattens, approaching a 1/cosθdistribution forEµπandθ <60◦. At large angles low energy muons decay before reaching the surface and high energy pions decay before they interact, thus the average muon energy in-creases. The estimate of the angular distribution is based on a Monte Carlo and accounts for the curvature of the Earth atmosphere.
When approaching the horizontal direction, a small differ-ence incosθchanges appreciably the thickness and the den-sity profile of the atmosphere and the corresponding muon energy spectrum. For this reason the measurements of al-most horizontal muons is very difficult.
3 Measurements at sea level
Measurements performed at ground level offer the advantage of a high stability, large collecting factor and long exposure time due to relatively favourable experimental conditions. Sea level data offer the possibility to perform a robust check of the reliability of existing Monte-Carlo codes.
Many of the experiments devoted to the measurement of the muon momentum spectra and intensity (vertical and in-clined directions) have been carried out since the ’70s. The results are often in disagreement with one another; the dis-crepancies are significantly larger than the experimental re-ported errors. Recently new instruments, mainly spectrom-eters designed for balloon experiments or used primarily in CERN LEP and LHC experiments and used also to CR stud-ies, have added new valuable information.
Fig. 2. Angular distribution of muons at the ground for different muon energies. The overall angular distribution of muons mea-sured at sea level is∝cos2θ, which is characteristic of muons with
Eµ∼3 GeV. At lower energy the angular distribution becomes
in-creasingly steep, while at higher energy it flattens, approaching a 1/cosθ distribution forEµπandθ <60◦. At large angles low
energy muons decay before reaching the surface and high energy pions decay before they interact, thus the average muon energy in-creases. The estimate of the angular distribution is based on a Monte Carlo and accounts for the curvature of the Earth atmosphere.
The flux of muons in the 100 GeV/c range is relatively flat up to cosθ'0.2 and then quickly declines. At 1 TeV/c the flux monotonically increases with the zenith angle, ap-proaching the 1/cosθ dependence. The flux of TeV muons is particularly sensitive to large values of the zenith angle. When approaching the horizontal direction, a small differ-ence in cosθchanges appreciably the thickness and the den-sity profile of the atmosphere and the corresponding muon energy spectrum. For this reason the measurements of almost horizontal muons is very difficult.
3 Measurements at sea level
Measurements performed at ground level offer the advantage of a high stability, large collecting factor and long exposure time due to relatively favourable experimental conditions. Sea level data offer the possibility to perform a robust check of the reliability of existing Monte-Carlo codes.
Many of the experiments devoted to the measurement of the muon momentum spectra and intensity (vertical and in-clined directions) have been carried out since the 1970s. The results are often in disagreement with one another; the dis-crepancies are significantly larger than the experimental re-ported errors. Recently new instruments, mainly spectrom-eters designed for balloon experiments or used primarily in
188 S. Cecchini and M. Spurio: Atmospheric muons: experimental aspects
CERN LEP and LHC experiments and used also to CR stud-ies, have added new valuable information.
The vertical muon intensity at sea level is a quantity that varies with the geomagnetic latitude, altitude, solar activity and atmospheric conditions. When comparing muon obser-vations at low energies (<20 GeV/c) it is important to know the year and location where the measurements were made (Cecchini and Sioli, 2000).
The geomagnetic field tends to prevent low energy cosmic rays from penetrating through the magnetosphere down to the Earth’s atmosphere. At any point on the Earth one can define a threshold (or cut-off) rigidity for cosmic rays arriv-ing at a particular zenith and azimuth angle. Primary nuclei having lower rigidity are deflected by the action of the ge-omagnetic field and do not produce muons at that latitude. The cut-off values range from less than 1 GV near the ge-omagnetic poles to about 16 GV for vertical particles near the equator. As CR primaries are predominantly protons and nuclei, it results that at a given location the intensity from the west is stronger than that from the east. The geomag-netic effects are important for sea level muons up to about
Eµ∼5 GeV, and the effect is larger at higher altitudes. The 11-yr solar cycle influences the primary CR spectrum at the top of the atmosphere, as the configuration of the in-terplanetary magnetic field varies. It results that the cosmic ray flux is significantly modulated up to energies of about 20 GeV.
Most experiments are not performed exactly at sea level. A correction to take into account the dependence of the flux on the altitude must be included. For muon momenta above 10 GeV and altitudesH less than∼1000 m, the vertical muon flux can be parameterised asIµ(H )=Iµ(0) e−H /L(p), where
L(p)= 4900 + 750p is a scale factor (in metres) which de-pends on muon momentum,p(measured in GeV/c).
Changes in pressure and temperature in the atmosphere above the detector produce variations which will be consid-ered in Sect. 5.2.
3.1 Experimental setups
Different experimental methods were used to measure the muon flux and energy spectrum.
Muon telescopes are made of several charged particle de-tectors arranged along a straight line and interlaid by one or more layers of absorbing material. In some experiments the detector and absorber are in a rigid construction which could be rotated in zenith and azimuth direction, allowing the selec-tion of muons from a given direcselec-tion of celestial hemisphere. The quantity of material (in g cm−2) travelled by muons in such a telescope is approximately constant and it sets the muon energy threshold.
Multi-directional muon telescopes generally consist of at least two layers of segmented muon detectors. The coinci-dence of signals between two counters in upper and bottom layers determines the direction of muon arrival. The quantity
4 S. Cecchini and M. Spurio: Atmospheric muons:experimental aspects
The vertical muon intensity at sea level is a quantity that varies with the geomagnetic latitude, altitude, solar activity and atmospheric conditions. When comparing muon obser-vations at low energies (<20GeV/c) it is important to know the year and location where the measurements were made (Cecchini and Sioli, 2000).
Thegeomagnetic fieldtends to prevent low energy cosmic rays from penetrating through the magnetosphere down to the Earth’s atmosphere. At any point on the Earth one can define a threshold (or cut-off) rigidity for cosmic rays arriv-ing at a particular zenith and azimuth angle. Primary nuclei having lower rigidity are deflected by the action of the ge-omagnetic field and do not produce muons at that latitude. The cut-off values range from less than 1 GV near the ge-omagnetic poles to about 16 GV for vertical particles near the equator. As CR primaries are predominantly protons and nuclei, it results that at a given location the intensity from the West is stronger than that from the East. The geomag-netic effects are important for sea level muons up to about
Eµ∼5GeV, and the effect is larger at higher altitudes. The 11 yrsolar cycleinfluences the primary CR spectrum at the top of the atmosphere, as the configuration of the In-terplanetary Magnetic Field varies. It results that the cosmic ray flux is significantly modulated up to energies of about 20 GeV.
Most experiments are not performed exactly at sea level. A correction to take into account the dependence of the flux on thealtitudemust be included. For muon momenta above 10 GeV and altitudesH less than∼1000 m the vertical muon flux can be parameterized asIµ(H) =Iµ(0)e−H/L(p), where
L(p) = 4900 + 750pis a scale factor (in meters) which de-pends on muon momentum,p(measured in GeV/c).
Changes in pressure and temperaturein the atmosphere above the detector produce variations which will be consid-ered in §5.2.
3.1 Experimental setups
Different experimental methods were used to measure the muon flux and energy spectrum.
Muon telescopes are made of several charged particle de-tectors arranged along a straight line and interlaid by one or more layers of absorbing material. In some experiments the detector and absorber are in a rigid construction which could be rotated in zenith and azimuth direction, allowing the se-lection of muons from a given direction of celestial hemi-sphere. The quantity of material (in g cm−2) travelled by muons in such a telescope is approximately constant and it sets the muon energy threshold.
Multi-directional muon telescopes generally consist of at least two layers of segmented muon detectors. The coinci-dence of signals between two counters in upper and bottom layers determines the direction of muon arrival. The quan-tity of material crossed by the particle in such detectors in-creases with increase of zenith angle, so the threshold energy
Fig. 3. Variation of absolute integral intensity of muons at sea level with the zenith angle. The momentum thresholdpTis slightly dif-ferent for each experiment and ranges from 0.1 to 1 GeV/c. The points are normalized assumingpT= 0.35GeV/c. The points cor-respond (from top to bottom): Flint et al. (1972), Jakeman (1956), Wilson (1959), Gettert et al. (1993), Dmitrieva et al. (2006), Crokes and Rastin (1972).
for multidirectional muon telescopes depends onθ. A compi-lation of measurements of the muon flux at latitudes between 52◦ and 56◦ as a function of the zenith angle by different experiments is reported in Fig. 3.
The muon energy spectrum has been extensively mea-sured, mainly by solid iron magnet spectrometers. For these detectors, the multiple scattering plays an important role in the momentum resolution, particularly at low ener-gies. Recently, measurements have been performed using low mass superconducting magnet spectrometers designed as a balloon-borne apparatus for cosmic ray studies. They represent a sort of second generation experiments.
The atmospheric muon flux and energy spectrum was also measured using the precise muon spectrometer of the L3 de-tector which was located at the LEP collider at CERN. This apparatus collected muons ∼30m below a stratified rock overburden, and with dimensions much larger than previous experiments (the volume of the region with a magnetic field of 0.5 T was∼1000m3).
Finally, information about the muon flux with momenta larger than few TeV have been extracted from underground measurements, see §4. Comprehensive review of various types of particle detectors used for cosmic ray studies can be found in Dorman (2004).
3.2 Momentum spectra at the vertical direction
Table 1 lists the authors and energy range of the reported absolute vertical intensity measurements. It is also shown if the experiment has been used by other reviews, namely “B” (Bugaev et al., 1998), “H&T” (Hebbeker and Timmermans, 2002) and in the Particle Data Group “PDG” (Nakamura et al., 2010). For H&T we report also the final normalization
Fig. 3. Variation of absolute integral intensity of muons at sea level with the zenith angle. The momentum thresholdpTis slightly
dif-ferent for each experiment and ranges from 0.1 to 1 GeV/c. The points are normalised assumingpT= 0.35 GeV/c. The points
cor-respond (from top to bottom): Flint et al. (1972), Jakeman (1956), Wilson (1959), Gettert et al. (1993), Dmitrieva et al. (2006), Crokes and Rastin (1972).
of material crossed by the particle in such detectors increases with increase of zenith angle, so the threshold energy for multidirectional muon telescopes depends onθ. A compila-tion of measurements of the muon flux at latitudes between 52 and 56◦as a function of the zenith angle by different ex-periments is reported in Fig. 3.
The muon energy spectrum has been extensively mea-sured, mainly by solid iron magnet spectrometers. For these detectors, the multiple scattering plays an important role in the momentum resolution, particularly at low energies. Recently, measurements have been performed using low mass superconducting magnet spectrometers designed as a balloon-borne apparatus for cosmic ray studies. They repre-sent a sort of second generation experiments.
The atmospheric muon flux and energy spectrum was also measured using the precise muon spectrometer of the L3 de-tector which was located at the LEP collider at CERN. This apparatus collected muons ∼30 m below a stratified rock overburden, and with dimensions much larger than previous experiments (the volume of the region with a magnetic field of 0.5 T was∼1000 m3).
Finally, information about the muon flux with momenta larger than few TeV have been extracted from underground measurements, see Sect. 4. Comprehensive review of various types of particle detectors used for cosmic ray studies can be found in Dorman (2004).
3.2 Momentum spectra at the vertical direction
Table 1 lists the authors and energy range of the reported absolute vertical intensity measurements. It is also shown if the experiment has been used by other reviews, namely “B” (Bugaev et al., 1998), “H&T” (Hebbeker and Timmermans, 2002) and in the Particle Data Group “PDG” (Nakamura et
S. Cecchini and M. Spurio: Atmospheric muons: experimental aspects 189
Table 1. Compilation of different measurements of the muon mo-mentum spectrum. The second column reports the momo-mentum range; the 3rd, 4th and 5th columns if the data are used in the com-pilation of Bugaev et al. (1998), Hebbeker and Timmermans (2002) (with the used normalisations factor) and Nakamura et al. (2010), respectively.
Reference pµ[GeV/c] B H & T PDG
Ashton and Wolfendale (1963) 15.1–82.1 X 0.79
Ayre et al. (1975) 20–500 X X
Baber et al. (1968) 11–810 X X
Rastin (1984) 3–3000 X 0.933 X Bateman et al. (1971) 10–150 X 0.858 Allkofer et al. (1968) 20–1000 X 1.039 X De Pascale et al. (1993)∗ 0.25–100 X 0.944 X Kremer et al. (1999)∗ 0.2–120 0.818 X Achard et al. (2004) 20–3000 X Haino et al. (2004)∗ 0.6–400 X
∗Experiments with magnetic spectrometers.
S. Cecchini and M. Spurio: Atmospheric muons:experimental aspects 5
Table 1. Compilation of different measurements of the muon momentum spectrum. The second column reports the momentum range; the 3rd,4th and 5th columns if the data are used in the com-pilation of Bugaev et al. (1998), Hebbeker and Timmermans (2002) (with the used normalizations factor) and Nakamura et al. (2010), respectively.
Reference pµ[GeV/c] B H&T PDG
Ashton and Wolfendale (1963) 15.1–82.1 X 0.79
Ayre et al. (1975) 20–500 X X
Baber et al. (1968) 11–810 X X
Rastin (1984) 3–3000 X 0.933 X
Bateman et al. (1971) 10–150 X 0.858 Allkofer et al. (1968) 20–1000 X 1.039 X De Pascale et al. (1993)* 0.25–100 X 0.944 X
Kremer et al. (1999)* 0.2–120 0.818 X
Achard et al. (2004) 20–3000 X
Haino et al. (2004)* 0.6–400 X
* Experiments with magnetic spectrometers.
factor they have found. The symbol (*) refers to experiment using superconducting magnet spectrometers.
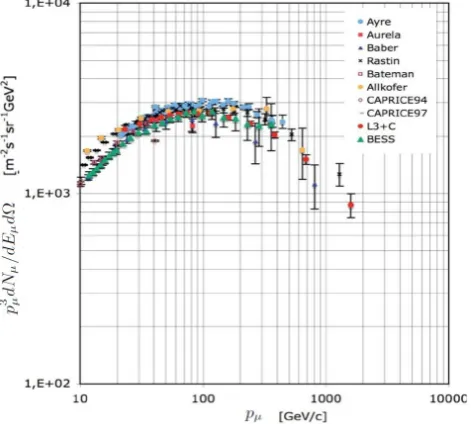
The measurements listed in Table 1 (only published re-sults) of the muon momentum from the vertical direction are presented in Fig. 4. The agreement between measurements is relatively good and the largest contribution to the devia-tions are the systematic errors due to incorrect knowledge of the acceptance, efficiency of the counters and corrections for multiple scattering.
Measurements of the muon momentum spectra forpµ<1
TeV/c are particularly important for the comparison of nu-clear cascade models with available data. The differences between the measurements of the sea-level spectra are more evident if the percentage deviations of the data from one of the parameterization are plotted (see Fig. 5). Differences of
±15–20 % exist between the data and the parameterization.
The disagreement between the different experiments can be as large as 30–35 % despite the fact that the declared individ-ual errors are small (however increasing with momentum due to the decreasing number of detectable particles and to the maximum detectable momentum). The origin of the discrep-ancies can well be due to the incorrect knowledge/control of systematic effects. For example, in the case of L3 + C the stable negative deviations can be due to a bad correction for the molasses that cover the apparatus.
4 Underground muons
Underground measurements offer the possibility to extend the energy range of the muon spectrum beyond 1 TeV. Such data are of an indirect type, but their link with the direct lower energy observations gives the possibility to complete the pic-ture of muon spectra measurements.
Fig. 4. Vertical absolute differential muon intensity p3
µdNµ/dEµdΩ at sea level for the experiments reported in Tab. 1. The ordinate values have been multiplied byp3µin order to compress the plot and to emphasize the differences. In this energy range,pµ'Eµ.
Fig. 5. Relative deviations of the differential muon intensity mea-surements at sea level with respect to the Bugaev et al. (1998) pa-rameterization. The symbols are the same as in Fig. 4; the indirect measurements described in §4.2 and Fig. 7 are also included.
Deep underground detectors have normally large collect-ing area and are not subject to the time restrictions of bal-loon and satellite experiments, so they can measure the muon flux for a very long time. As a drawback, as discussed in
§2, the energy dependence of the muon spectrum atEµ>1
TeV steepens one power and the intensity is a factor 1000 smaller than that of primary CRs on the upper atmosphere.
Fig. 4. Vertical absolute differential muon intensity
p3µd Nµ/d Eµd at sea level for the experiments reported
in Table 1. The ordinate values have been multiplied by pµ3 in order to compress the plot and to emphasise the differences. In this energy range,pµ'Eµ.
al., 2010). For H&T we report also the final normalisation factor they have found. The symbol (∗) refers to experiment using superconducting magnet spectrometers.
The measurements listed in Table 1 (only published re-sults) of the muon momentum from the vertical direction are presented in Fig. 4. The agreement between measurements is relatively good and the largest contribution to the devia-tions are the systematic errors due to incorrect knowledge of the acceptance, efficiency of the counters and corrections for multiple scattering.
S. Cecchini and M. Spurio: Atmospheric muons:experimental aspects 5
Table 1. Compilation of different measurements of the muon momentum spectrum. The second column reports the momentum range; the 3rd,4th and 5th columns if the data are used in the com-pilation of Bugaev et al. (1998), Hebbeker and Timmermans (2002) (with the used normalizations factor) and Nakamura et al. (2010), respectively.
Reference pµ[GeV/c] B H&T PDG
Ashton and Wolfendale (1963) 15.1–82.1 X 0.79
Ayre et al. (1975) 20–500 X X
Baber et al. (1968) 11–810 X X
Rastin (1984) 3–3000 X 0.933 X
Bateman et al. (1971) 10–150 X 0.858
Allkofer et al. (1968) 20–1000 X 1.039 X
De Pascale et al. (1993)* 0.25–100 X 0.944 X
Kremer et al. (1999)* 0.2–120 0.818 X
Achard et al. (2004) 20–3000 X
Haino et al. (2004)* 0.6–400 X
* Experiments with magnetic spectrometers.
factor they have found. The symbol (*) refers to experiment using superconducting magnet spectrometers.
The measurements listed in Table 1 (only published re-sults) of the muon momentum from the vertical direction are presented in Fig. 4. The agreement between measurements is relatively good and the largest contribution to the devia-tions are the systematic errors due to incorrect knowledge of the acceptance, efficiency of the counters and corrections for multiple scattering.
Measurements of the muon momentum spectra forpµ<1
TeV/c are particularly important for the comparison of nu-clear cascade models with available data. The differences between the measurements of the sea-level spectra are more evident if the percentage deviations of the data from one of the parameterization are plotted (see Fig. 5). Differences of
±15–20 % exist between the data and the parameterization.
The disagreement between the different experiments can be as large as 30–35 % despite the fact that the declared individ-ual errors are small (however increasing with momentum due to the decreasing number of detectable particles and to the maximum detectable momentum). The origin of the discrep-ancies can well be due to the incorrect knowledge/control of systematic effects. For example, in the case of L3 + C the stable negative deviations can be due to a bad correction for the molasses that cover the apparatus.
4 Underground muons
Underground measurements offer the possibility to extend the energy range of the muon spectrum beyond 1 TeV. Such data are of an indirect type, but their link with the direct lower energy observations gives the possibility to complete the pic-ture of muon spectra measurements.
Fig. 4. Vertical absolute differential muon intensity
p3
µdNµ/dEµdΩ at sea level for the experiments reported in Tab. 1. The ordinate values have been multiplied byp3
µin order to compress the plot and to emphasize the differences. In this energy range,pµ'Eµ.
Fig. 5. Relative deviations of the differential muon intensity mea-surements at sea level with respect to the Bugaev et al. (1998) pa-rameterization. The symbols are the same as in Fig. 4; the indirect measurements described in §4.2 and Fig. 7 are also included.
Deep underground detectors have normally large collect-ing area and are not subject to the time restrictions of bal-loon and satellite experiments, so they can measure the muon flux for a very long time. As a drawback, as discussed in
§2, the energy dependence of the muon spectrum atEµ>1
TeV steepens one power and the intensity is a factor 1000 smaller than that of primary CRs on the upper atmosphere.
Fig. 5. Relative deviations of the differential muon intensity mea-surements at sea level with respect to the Bugaev et al. (1998) pa-rameterisation. The symbols are the same as in Fig. 4; the indirect measurements described in Sect. 4.2 and Fig. 7 are also included.
Measurements of the muon momentum spectra for
pµ<1 TeV/c are particularly important for the comparison of nuclear cascade models with available data. The differ-ences between the measurements of the sea-level spectra are more evident if the percentage deviations of the data from one of the parameterisation are plotted (see Fig. 5). Differ-ences of±15–20 % exist between the data and the param-eterisation. The disagreement between the different experi-ments can be as large as 30–35 % despite the fact that the de-clared individual errors are small (however increasing with momentum due to the decreasing number of detectable parti-cles and to the maximum detectable momentum). The origin of the discrepancies can well be due to the incorrect knowl-edge/control of systematic effects. For example, in the case of L3 + C, the stable negative deviations can be due to a bad correction for the molasses that cover the apparatus.
4 Underground muons
Underground measurements offer the possibility to extend the energy range of the muon spectrum beyond 1 TeV. Such data are of an indirect type, but their link with the direct lower energy observations gives the possibility to complete the pic-ture of muon spectra measurements.
Deep underground detectors have normally large collect-ing area and are not subject to the time restrictions of balloon and satellite experiments, so they can measure the muon flux for a very long time. As a drawback, as discussed in Sect. 2, the energy dependence of the muon spectrum atEµ>1 TeV steepens one power and the intensity is a factor 1000 smaller than that of primary CRs on the upper atmosphere. The penetrating component of CRs underground depends on a complex convolution of different physics processes, as the
190 S. Cecchini and M. Spurio: Atmospheric muons: experimental aspects
high energy muon production spectrum and the muon energy losses. Particularly important is the knowledge of the com-position and of the thickness of the material overburden on top of the detector.
4.1 Muon energy losses
Muon energy losses are usually divided into continuous and discrete processes. The former is due to ionisation, which depends weakly on muon energy and can be considered nearly constant for relativistic particles. For muons below ∼500 GeV, this is the dominant energy loss process. For muons reaching great depths, discrete energy losses become important: bremsstrahlung (“br”), direct electron-positron pair production (“pair”) and electromagnetic interaction with nuclei (photo production, “ph”). In these radiative processes energy is lost in bursts along the muon path. In general the total muon energy loss is parameterised as
d Eµ
d X = −α−β Eµ (6)
where X is the thickness of crossed material in g cm−2 andβ=βbr+βpair+βphis the sum of fractional energy loss in the three mentioned radiation processes. As the rock compositions are different for different underground exper-iments, the so-called standard rock is defined as a com-mon reference. The standard rock is characterised by density
ρ= 2.65 g cm−3, atomic massA= 22 and chargeZ= 11. The thicknessX is commonly given in units of metres of water equivalent (1 m w.e. = 102g cm−2).
The factorsα andβ in Eq. (6) are mildly energy depen-dent as well as dependepen-dent upon the chemical composition of the medium: in particularα∝Z/Aandβ∝Z2/A. Typical values are α'2 MeV g−1cm2 and β'4×10⁻⁶g−1cm2. The critical energy is defined as the energy at which ionisation energy loss equals radiative energy losses:
µ=α/β'500 GeV.
The general solution of Eq. (6) corresponds to the average energyhEµiof a beam of muons with initial energyE0µafter penetrating a depthX:
hEµ(X)i =
Eµ0 +µ
e−βX−µ. (7)
The minimum energy required for a muon at the surface to reach slant depthXis the solution of Eq. (7) with residual energyEµ(X)= 0:
Eµ,0min =µ
eβX−1. (8)
The rangeRfor a muon of energyEµ0, i.e. the underground depth that this muon will reach, is
R
Eµ0
= 1
β ln 1+ Eµ0
µ !
. (9)
6 S. Cecchini and M. Spurio: Atmospheric muons:experimental aspects
The penetrating component of CRs underground depends on a complex convolution of different physics processes, as the high energy muon production spectrum and the muon energy losses. Particularly important is the knowledge of the com-position and of the thickness of the material overburden on top of the detector.
4.1 Muon energy losses
Muon energy losses are usually divided into continuous and discrete processes. The former is due to ionization, which depends weakly on muon energy and can be considered nearly constant for relativistic particles. For muons below∼ 500GeV, this is the dominant energy loss process. For muons reaching great depths, discrete energy losses become impor-tant: bremsstrahlung (“br”), direct electron-positron pair pro-duction (“pair”) and electromagnetic interaction with nuclei (photoproduction, “ph”). In these radiative processes energy is lost in bursts along the muon path. In general the total muon energy loss is parameterized as:
dEµ
dX =−α−βEµ (6)
whereXis the thickness of crossed material in g cm−2and β=βbr+βpair+βph is the sum of fractional energy loss
in the three mentioned radiation processes. As the rock compositions are different for different underground experi-ments, the so-calledstandard rockis defined as a common reference. The standard rock is characterized by density
ρ= 2.65g cm−3, atomic massA= 22and chargeZ= 11.
The thicknessX is commonly given in units of meters of water equivalent (1 m.w.e. = 102g cm−2).
The factorsαandβin Eq. (6) are mildly energy dependent as well as dependent upon the chemical composition of the medium: in particularα∝Z/Aandβ∝Z2/A. Typical
val-ues areα'2MeV g−1cm2andβ'4×10⁻⁶g−1cm2. The
critical energy is defined as the energy at which ionization energy loss equals radiative energy losses:µ=α/β'500 GeV.
The general solution of Eq. (6) corresponds to the average energyhEµiof a beam of muons with initial energyEµ0after penetrating a depthX:
hEµ(X)i= (E0µ+µ)e−βX−µ (7)
The minimum energy required for a muon at the surface to reach slant depthXis the solution of Eq. (7) with residual energyEµ(X) = 0:
E0µ,min=µ(eβX−1) (8)
The rangeRfor a muon of energyE0
µ, i.e. the underground depth that this muon will reach, is:
R(E0 µ) =
1 βln(1 +
E0 µ µ
) (9)
Fig. 6. Minimum energy at surface,Eminto reach a given
un-derground depthX=h. Typical values ofEminfor muons are 2,
20 and 2000 GeV to reach the ground (10 m.w.e.), the LEP tunnel (∼80m.w.e.) and the Gran Sasso Laboratory (∼3km.w.e.), re-spectively.
The above quantities are average values. For precise calcu-lations of the underground muon flux one needs to take into account the fluctuations inherent to the radiative processes. Because of the stochastic character of muon interaction processes with large energy transfers (e.g. bremsstrahlung) muons are subject to a considerable range straggling. The higherE0
µis, the more dominant are the radiation processes and the more important are the fluctuations of the energy losses which broaden the distribution of the range (Lipari and Stanev , 1991). Figure 6 shows the typical values of the min-imum energy at surface,Eminto reach a given underground
depth.
4.2 The depth-intensity relation
The muon spectrum at energies above few TeV was de-duced by underground measurements. The procedure used for thisindirectmeasurement of the sea-level energy spec-trum passes through the determination of the so-called depth-intensity relation(DIR)I0
µ(h). This quantity represents the muon intensity at the vertical direction as a function of the depthh. As underground detectors are at a fixed position, in principle only one point can be measured. However, when measuring the muon intensityIµ(h,θ)at different zenith an-gleθ, the quantity of rock (or water) overburden changes. At high energy (Eµ>1TeV) and forθ <60◦, Eq. (5) provides a simple relationship betweenI0
µ(h)andIµ(h,θ):
Iµ(h,θ) =Iµ0(h)/cosθ (10) From the experimental point of view,Iµ(h,θ)is measured at a given directionθ, corresponding to a slant depthh, as:
Iµ(h,θ) =
1 ∆T
P
iNimi
P
j∆Ωj(θ,φ)Aj(θ,φ)j(θ,φ) (11) Fig. 6. Minimum energy at surface, Emin to reach a given
un-derground depthX=h. Typical values of Emin for muons are 2,
20 and 2000 GeV to reach the ground (10 m w.e.), the LEP tun-nel (∼80 m w.e.) and the Gran Sasso Laboratory (∼3 km w.e.), respectively.
The above quantities are average values. For precise calcu-lations of the underground muon flux one needs to take into account the fluctuations inherent to the radiative processes. Because of the stochastic character of muon interaction processes with large energy transfers (e.g. bremsstrahlung) muons are subject to a considerable range straggling. The higherEµ0 is, the more dominant are the radiation processes and the more important are the fluctuations of the energy losses which broaden the distribution of the range (Lipari and Stanev , 1991). Figure 6 shows the typical values of the min-imum energy at surface,Eminto reach a given underground depth.
4.2 The depth-intensity relation
The muon spectrum at energies above few TeV was de-duced by underground measurements. The procedure used for this indirect measurement of the sea-level energy spec-trum passes through the determination of the so-called depth-intensity relation (DIR)Iµ0(h). This quantity represents the muon intensity at the vertical direction as a function of the depth h. As underground detectors are at a fixed position, in principle only one point can be measured. However, when measuring the muon intensityIµ(h, θ )at different zenith an-gleθ, the quantity of rock (or water) overburden changes. At high energy (Eµ>1 TeV) and forθ <60◦, Eq. (5) provides a simple relationship betweenIµ0(h)andIµ(h, θ ):
Iµ(h, θ )=Iµ0(h)
cosθ . (10)
From the experimental point of view,Iµ(h, θ )is measured at a given directionθ, corresponding to a slant depthh, as
Iµ(h, θ )=
1
1T
P i
Nimi P
j1 j(θ, φ) Aj(θ, φ) j(θ, φ) (11) where1T in the total livetime (in s) of the experiment,Ni is the number of detected events with multiplicitymi with
S. Cecchini and M. Spurio: Atmospheric muons: experimental aspects 191
S. Cecchini and M. Spurio: Atmospheric muons:experimental aspects 7
Table 2. Compilation of different indirect measurements of the muon momentum with underground detectors.
Experiment Depth Momentum
(Reference) (m.w.e.) (TeV/c)
LVD Aglietta et al. (1995) >3000 1.9–43 MACRO Ambrosio et al. (1995) >3150 0.5–20 Baksan Bakatanov et al. (1992) >850 1–30 MSU Zatsepin et al. (1994) >50 3–50
where∆T in the total livetime (in s) of the experiment,Ni
is the number of detected events with multiplicitymi with
zenith θ and azimuthφin the angular bin ∆Ωj(θ,φ) (sr). Aj(θ,φ)(m2) andj(θ,φ)correspond to the geometrical
in-trinsic acceptance of the detector, and the overall efficiency in the(θ,φ)bin.
The relation between the measured DIR functionI0
µ(h)
(measured from Eq. 11 with the use Eq. 10) and the differen-tial sea-level muon spectrum dNµ
dEµdΩis expressed as:
Iµ0(h) =
Z∞
0
dNµ
dEµdΩ
P(Eµ,h)dEµ (12)
Here,P(Eµ,h)is the muon survival function. It represents
the probability that muons of energyEµat surface reach a
given depthh, and it is determined via Monte Carlo calcu-lations. Assuming Eq. (5) for the sea-level muon spectrum, leaving as free parameters the muon spectral indexγ, the scaleAand the balanceBfactors, it is possible to unfold the sea level muon spectrum from the measured vertical muon intensity.
Table 2 indicates the experiments, the depth and the es-timated muon momentum range for these indirect under-ground measurements. The results are shown in Fig. 7. The differential distribution (dNµ/dEµdΩ) is presented, as usual,
multiplied by a factorp3
µ(as momentum and energy
coin-cide) to better observe the variation of the spectrum in the whole energy region. In these indirect measurements, the main sources of systematic uncertainties are due to the treat-ment of hard processes in the energy loss of muons and to the knowledge of the rock density and overburden thickness, which rely on geological surveys.
This situation seems to favour underwater/ice experi-ments. In this case, the uncertainty in the material density and overburden is negligible with respect to underground ex-periments. However, when small-size experiments are car-ried out, the main uncertainty is the multiplicity of the muon bundle. In the case of large underwater experiments (like the running neutrino telescopes, Chiarusi and Spurio, 2010), they are optimized to look for upward-going neutrino in-duced particles. Atmospheric muons are seen with the “tail of the eyes” (the photomultipliers inside optical modules), where large uncertainties on the optical module angular ac-ceptance do not allow a precision measurements. See Aguilar
Fig. 7. Extension of the data shown in Fig. 4 to higher momenta, by including the indirect measurement of the underground muon flux.
Fig. 8. A multimuon event seen in the MACRO experiment. 10 different tracks are identified.
et al. (2010) for a discussion and the DIR measurement with the ANTARES underwater neutrino telescope.
5 Characteristic of underground/underwater muons
Figure 8 shows a multiple muon event detected by MACRO. Multiple events are closely packed bundles of parallel muons, usually of high energy, originating from the same primary CR. Multi-muon events are used to explore the prop-erties of very high energy hadronic interactions and to study the longitudinal development of showers (Ambrosio et al., 1997a,b). The multiplicity of produced secondary particles increases with the energy of the initiating particle. The muon multiplicity is an observable which is also correlated with the mass of the primary CR: at a given total energy, heavier nuclei produce more muons than a primary proton.
The interaction vertex of the particles which initiate the air showers is typically at an atmospheric altitude of 15 km. Since secondary particles in hadronic cascades have small transverse momentapt (∼300MeV/c), high energy muons are essentially collimated near the shower axis. Considering a primary nucleon, producing mesons of energyEπ,Kwith
Fig. 7. Extension of the data shown in Fig. 4 to higher momenta, by including the indirect measurement of the underground muon flux.
zenithθ and azimuthφin the angular bin1 j(θ, φ)(sr).
Aj(θ, φ)(m2) and j(θ, φ)correspond to the geometrical intrinsic acceptance of the detector, and the overall efficiency in the(θ, φ)bin.
The relation between the measured DIR function Iµ0(h)
(measured from Eq. 11 with the use Eq. 10) and the differen-tial sea-level muon spectrum d Nµ
d Eµd is expressed as
Iµ0(h) = ∞ Z
0
d Nµ
d Eµd
P Eµ, hd Eµ. (12)
Here,P (Eµ, h)is the muon survival function. It represents the probability that muons of energyEµat surface reach a given depthh, and it is determined via Monte Carlo calcu-lations. Assuming Eq. (5) for the sea-level muon spectrum, leaving as free parameters the muon spectral indexγ, the scaleAand the balanceBfactors, it is possible to unfold the sea level muon spectrum from the measured vertical muon intensity.
Table 2 indicates the experiments, the depth and the es-timated muon momentum range for these indirect under-ground measurements. The results are shown in Fig. 7. The differential distribution (d Nµ/d Eµd ) is presented, as usual, multiplied by a factorp3µ(as momentum and energy coincide) to better observe the variation of the spectrum in the whole energy region. In these indirect measurements, the main sources of systematic uncertainties are due to the treat-ment of hard processes in the energy loss of muons and to the knowledge of the rock density and overburden thickness, which rely on geological surveys.
This situation seems to favour underwater/ice experi-ments. In this case, the uncertainty in the material density and overburden is negligible with respect to underground
Table 2. Compilation of different indirect measurements of the muon momentum with underground detectors.
Experiment Depth Momentum
(Reference) (m w.e.) (TeV/c)
LVD (Aglietta et al., 1995) >3000 1.9–43
MACRO (Ambrosio et al., 1995) >3150 0.5–20
Baksan (Bakatanov et al., 1992) >850 1–30
MSU (Zatsepin et al., 1994) >50 3–50
experiments. However, when small-size experiments are car-ried out, the main uncertainty is the multiplicity of the muon bundle. In the case of large underwater experiments (like the running neutrino telescopes, Chiarusi and Spurio, 2010), they are optimised to look for upward-going neutrino induced particles. Atmospheric muons are seen with the “tail of the eyes” (the photomultipliers inside optical modules), where large uncertainties on the optical module angular acceptance do not allow a precision measurements. See Aguilar et al. (2010) for a discussion and the DIR measurement with the ANTARES underwater neutrino telescope.
5 Characteristic of underground/underwater muons
Figure 8 shows a multiple muon event detected by MACRO. Multiple events are closely packed bundles of parallel muons, usually of high energy, originating from the same pri-mary CR. Multi-muon events are used to explore the proper-ties of very high energy hadronic interactions and to study the longitudinal development of showers (Ambrosio et al., 1997a,b). The multiplicity of produced secondary particles increases with the energy of the initiating particle. The muon multiplicity is an observable which is also correlated with the mass of the primary CR: at a given total energy, heavier nuclei produce more muons than a primary proton.
The interaction vertex of the particles which initiate the air showers is typically at an atmospheric altitude of 15 km. Since secondary particles in hadronic cascades have small transverse momentapt(∼300 MeV/c), high energy muons are essentially collimated near the shower axis. Considering a primary nucleon, producing mesons of energyEπ,K with transverse momentumptat a heightHprod, the average sepa-ration of their daughter high energy muons from the shower axis is given by Ambrosio et al. (1999):
r ' pt
Eπ,K
Hprod. (13)
For primary energies around 1014eV, the lateral displace-ments of energetic muons (∼1 TeV) of several metres are typically obtained underground. Displacements are almost exclusively caused by transferred transverse momentum in hadronic processes. Typical multiple scattering angles for
192 S. Cecchini and M. Spurio: Atmospheric muons: experimental aspects
S. Cecchini and M. Spurio: Atmospheric muons:experimental aspects
7
Table 2.
Compilation of different indirect measurements of the
muon momentum with underground detectors.
Experiment
Depth
Momentum
(Reference)
(m.w.e.)
(TeV/c)
LVD Aglietta et al. (1995)
>
3000
1.9–43
MACRO Ambrosio et al. (1995)
>
3150
0.5–20
Baksan Bakatanov et al. (1992)
>
850
1–30
MSU Zatsepin et al. (1994)
>
50
3–50
where
∆
T in the total livetime (in s) of the experiment,
Ni
is the number of detected events with multiplicity
mi
with
zenith
θ
and azimuth
φ
in the angular bin
∆Ω
j(
θ,φ
)
(sr).
A
j(
θ,φ
)
(m
2) and
j(
θ,φ
)
correspond to the geometrical
in-trinsic acceptance of the detector, and the overall efficiency
in the
(
θ,φ
)
bin.
The relation between the measured DIR function
I
µ0(
h
)
(measured from Eq. 11 with the use Eq. 10) and the
differen-tial sea-level muon spectrum
dNµdEµdΩ
is expressed as:
I
µ0(
h
) =
Z
∞0
d
N
µd
Eµ
d
Ω
P
(
E
µ,h
)
d
E
µ(12)
Here,
P
(
E
µ,h
)
is the muon survival function. It represents
the probability that muons of energy
E
µat surface reach a
given depth
h
, and it is determined via Monte Carlo
calcu-lations. Assuming Eq. (5) for the sea-level muon spectrum,
leaving as free parameters the muon spectral index
γ
, the
scale
A
and the balance
B
factors, it is possible to unfold the
sea level muon spectrum from the measured vertical muon
intensity.
Table 2 indicates the experiments, the depth and the
es-timated muon momentum range for these indirect
under-ground measurements. The results are shown in Fig. 7. The
differential distribution (d
N
µ/
d
E
µd
Ω
) is presented, as usual,
multiplied by a factor
p
3µ(as momentum and energy
coin-cide) to better observe the variation of the spectrum in the
whole energy region. In these indirect measurements, the
main sources of systematic uncertainties are due to the
treat-ment of hard processes in the energy loss of muons and to
the knowledge of the rock density and overburden thickness,
which rely on geological surveys.
This situation seems to favour underwater/ice
experi-ments. In this case, the uncertainty in the material density
and overburden is negligible with respect to underground
ex-periments. However, when small-size experiments are
car-ried out, the main uncertainty is the multiplicity of the muon
bundle. In the case of large underwater experiments (like
the running neutrino telescopes, Chiarusi and Spurio, 2010),
they are optimized to look for upward-going neutrino
in-duced particles. Atmospheric muons are seen with the “tail
of the eyes” (the photomultipliers inside optical modules),
where large uncertainties on the optical module angular
ac-ceptance do not allow a precision measurements. See Aguilar
Fig. 7.
Extension of the data shown in Fig. 4 to higher momenta, by
including the indirect measurement of the underground muon flux.
Fig. 8.
A multimuon event seen in the MACRO experiment. 10
different tracks are identified.
et al. (2010) for a discussion and the DIR measurement with
the ANTARES underwater neutrino telescope.
5
Characteristic of underground/underwater muons
Figure 8 shows a multiple muon event detected by MACRO.
Multiple events are closely packed bundles of parallel
muons, usually of high energy, originating from the same
primary CR. Multi-muon events are used to explore the
prop-erties of very high energy hadronic interactions and to study
the longitudinal development of showers (Ambrosio et al.,
1997a,b). The multiplicity of produced secondary particles
increases with the energy of the initiating particle. The muon
multiplicity is an observable which is also correlated with
the mass of the primary CR: at a given total energy, heavier
nuclei produce more muons than a primary proton.
The interaction vertex of the particles which initiate the
air showers is typically at an atmospheric altitude of 15 km.
Since secondary particles in hadronic cascades have small
transverse momenta
p
t(
∼
300
MeV/c), high energy muons
are essentially collimated near the shower axis. Considering
a primary nucleon, producing mesons of energy
Eπ,K
with
Fig. 8. A multimuon event seen in the MACRO experiment. 10 different tracks are identified.muon energies around 100 GeV in thick layers of rock (50– 100 m) are of the order of a few mrad.
5.1 Atmospheric muons in neutrino telescopes
Atmospheric muons represent the most abundant signal in a neutrino telescope and can be used to calibrate the detector and to check its expected response to the passage of charged particles. On the other side, they can represent a danger-ous background source because downward-going muons can incorrectly be reconstructed as upward-going particles and mimic high energy neutrino interactions; muons in bundles are particularly dangerous. These muons are expected to ar-rive almost at the same time in the plane perpendicular to the shower axis. A full Monte Carlo simulation, starting from the simulation of atmospheric showers, can accurately reproduce the main features of muons reaching a neutrino telescope, but requires a large amount of CPU time.
Recently, parametric formulae (Becherini et al., 2006) to evaluate the flux of atmospheric muons were derived from a full Monte Carlo simulation. These formulas take into account the muon multiplicity and the energy spectrum of muons in a bundle, as a function of the distance from the shower axis. A simple generator interface is provided (called MUPAGE), which can be used by all experiments having a flat overburden coverage of at least 1500 m w.e. (Carminati et al., 2008). MUPAGE is used to simulate atmospheric muons in Mediterranean neutrino telescopes.
The flux – which corresponds to the (d Nµ/d Eµd ) of Eq. (5) integrated over the muon energy Eµ, with units: m−2s−1sr−1 – of muon bundles with multiplicity m (see Fig. 9) is obtained as a function of the depth along the verti-cal directionh0(note that the index 0 means that the depthh is computed exactly at the vertical direction) and zenith angle
θas
8 (m;h0, θ )=
K (h0, θ )
mν(h0,θ ) . (14)
The flux of bundles of increasing multiplicitymdecreases with increasing vertical depth and zenith angle. The para-metric dependences ofK(h0, θ )andν(h0, θ )are reported in Becherini et al. (2006), as the others below.
8 S. Cecchini and M. Spurio: Atmospheric muons:experimental aspects
transverse momentumptat a heightHprod, the average
sepa-ration of their daughter high energy muons from the shower axis is given by Ambrosio et al. (1999):
r' pt Eπ,K
Hprod (13)
For primary energies around 1014eV, the lateral displace-ments of energetic muons (∼1TeV) of several meters are typically obtained underground. Displacements are almost exclusively caused by transferred transverse momentum in hadronic processes. Typical multiple scattering angles for muon energies around 100 GeV in thick layers of rock (50– 100 m) are of the order of a few mrad.
5.1 Atmospheric muons in neutrino telescopes
Atmospheric muons represent the most abundant signal in a neutrino telescope and can be used to calibrate the detector and to check its expected response to the passage of charged particles. On the other side, they can represent a danger-ous background source because downward-going muons can incorrectly be reconstructed as upward-going particles and mimic high energy neutrino interactions; muons in bundles are particularly dangerous. These muons are expected to ar-rive almost at the same time in the plane perpendicular to the shower axis. A full Monte Carlo simulation, starting from the simulation of atmospheric showers, can accurately reproduce the main features of muons reaching a neutrino telescope, but requires a large amount of CPU time.
Recently, parametric formulae (Becherini et al., 2006) to evaluate the flux of atmospheric muons were derived from a full Monte Carlo simulation. These formulas take into account the muon multiplicity and the energy spectrum of muons in a bundle, as a function of the distance from the shower axis. A simple generator interface is provided (called MUPAGE), which can be used by all experiments having a flat overburden coverage of at least 1500 m.w.e. (Carmi-nati et al., 2008). MUPAGE is used to simulate atmospheric muons in Mediterranean neutrino telescopes.
The flux (which corresponds to the (dNµ/dEµdΩ) of Eq. (5) integrated over the muon energy Eµ, with units: m−2s−1sr−1) of muon bundles with multiplicitym
(see Fig. 9) is obtained as a function of the depth along the vertical directionh0(note that the index 0 means that the depth his computed exactly at the vertical direction) and zenith angleθas:
Φ(m;h0,θ) = K(h0,θ)
mν(h0,θ) (14)
The flux of bundles of increasing multiplicitymdecreases with increasing vertical depth and zenith angle. The para-metric dependences ofK(h0,θ)andν(h0,θ)are reported in
Becherini et al. (2006), as the others below.
Fig. 9. Flux of bundles of muons as a function of their multiplicity
min the bundle obtained with Eq. (14) at the depth of 3 km.w.e. and for 5 different values of the zenith angle. The computation assumes here a muon energy threshold of 1 GeV.
The energy spectrum of muons is described Gaisser (1990) by:
dN
d(log10Eµ)
=GEµeβX(1−γ)[Eµ+(1−e−βX)]−γ (15)
whereX=h0/cosθ,γis the spectral index of the primary
CRs and=α/β; α,βare defined in Eq. (6). In the pa-rameterization,γ andwere instead considered as free fit parameters. The constantG=G(γ,)represents a normal-ization factor, in order that the integral over the muon energy spectrum (Eq. 15) from 1 GeV to 500 TeV is equal to 1. In the case of single muon events (bundles withm= 1) a simple dependenceγ=γ(h0)and=(h0,θ)holds.
The situation is more complicated for multiple muons. Due to the muon production kinematics, the muon energy depends on their distance with respect to the axis of the bun-dle. The description of the muon lateral distanceRfrom the axis is thus the preliminary step to evaluate the muon energy distribution in a bundle. R(in the plane orthogonal to the axis) was extracted from a distribution of the form:
dN
dR=C R
(R+R0)α (16)
where R0=R0(h0,m,θ)and α=α(h0,m). The energy
spectrum of muons arriving in bundles has the same gen-Fig. 9. Flux of bundles of muons as a function of their multiplicity
min the bundle obtained with Eq. (14) at the depth of 3 km w.e. and for 5 different values of the zenith angle. The computation assumes here a muon energy threshold of 1 GeV.
The energy spectrum of muons is described by Gaisser (1990):
d N d log10Eµ
=G Eµe
βX(1−γ )h
Eµ+
1−e−βX
i−γ (15) whereX=h0/cosθ,γ is the spectral index of the primary CRs and=α/β;α,βare defined in Eq. (6). In the parame-terisation,γandwere instead considered as free fit param-eters. The constantG=G(γ , )represents a normalisation factor, in order that the integral over the muon energy spec-trum (Eq. 15) from 1 GeV to 500 TeV is equal to 1. In the case of single muon events (bundles withm= 1) a simple de-pendenceγ=γ (h0)and=(h0, θ )holds.
The situation is more complicated for multiple muons. Due to the muon production kinematics, the muon energy depends on their distance with respect to the axis of the bun-dle. The description of the muon lateral distanceRfrom the axis is thus the preliminary step to evaluate the muon energy