Journal of Vol. 1, No.
www.jiems
Custom
the cus
F. Bagheri Abstract Companies’ organization data and dis mining to im each custom calculated R clusters are offers to theKeywords Customer li Received: Ma Revised: Apri Accepted: Jun
1.
Introd
Building m activities. T and Wong, of them ar customers manageme different gr * Correspond 1 Industrial E 2 Industrial Industrial E 1, pp. 43-57s.icms.ac.ir
mer beh
stomer r
1
, M. J. Tar
’ managers n data. Data scover the hi mprove their mer are defin R, F and M ranked base e company to
s
:
Customer ifetime valuearch 2014-13 il 2014-14 ne 2014-25
duction
models and dThe compan , 2004). Dif re likely an and spend ent (CRM)
roups of cu
ding Author. Engineering D Engineering Engineering 7
havior m
relation
rokh*,2
are very en mining is a n idden knowl r customer re ned and extra M values. The
ed on their e o calculate th
r relationshi e, Analytical
decision sup nies spend fferent grou nd others a d resources
decision s stomers (So Department, K. Department, and Manag
mining
nship m
nthusiastic t new and wel ledge and inf elationship m acted. Custom
e best numb eligibility va he premiums ip managem Hierarchy p pport tools considerabl ups of custo are unlikely for them. support too oopramanien
. N. Toosi Un K. N. Toosi
gement Stud
based
anagem
to extract th ll-known tec formation fro management p mers are clus ber of cluste alues. By an and insuran
ment, K-mea process (AHP
are very us le amount o
mers have d y to be prof
This purpo ols, which n and Juan,
iversity of Te i University
dies
on RFM
ment
he hidden a hnique, whic om customer processes. In stered by usi ers is calcula nalyzing the nce charges.
ans clusterin P).
seful to incr of their reco different ch fitable. Com ose is achi
helps com 2010). chnology, Teh of Technolog
M mod
and valuable ch can be im rs' behaviors n this paper Ring K-mean ated by Dav
clustering re
ng algorithm
rease the inv ourses to ac haracteristic
mpanies ye eved with mpanies to
hran, Iran, ftm gy, Tehran, I
del to im
e knowledge mplemented o s. Organizati R, F, and M v
algorithm ba vies Bouldin esults, we pr
m, RFM mo
vestment on chieve this
s and behav earn to retai customer r differentiat
mh.bagheri@g Iran, mjtarok
mprove
Journal of Industrial Engineering and Management Studies (JIEMS), Vol. 1, No. 1 Page 44 CRM targets are: collection of useful data of customers, offering the collected data to departments of organizations that need them, discovering the customers’ values, and also implementing new operations that increase the customers’ loyalty (Helfert and Heinrich, 2003). CRM helps the organizations in several scopes such as finding, acquiring, and retaining the customers.
Benefits of competitive conditions include not only the products and services, but also contain the profitable customer identification, and the creation of close and long relationships with customers (Lee and Park, 2005). This relationship is based on the mutual profit and trust. Under these conditions, companies must try to present particular and customized products and services from each possible channel (Payne and Frow, 2004). To obtain these positions, organizations consider the customer relationship management (CRM) as one of their most important business strategies. The organizations integrate some factors in different parts of businesses and relation points of customers and then, conduct them into specific strategy (Lee and Park, 2005). The factors are thoughts, techniques, and also tools of sales, marketing, and services. Recently, most of well-known companies have utilized the abilities of the CRM for development and increment of their market and customers (Lin et al., 2006). This situation converts the CRM into a valuable business. Primitive goals of CRM are: 1) creation of a long and profitable relationship with the selected customers, 2) reducing distances from these customers in each step of the relationship, 3) maximizing the proportion of the company in customers' purses (Choya et al., 2002).
Managers are interested to discover hidden reliable and real knowledge from their big database and use this knowledge to increase their companies’ profits. A suitable approach to achieve this purpose is the data mining. The most important purposes of using the data mining methods are: cost reduction, improving customer satisfaction and market share, and improving organizational effectiveness (Bayam et al., 2005). The data mining includes two groups of techniques: rule-based and basic techniques. Decision tree, fuzzy logic, genetic algorithm, inductive learning system, and statistical methods are some rule-based methods. Clustering, classification, regression analysis, association rules, and sequence analysis are the methods that are in the basic scope (Witten and Frank, 2005). There are many articles under the heading of segmentation modeling which have used the statistical methods and data mining approaches to classify different groups of customers (Soopramanien and Juan, 2010). Some researches were done in the field of the insurance strategies and its customers. In a research, Blows et al. examined the association between car crash injuries and uninsured motor vehicles. Their study provides new evidence, which is uninsured motorists compared to insured motorists, have higher risks, which being injured or killed in car crashes (Blows et al., 2003). Šubelj et al. proposed a novel expert system approach to detect groups of collaborating automobile insurance fraudsters with networks (Šubelj et al. 2011).
Liao et al. proposed an approach to segment market and demand chain analysis on life insurance market for new product development and marketing. They used the a priori algorithm and clustering analysis for data mining to extract knowledge (Liao et al., 2009).
According the literature of the works in insurance industry, there are several areas such as classification, underwriting, pricing and so on, which are potential applications for using fuzzy logic (FL) (Shapiro, 2004).
Companies are trying to execute models and build decision support tools to improve marketing activities (Gui and Wong, 2004).
Customers in various groups have different values. CRM decision support tools help companies to differentiate between valuable and low-value customers. Companies want to retain and spend recourses for valuable and profitable customers (Soopramanien and Juan, 2010). Organizations use the CRM for acquiring and retaining customers, increasing value, loyalty, and retention of customers, and also executing customer-based strategies. CRM improves the relationship with customers by analyzing customers’ transaction data (Peppard, 2000).
(Kotler, 1994; Peppers and Rogers, 1996). This result obviously shows the importance of existing close and good relationships with current customers.
Minami and Dawson proposed a model which indicates a direct effect of CRM on financial outcome and indirect effect of loyalty marketing.
In 1996, Fayyad et al. had explained the knowledge discovery in databases (KDD). The purpose of the KDD is the identification of valid, novel, useful, and understandable patterns in data (Fayyad et al., 1996; Fayyad, 1997). The KDD consists of several steps such as selection, preprocessing, transformation, data mining, and evaluation. Summarization, predictive modeling, clustering, segmentation/classification, and link analysis are five data mining approachs (Peacock Peter, 1998). These techniques help the analysis of understanding or visualization of very big datasets (Liao and Chen, 2004).
Data mining is a new technique which can gain knowledge and also extract patterns, association, changes, and structures from very big databases (Liao et al., 2008).
Determining a group of valuable customers’ needs to apply a value analysis method to customers’ data (Cheng and Chen, 2009).
Usually, customer lifetime value (CLV) is used to recognize the profitable customers and develop strategies for target customers (Irvin, 1994). Many researches have been performed to calculate customer value based on customer lifetime value (Hyunseok et al., 2004). One of the important methods to consider and assess CLV is the RFM measuring (Liu and Shih, 2005).
The RFM model proposed with Kaymak is one of the customer value analysis methods. This model uses some customers’ behavior criteria and extracts characteristics of customers (Kaymak, 2001). Furthermore, RFM model can measure the power of the customer relationship [27]. Hughest proposed a RFM analytic model to distinguish valuable customers from a huge dataset. RFM has three attributes: Recency, Frequency, and Monetary (Hughes, 1994).
Goodman, in his method, diverted resources to more valuable customers by using RFM and focusing on less profitable customers (Goodman, 1992). Hughest used RFM model to cluster customers into five groups. Various groups have different marketing strategies (Hughes, 1994). Cheng and Chen proposed an approach by using RFM values, k-means algorithm and rough set theory to extract mining rules (Cheng and Chen, 2009). Stone offered that RFM variables should have different weights depending on the characteristic of the industry (Stone, 1995).
Analytical hierarchy process (AHP) is one of the methods that are used to set the weights of decision making criteria.
Liu and Shih developed a novel product recommendation methodology based on customer lifetime values. In this method, they combined AHP and data mining techniques. Clustering technique was used to segment the customer value according to the RFM characteristics. They used analytical hierarchy process to determine the relative weight of RFM variables (Liu and Shih, 2005).
Journal of In
2.
Metho
2.1 RFM In this pap define R (R request of recompens requesting) (later purch In our appl other word large numb purchasing a policyho lower valu In car body from the in sequence, recompens costs to the
ndustrial Engin
odology
M definition per, the new
Recency) a f the policy se when an
) in this ind hasing trans lication, F ( ds, higher fr ber of accid g frequency older reques ue of F is mo y insurance, nsurance co M (Moneta ses that the e company.
neering and M n in car bod w definitions
as the amou yholder. In accident oc dustry is sup
saction) is b (Frequency) requency sh dents in an of a custom sts recompe ore desirabl
, policyhold ompany, the
ary) is defi company h . Just like th
Management S
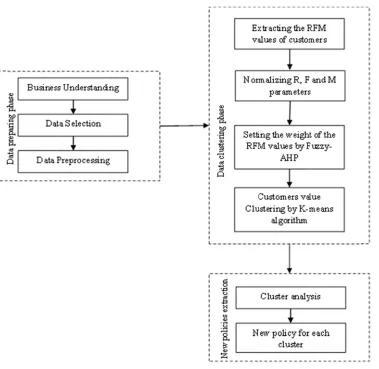
Figure 1
dy insuran s of R, F, a unt of time n the car b ccurs for his
perior, unlik better.
) is the freq hows the po insurance p mer. Hence,
ense, it imp e.
ders must pa e company s fined equal has paid to he purchasi
tudies (JIEMS
1: the researc
ce
and M in ca gap betwee body insura s/her car. Th ke the purc
quency of th olicyholder
period. F in , a high freq poses a fin
ay the prem should pay t
to the prem a policyho ng transacti
S), Vol. 1, No
ch model
ar body insu en a specifi
ance indust herefore, a l chase transa
he recompe is not a goo n the cases quency is d nancial cost
mium for the the recomp mium amo older. Large
ion in whic
o. 1
urance indu c time and try, a polic longer recen actions in w
nse request od customer
of purchas esirable. In t to the com
eir car. If the ense to them unt minus er monetary ch, a higher
ustry are pro the latest r cyholder re ncy (older r which a shor
ts of a polic r because h sing transac our applica mpany. The
ey request r m. With res the summa y values im monetary ( Page 46 oposed. We recompense equests the recompense rter recency cyholder. In he/she had a tions is the ation, when erefore, the
purchasing amount) is better and causes more profit for a company, in our application, larger monetary values are more desirable.
With respect to the above definitions, a policyholder with higher R and M values and lower F value in a period of time is a valuable customer for an insurance company.
2.2 Setting the weights of the RFM values
There are some methods to obtain the importance and weight of each decision making criterion in a problem. For the first time, the AHP was proposed by Saaty (1980) to evaluate alternative technologies. This method enables companies to combine all criteria in one model and allows them to assess the weight of each criterion.
Traditional AHP scores alternatives by crisp and particular values. General analytical hierarchy process needs an accurate verdict. Because of complexities and non-pragmatisms in real world, some criteria in the decision-making process are qualitative; therefore these criteria are not well-described by crisp values. Consequently, sometimes assembling accurate, actual and non-possible verdicts are required.
The judgments of several experts are required to assess the criteria. The perception of each expert about a specific score is different from another person. Hence, it would be comfortable for experts to give their opinions in linguistic variables such as high, medium, or low. A Fuzzy value describe opinions more accurately.
Therefore, allowing the decision makers to use linguistic dictions and Fuzzy verdicts is more natural and pragmatic in comparisons processes (Wang et al., 2006). With this regard, it seems the combination of AHP and Fuzzy theory in this study causes better results. In this paper, Fuzzy Analytical Hierarchy Process is used to determine the relative importance (weights) of RFM variables, wR, wF, and wM.
In this study, Chang (1996) method is preferred to obtain the weights of the RFM criteria. Chang’s extent analysis on Fuzzy AHP depending on the degree of possibilities of each criterion. According to the responses in the question form written by experts, the answers of each person should be entered in pair-wise comparison matrix to form Fuzzy triangular values (a, b, c). Aczel and Saaty showed the geometric mean is the best method to assimilate judgments in the group analytical hierarchy process (Aczel and Saaty, 1983). Therefore, the geometric mean is used to calculate the group judgments matrix and used as the latest Mi(ai, bi, ci) set for criterion Mi in the rest of the process.
According to the Chang’s (1992) method, the extent analysis for each criterion, gi; is performed. Therefore, m extent analysis values for each criterion can be calculated by using following notation (Kahraman et al., 2004): 1 2 3 4
, , , ,...,
i i i i i m
g g g g g
M M M M M
Where gi is the goal set (i = 1, 2, 3, 4, 5, ...n) and all the i j g
M
j (j = 1, 2, 3, 4, 5,..., m) are Triangular Fuzzy Numbers (TFNs). The steps of Chang’s analysis method is explained as follows: Step 1: The value of Fuzzy synthetic extent for the i-th object is defined as:
= ∑ ⊗ ∑ ∑ (1)
To obtain ∑ , the Fuzzy addition operation of m extent analysis values for a particular matrix will be performed as:
∑ = ∑ , ∑ , ∑ (2)
And to acquire ∑ ∑ , the Fuzzy addition operation is executed as:
∑ ∑ = ∑ ∑ , ∑ ∑ , ∑ ∑ (3)
Journal of Industrial Engineering and Management Studies (JIEMS), Vol. 1, No. 1 Page 48
∑ ∑ = ∑ ∑ ,∑ ∑ ,∑ ∑ (4)
Step 2: The degree of possibility of M2 = (a2, b2, c2) ≥M1 = (a1, b1, c1) is defined as:
( ≥ ) = [ ( ), ( ) (5)
and can be equivalently expressed as follows:
( ≥ ) = ℎ ( ∩ ) = ( )
1 ≥
( ) ( ) ℎ
0 ≥
(6)
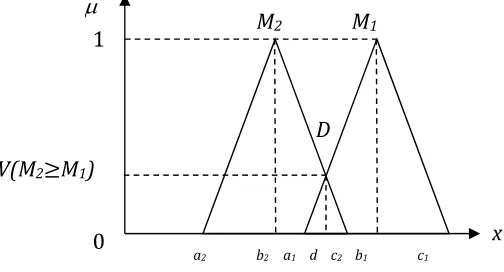
where d is the coordinate of the point which has the highest membership value in the intersection between and (see Figure 2).
To compare M1 and M2, both the values of ( ≥ ) and ( ≥ ) are required to be
computed.
Step 3: The possibility degree for a convex Fuzzy number to be greater than other convex Fuzzy numbers Mi(i = 1, 2, . . ., k) can be calculated as follows:
( ≥ , , … , ) (7)
= [( ≥ ) ( ≥ ), … , ( ≥ )
= ( ≥ ), = 1,2, … , Assume that,
( ) = ( ≥ ) = 1, 2, . . . , ; ≠ (8)
Then the weight factor is given by
= ( ′( ), ′( ), ′( ), … , ′( )) (9)
Where ( = 1,2, . . . , ) are n elements.
Step 4: After normalization the previous vector, the normalized weight vectors are calculated: W = (d(A ), d(A ), … , d(A )) (10) Where W is a set of non-Fuzzy numbers.
2.3 RFM normalization and weighting
Since R, F, and M are non-homogeneous parameters, the customers’ RFM values should be normalized. According to the effects of the parameters on a customer value, two normalization
M2 M1
a2 b2 a1 d c2 b1 c1 0
1
D
V(M2≥M1)
Figure 2: The intersection between M1 and M2
forms, profit and cost forms, as given respectively in equations (11) and (12) are used. Since R and M have positive effects on the customer value, the profit form is used to normalize the M (monetary) and R (Recency) values. F has a negative impact on the customer value. Therefore, the cost form is used to normalize the F (frequency) value (Liu, Shih, 2005).
= ( − )/( − ) (11)
= ( − )/( − ) (12)
where and are original and normalized values, respectively. and are respectively the smallest and the largest values of X.
After the RFM normalization, the normalized RFM values are multiplied by the corresponding weights, , and which are calculated by Fuzzy AHP method.
2.4 Customer clustering by using k-means algorithm
Clustering is a process that can categorize a large number of objects. Ideally, after clustering, objects in the same group are similar to each other and different from the objects in other groups. In our application, customers are clustered by using k-means algorithm. K-means is one of the clustering methods and purposed by Forgy (Forgy, 1965). The algorithm of k-means is presented as follows:
1) Specifying K objects for cluster centers.
2) Assigning all objects to these groups based on their distances from the cluster centers. An object is assigned to the cluster whose center is the closest cluster center to the object.
3) Updating the cluster centers. After assigning new objects to a cluster or devote to another cluster, the new center of the corresponding cluster is computed.
4) Repeating step 2 and 3 until no more reassigning.
Clustering is performed based on WNR (weighted normalized R), WNF (weighted normalized F), and WNM(weighted normalized M) of the customers.
2.5 Determining the best cluster number
Some clustering methods require the number of clusters and the primary cluster centers. In this methods, determining the number of clusters are very important to gain the best clustering result. Since the k-mean algorithm that is used in this paper require number of clusters, we should determine the best value of this parameter.
Two main characteristics of the well-separated clusters are the large distances among different clusters and the small diameters of the clusters (Halkidi et al., 2002). Several validity indices have been introduced to measure “goodness” of a clustering result comparing to other results obtained with different number of clusters.
We use the Davies Bouldin index to determine the best number of clusters. The definition of Davies Bouldin index is represented as follows:
= ∑ max ( )( , )( ) (13)
where ℎ( ) = ∑ ∈ ( , ) and ( , ) = ( , ). Ci is the i-th cluster, ci is the center of
i-th cluster and nc is the number of clusters. dist(x,y) is the distance between two data elements.
2.6 Cluster Ranking
Journal of Industrial Engineering and Management Studies (JIEMS), Vol. 1, No. 1 Page 50
= + + (14)
where , and are the weighted normalized R, F, and M values of the i-th cluster center, respectively. is defined as the eligibility of the i-th cluster. Clusters are ranked with respect to the computed eligibility values.
2.7 Assign a policyholder to a cluster
According to the current policy of the Iranian insurance companies, a policyholder can retain his/her discounts until he/she insured his/her car in the same company. In other words, if a customer changes his/her insurance company, he/she must pay the complete premium and no discounts are given to him/her in the first year.
In this paper, we offer to the companies to give discount even to the costumers who were not insured their cars in their company. In this way if a customer decides to insure his/her car in our company having his/her previous manner or profile in the other insurance company, we will give suitable discounts to him/her. Hence, we need a method to assign the new customer into one of the obtained clusters. This proposed method is described as follows:
For the first time, R, F, and M values of the new customer are taken from his/her previous manner or profile in the past insurance company. These parameters should be normalized as follows:
∗= ∗ (15)
∗ = ∗ (16)
∗= ∗ (17)
These normalized variables are multiplied by the corresponding weights ( ∗, ∗, ∗). Then, the distance between the customer’s parameters and each cluster center should be
calculated. The minimum distance determines the cluster which the customer belongs to. The Euclidean distance measure is used to calculate the distances.
= ( ∗− ) + ( ∗− ) + ( ∗− ) (18)
Minimum distance between the customers weighted and normalized profile variables and the clusters' centers determines the customer’s cluster. The index of the customer's cluster is obtained as follows:
= {min } (19)
After determining the customer's cluster, the rules policies which have been set for this cluster are implemented on the customer. In other words, the discount is calculated based on the determined cluster for the customer.
3.
Experimental evaluation
For evaluating the proposed method, we use one actual database in an Iranian insurance company. Initial data includes information about the customers such as age, gender, and etc., information of the insured car such as age, number of cylinders, the city that the car is driven in and etc., and also the number of accidents which occurred in the insurance time, and other information.
The company that we used its database uses its own data just for reporting and archiving. Therefore, this database had poor organization for data mining use. Thus, the preprocessing phase was very time consuming. The gotten experience is very helpful to improving the company’s database structure for extra using.
fields in both English and Farsi, or assigning two names to a specific model of car, and so on. Finally, a corrected an integrated database has been made.
R, F, and M values of each customer are calculated and normalized.
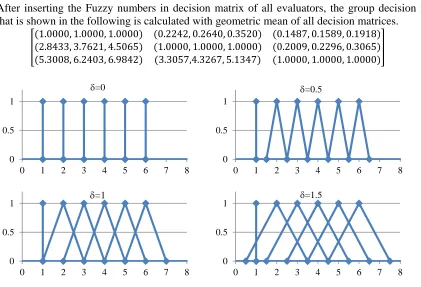
Two groups of evaluators (three managers in issuance policy section and three managers in damage section in the car insurance department of the under consideration insurance company) were invited to evaluate the relative importance of the RFM variables. Interviews data were gathered using a pair-wise comparisons questionnaire which is shown in Table 1. Figure 3 shows some variables of Fuzzy variables. As shown in this figure, for =0 to =0.5, consecutive Fuzzy numbers have no intersection. Therefore, the fuzziness has not been considered for 0.5. The significance of fuzziness occurs when 0.5. As shown in figure 3 for 1, the Fuzzy numbers, which are not consecutive, have intersections. This is not desirable. Therefore, suitable range of for Fuzzy numbers is 0.51. In this paper, the value of is considered equal to 1 (=1).
Table 1: AHP questionnaire for RFM
Lof
ty
V
er
y
Importan
t
Importa
n
t
No
t Very
Importa
n
t
Equal
No
t Very
Importa
n
t
Importa
n
t
V
er
y
Importan
t
Lof
ty
F R
M R
M F
After inserting the Fuzzy numbers in decision matrix of all evaluators, the group decision matrix that is shown in the following is calculated with geometric mean of all decision matrices.
(1.0000, 1.0000, 1.0000) (0.2242, 0.2640, 0.3520) (0.1487, 0.1589, 0.1918) (2.8433, 3.7621, 4.5065) (1.0000, 1.0000, 1.0000) (0.2009, 0.2296, 0.3065) (5.3008, 6.2403, 6.9842) (3.3057,4.3267, 5.1347) (1.0000, 1.0000, 1.0000)
Figure 3: some variables of Fuzzy numbers
Then, the Fuzzy AHP method is done to calculate the weights of R, F, and M variables with considering this group decision matrix. These weights in under considering department of insurance
0 0.5 1
0 1 2 3 4 5 6 7 8
=0
0 0.5 1
0 1 2 3 4 5 6 7 8
=0.5
0 0.5 1
0 1 2 3 4 5 6 7 8
=1
0 0.5 1
0 1 2 3 4 5 6 7 8
Journal of Industrial Engineering and Management Studies (JIEMS), Vol. 1, No. 1 Page 52 company are obtained equal to 0, 0.3139 and 0.6861 for R, F, and M, respectively (wR=0,
wF=0.3139, wM=0.6861).
The weighted normalized RFM values are ready to be clustered by k-mean clustering method. To obtain the best number of clusters, we should cluster data with various numbers of clusters. The best number of clusters is calculated by using the Davies Bouldin index.
The largest value of D determines the best clustering configuration. This index is calculated for different numbers of clusters and the results are represented in Figure 4. According to these results, the best number of clusters is obtained equal to eight clusters.
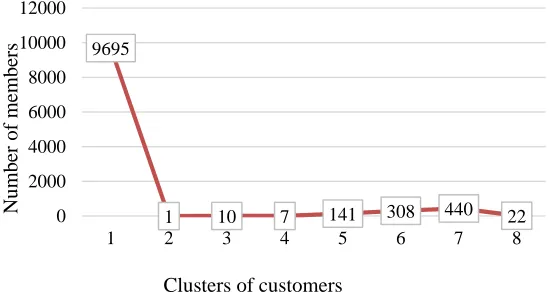
The number of members for each cluster is shown in Figure 5. The second cluster includes only one member. The reason is that, this customer impose very large cost (monetary) to the company rather than other customers.
Figure 4: The results of Davies Bouldin index for different cluster numbers
Figure 5: Clusters of customers
The weighted normalized values of R, F, and M parameters of the cluster centers are given in Table 2. Furthermore, computed eligibility values of the clusters are shown in Table 2. Higher value of this criterion indicates that the corresponding cluster is more valuable. The clusters are ranked based on these eligibility values.
According to the results given in the last column of Table 2, it can be deduced that the first cluster is the most valuable and profitable cluster. Moreover, the second cluster is the worst cluster according to its least eligibility value among all clusters.
0 0.1 0.2 0.3 0.4 0.5 0.6 0.7 0.8
3 4 5 6 7 8 9
D
avi
es B
oul
din
inde
x
Number of Clusters
9695
1 10 7 141 308 440 22
0 2000 4000 6000 8000 10000 12000
1 2 3 4 5 6 7 8
Clusters of customers
Nu
mber
of
member
Table 2: Clusters characteristics
Cluster CFi CMi Qi Cluster rank
K1 0.307 0.683 0.99 1
K2 0.314 0 0.314 8 K3 0.067 0.664 0.731 6
K4 0.211 0.462 0.673 7
K5 0.167 0.668 0.835 4 K6 0.312 0.645 0.957 2 K7 0.224 0.674 0.898 3 K8 0.302 0.473 0.775 5
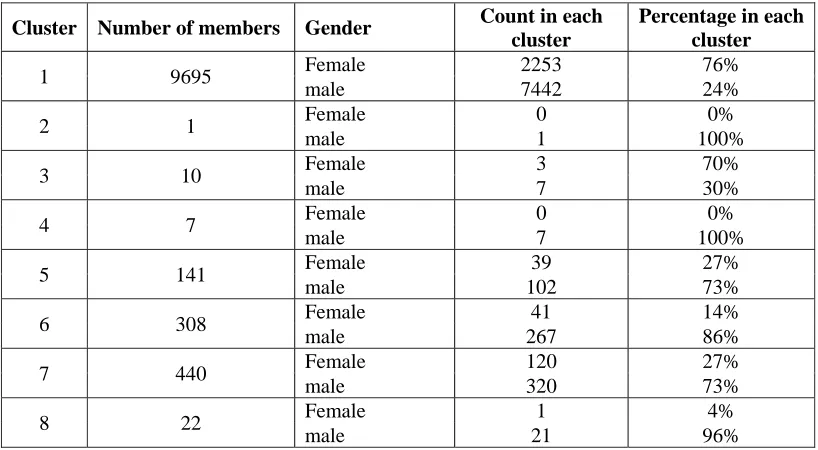
Our experiments show that the values of the clusters are independent to the gender and age of the customers. Table 3 and 4 respectively show different categories of genders and ages of the customers in different clusters. It can be observed that in each of these two tables, the ratios between different genders or ages in various clusters are approximately equal.
As an example, in Table 3, in populous clusters, about 77% of the customers are male and the rests (about 23%) are female. It demonstrates the independency of the clusters' eligibilities to the customers' genders. Similar results are obtained for the customers' ages. Hence, we find that the policies of discount calculation should be independent to the genders and ages of the customers.
Table 3: Distribution of customer genders in clusters
Cluster Number of members Gender Count in each cluster
Percentage in each cluster
1 9695 Female 2253 76%
male 7442 24%
2 1 Female 0 0%
male 1 100%
3 10 Female 3 70%
male 7 30%
4 7 Female 0 0%
male 7 100%
5 141 Female 39 27%
male 102 73%
6 308 Female 41 14%
male 267 86%
7 440 Female 120 27%
male 320 73%
8 22 Female 1 4%
Journal of Industrial Engineering and Management Studies (JIEMS), Vol. 1, No. 1 Page 54
Table 4: Distribution of different customers' age categories in clusters
Cluster Teen Young Middle Adult Old
1 72
0.7%
1386 14%
2922 30%
4487 46%
828 8.5%
2 0 0 0 1
100% 0
3 0 0 3
30%
5 50%
2 20%
4 0 2
28%
2 28%
2 28%
1 14%
5 3
2%
20 14%
45 32%
64 45%
9 6%
6 3
0.9%
40 13%
108 35%
132 43%
25 8%
7 3
0.6%
77 17.5%
121 27.5%
206 47%
33 7.5%
8 0 2
9%
5 23%
11 50%
4 18%
Many of the insurance companies calculate the car body insurance premium with respect to the insured automobile price. For more expensive cars, the premium is greater. The period of insurance premium charge is one year. The companies consider some discounts for their reinsured policyholders. They compute the premium recharging amount for a customer not only with considering the price of the car, but also its insurance history in the company.
For reinsurance the body of car at the beginning of the second year, if the customer did not have any car accident in the first year, company grants 25% discount in the recharging amount of the second year. If his/her good history repeats in continuous years, discount amounts will be increased. Maximum discount amount is 60% of the first premium amount. Once an accident occurs, even with small damages, and if the customer requests the recompense from the insurance company, his/her discount is completely canceled for the next year.
This policy is equal in all Iranian insurance companies. Large companies such as the under consideration company with large number of customers and very big and helpful dataset, can improve satisfaction and loyalty of their customers with a little changes in their policies and programs. Customers' satisfaction is the best advertisement for acquiring new customers.
As discussed, the discount amount depends on the latest request of a customer for receiving the recompense. It means that the policy of companies is programmed only based on the customer recency. In this paper, we propose new approach to change this strategy by clustering customers based on their R, F, and M values.
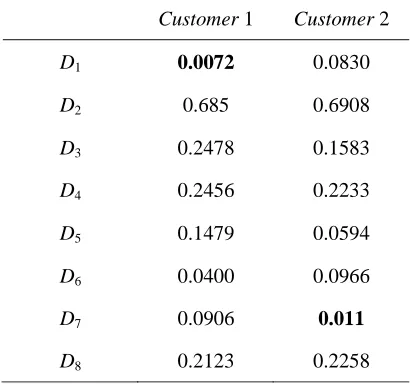
Therefore, if a customer of another insurance company decides to insure his/her car in our company, we give suitable discounts to him/her with respect to the cluster that he/she is assigned to it. Therefore, the customer’s cluster must be determined at the first time. The discount calculation for two instant customers is given as follows.
Table 5: The characteristics of two example new customers
*
R F* M*
Customer 1 507 1 1873000
Customer 2 268 3 2312000
Table 6: The normalized characteristics of two example new customers
*
NR NF* NM*
Customer 1 0.781 1 0.999
Customer 2 0.407 0.714 0.996
Table 7: The weighted normalized characteristics of two example new customers
* R
w NR w NFF *
* M
w NM
Customer 1 0 0.314 0.685
Customer 2 0 0.224 0.685
Table 8: The distances between two new customers and all clusters centers
Customer 1 Customer 2
D1 0.0072 0.0830
D2 0.685 0.6908
D3 0.2478 0.1583
D4 0.2456 0.2233
D5 0.1479 0.0594
D6 0.0400 0.0966
D7 0.0906 0.011
D8 0.2123 0.2258
4.
Conclusion
In this paper, an approach is proposed to improve the customers' satisfaction and also the profits of the insurance company. In our proposed approach, the premium in the car body insurance industry can be calculated based on the customer lifetime value. The discounts should be calculate based on the latest recompense requesting date, total amounts of the paid recompense to the customer, and also the number of customer's accidents. We use RFM method to evaluate the customer lifetime value. The Fuzzy Analytical Hierarchy Process (Fuzzy AHP) is applied to determine the relative weights of RFM variables. K-means method is used to cluster the customers based on their weighted RFM normalized values. The best clustering result is obtained with 8 clusters. Davies Bouldin index is used to calculate the best number of clusters.
Journal of Industrial Engineering and Management Studies (JIEMS), Vol. 1, No. 1 Page 56
References
1. Aczel, J., Saaty, T. 1983. “Procedure for Synthesizing Ratio Judgments”, Journal of mathematical psychology, 27, 93-102.
2. Bayam, E., Liebowitz, J., Agresti, W. 2005. “Older drivers and accidents: A meta analysis and data
mining application on traffic accident data”, Expert Systems with Applications 29, 598–629.
3. Blows S., Ivers, R.Q. , Connor, J., Ameratunga, S., Norton, R. 2003. “Car insurance and the risk of car
crash injury”, Accident Analysis and Prevention 35, 987–990.
4. Chang, D. Y. 1996. “Applications of The Extent Analysis Method on Fuzzy-AHP”, European Journal of Operational Research, 95, 649-655.
5. Chang, D. Y. 1992. “Extent Analysis and Synthetic Decision”, Optimization Techniques and Applications, World Scientific, Singapore, 1, 352.
6. Cheng, C.H., Chen, Y.S. 2009. “Classifying the segmentation of customer value via RFM model and RS
theory”, Expert Systems with Applications 36, 4176–4184.
7. Choya, K.L., Lee, W.B., Lo, V. 2002. “Development of a case based intelligent customer-supplier
relationship management system”, International Journal of Expert system with Application 23(3),
281-297.
8. Fayyad, U., Piatetsky-Shapiro, G., Smyth, P. 1996. “From data mining to knowledge discovery in
database”. American Association for Artificial Intelligence, 37–54.
9. Fayyad, U. 1997. “Data mining and knowledge discovery in databases: implications for scientific
databases”. In proceedings of the ninth international conference on Scientific and statistical database
management, 2–11.
10. Forgy, E.W. 1965. “Cluster analysis of multivariate data: efficiency vs interpretability of
classifications”, Biometrics 21, 768–769.
11. Goodman, J. 1992. “Leveraging the customer database to your competitive Advantage”, Direct Marketing 55 (8), 26–27.
12. Gui, G., Wong, M.L. 2004. “Implementing neural networks for decision support in direct marketing”, International Journal of Market Research 46 (2), 235–254.
13. Halkidi, M., Batistakis, Y., and Vazirgiannis, M. 2002. “Cluster validity methods: part II”, SIGMOD Rec., Vol. 31, No. 3, 19-27.
14. Helfert, M., Heinrich, B. 2003. “Analyzing Data Quality Investments in CRM- A model based
Approach”, School of computing.
15. Hughes, A.M. 1994. “Strategic Database Marketing”, Probus Publishing, Chicago.
16. Hyunseok, H., Jung, T., Suh, E. 2004. “An LTV model and customer segmentation based on customer
value: a case study on the wireless telecommunication industry”, Expert Systems with Applications 26,
181–188.
17. Irvin, S. 1994. “Using lifetime value analysis for selecting new customers”, Credit World 82 (3), pp. 37– 40.
18. Kahraman, C., Cebeci, U., and Da, R. 2004. “Multi-Criterion Comparison of Catering Service
Companies Using Fuzzy AHP: The Case of Turkey”, International Journal of Production Economics, 87,
171-184.
19. Kaymak, U. 2001. “Fuzzy target selection using RFM variables”. in Proceedings of IFSA World congress and 20th NAFIPS international conference 2, 1038–1043.
20. Kevork, E.K., Vrechopoulos, A.P. 2009. “CRM literature: Conceptual and functional insights by
keyword analysis”. Marketing Intelligence and Planning, 27(1), (), 48–85.
21. Kotler, P. 1994. “Marketing management: Analysis, planning, implementation, and control”. New Jersey: Prentice-Hall.
22. Lee, J.H., Park, S.C. 2005. “Intelligent profitable customers segmentation system based on business
intelligence tools”, Expert system with Applications 29, 145-152.
23. Liao, S.H., Chen, Y.J. 2004. “Mining customer knowledge for electronic catalog marketing”. Expert Systems with Applications, 27(2), 521–532.
24. Liao, S.H., Chen, C.M., Wu, C. H. 2008. “Mining customer knowledge for product line and brand
extension in retailing”. Expert Systems with Applications, 35(3), 1763–1776.
25. Liao, S.H., Chen, Y., Tseng, Y.Y. 2009. “Mining demand chain knowledge of life insurance market for
26. Lin, Y., Su, H.Y., Chien, S. 2006. “A knowledge-enabled procedure for customer relationship
management”, Industrial Marketing Management 35, 446-456.
27. Liu, D.R., Shih, Y.Y. 2005. “Integrating AHP and data mining for product recommendation based on
customer lifetime value”, Information & Management 42, 387–400.
28. Peacock Peter, R. 1998,”Data mining in marketing: Part 1”. Marketing Management, 9–18.
29. Peppard, J. 2000. “Customer relationship management (CRM) in financial services”, European Management Journal, 18(3), 312–327.
30. Peppers, D., Rogers, M. 1996. “The one to one future: Building relationships one customer at a time”. NY: Doubleday.
31. Saaty, T.L. 1980. “The analytic Hierarchy process, Planning, Priority, Resources Allocation”, RWS Publication, USA.
32. Shapiro, A.F. 2004. “Fuzzy logic in insurance”, Insurance: Mathematics and Economics 35 () 399–424. 33. Soopramanien, D., Juan, L. H. 2010. “The importance of understanding the exchange context when
developing a decision support tool to target prospective customers of business insurance”, Journal of
Retailing and Consumer Services 17, 306–312.
34. Stone, B, 1995. “Successful Direct Marketing Methods”, Lincolnwood, NTC Business Books, IL. 35. Šubelj, L., Furlan, S., Bajecl, M. 2011. “An expert system for detecting automobile insurance fraud
using social network analysis”, Expert Systems with Applications 38, 1039–1052.
36. Wang, Y.M., Elhag, T.M.S., Hua, Z. 2006. “A Modified Fuzzy Logarithmic Least Squares Method for
Fuzzy Analytic Hierarchy Process”, Fuzzy sets and Systems 157, 3055-3071.