Construction Materials
and Technologies
J Sustain. Construct. Mater. Technol. 1(1) (2016) 29–35 www.eds.yildiz.edu.tr/jscmtDust analyses in ventilation ducts
Karolina Vyhlidalova
1, a, *,Petr Vlček
1, bOlga Rubinová
1,c, and Jiří Bernard
1, d1Department of building services, Brno University of technology, Faculty of civil engineering,
Czech Republic
a[email protected], b[email protected], c[email protected], d[email protected]
Received January 5, 2016, accepted February 23, 2016
Abstract
The paper describes the importance of monitoring the dust in the atmosphere of human life. It deals with the issue of dust in air ducts, approaching the methods that can be used to detect the amount of dust. For conditions for buildings in the Czech Republic there is created the methodology of quantitative and qualitative evaluation of dust sediment for the needs of HVAC and other building surfaces. The scale for visual evaluation was created and it has been elaborated the assessment of kind of particles contained in dust.
Keywords: Dust, ventilation, public building, health, duct;
Introduction
1.
Dust, health and technical equipmentDust, i.e. solid particles suspended in the air, is in a reasonable amount of natural part of the environment. Whether industrial human activity or associated with transportation and housing the amount of dust in the air increases and also changing its composition. Essential is the amount of particles in the air, because it is directly inhaled entering the airways. Settled dust is not insignificant as well, because due to the movement of air it can be returned back into the atmosphere. Dust in residential premises also contains biological components, which can be a breeding ground for mold and microbes occurring in the current environment.
Health has a major impact:
•
The concentration of aerosol in the air, expressed as the amount of particulate matter per unit volume of air [μg/m3] for common residential rooms of buildings. In the environment with high demands on cleanlinessthere is evaluated dustiness by the amount of dust particles in the various different sizes per unit volume of air.
•
The chemical composition of aerosol. If the dust does not have specific biological effects and acts just dusty lungs, we are talking about dust biologically inert. Metallic dust is serious and its study is the subject of much research [4], [5] and conjecture of environmental activists [3]. The major source of dust particles in indoor with outdoor pollution which it penetrated inside the mechanical and natural ventilation systems (air proximity), and the Activities of people (soil proximity). The indoor dust contains, characteristic for the urban areas, spherical magnetic particles Originating from fossil fuel combustion processes, and Mixture of irregular angular grains of iron-oxides containing other elements, Including Na, Ca, Al, Si, K, S, Mn, Cl, and Mg. The latter particles are very common in the street dust and Thea derived from vehicles via exhaust Emissions from engines and from the abrasion and corrosion of vehicles body work. However, citizens spend most of their time inside closed spaces (homes, offices, apartments, schools, etc.) and the dust settled indoor is an important source of secondary pollution of air we breathe in closed spaces. Due to the serious long-term influence of heavy metals on* Corresponding author: Karolina Vyhlidalova. E-mail address: [email protected]
the human health, it is important to know the composition of the pollutants and a manner of their transport inside the indoor environment. The human immune system recognizes biological hazards (bacteria and viruses) and has natural mechanisms to control them. However, the immune system cannot fight with the heavy metals which penetrate into a human body (by the respiratory system, gastrointestinal tract, skin) and accumulate in the organs. [4]
•
The size of dust particles, which affects their penetration into the airways. Particles larger than 100 microns have relatively little medical significance, because thanks to their considerable weight they quickly settle. For this reason, it is very limited their interactions with other pollutants in the air. Dust particles of size up to 10 microns are referred to as an aerosol. The weight of their content in the air is relatively small. They have great biological significance. They are inhaled by humans, but for the most part are already trapped in the upper airways. Here they settles in a film of mucus, which is moved by cilia toward the nasopharynx and ultimately to its swallowing. If these particles are among the toxic dust by its chemical nature, their swallowing has significant medical importance. Particles smaller than 10 microns are in the air in small amounts, but are of great biological importance. For 24 hours up to 0.01 g particles reach the respiratory tract. Molecules with size 1-2 micron penetrate bronchioles to the alveoli, where they are captured sometimes more than in 90 %. These particles are therefore most dangerous in terms of retention of the aerosol in the lungs. Contrarily, particles smaller than 0.01 microns start to behave as gaseous molecules in the lungs and they are largely exhaled. [2]•
Physical properties, namely wettability, crystal structure and morphology of the dust, i.e. the shape of inhaled particles. E.g. research conducted among residents of the Sahara showed that although the dust raised by the wind is mostly pure silica, there wasn't found in the exposed population the silicosis. These findings were explained that silica dust from deserts, and hence its particles are mainly spherical due to prolonged abrasion and only freshly formed particles characterized by edges, spikes and acicular structures may create binding to lung tissue [2]. The shape, size and color are also the attributes which allow distinguish the type and source of the particles.Outside of the effects of dust on the human organism, we can also monitor their degradation effect. Impact of the dust depends on its origin or species. The abrasive effect is s clear example. The abrasive effect of dust can be traced at abrasion of masts and bridge decks. Although the issue is more concerned with desert areas, on a smaller scale it can be observed in our conditions, while seizing fine mechanics with sensitive instruments, or magnetic recording media damage. Other degradation effects of dust are then its chemical effects such as corrosive effects, increased moisture absorption due to the hygroscopic dust, or oils oxygenation, due to the fact that the dust carries oxygen. Last but not least there are the effects of sedimentation, which are for us easily visible. They cause deterioration of heat dissipation, blockage of ventilation ducts and clogging of contacts, which can lead to unreliable switching of devices. [8]
control procedure in category P1 proved to be a useful and effective tool for preventing dust accumulation in new air ducts during the construction process.
2. Dust in air ducts
Function of HVAC equipment is to create a healthy indoor environment in buildings. Nevertheless, service experience says that in today's hectic pace of building construction vent pipe is installed before the completion of construction work and because of its inconsistent protection it is already significantly contaminated by dust during commissioning. [6] reported the results of monitoring the cleanliness of pipeline in 18 new buildings:
In the ducts installed according to the requirements of cleanliness category P1 the mean amount of accumulated dust was 0.9 g/m2 (0.4- 2.9 g/m2), and in the ducts installed according to the cleanliness category P2
it was 2.3 g/m2 (1.2-4.9 g/m2). A significant difference was found in the mean amounts of dust between ducts of
categories P1 and P2 (P < 0.008). The cleanliness
3. Measurement for dust accumulation in air duct
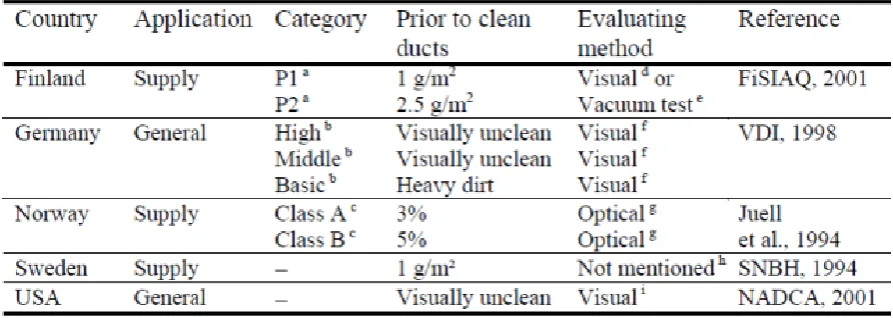
Table 1. Limit values for dust accumulation in newly installed air ducts and air handling systems. [7]
Categories:
a cleanliness categories b cleanliness levels c cleanliness class
levels Evaluating methods:
d Visual inspection with a reference scale as the primary method (Narvanne et al., 2002) e Vacuum test (FiSIAQ-test 2) (Pasanen, 1999)
f Requirements for specific categories (A and B) and training to inspectors before they are authorised to
inspection work (VDI, 1999)
g Optical method with gelatine tapes (Schneider et al., 1996)
h Requirements for specific qualification (classes K and N) and experience to inspectors before they are
authorised to inspection work
i Requirements for qualification and experience to inspectors before they are authorised to inspection work For the evaluation of dust must be considered the difference between the dust that has settled on surfaces and dust that is still present and flies in the air. Nowadays there are a number of measuring devices and procedures to determine both the value of the amount of dust. For evaluation of dustiness, that is the amount and concentration of dust in air, can be used any of the methods of fallout dust or dust sedimentation. In examining the fallout the similar procedure as in the evaluation of atmospheric precipitation is used. Method of sedimentation is then used in dusty atmospheres and it assesses the amount of dust deposited per unit of time. Other methods are conimetric and gravimetric methods which utilize various complex measuring instruments.
From the viewpoint of air ducts it is rather a problem of dust build-up in pipes, especially in fittings and bends. Measurement of settled dust is therefore fundamental. This subject is studied by many experts worldwide, so there are already a number of measurement methods. We distinguish measurement procedures for the analysis of cleaned pipe, and thus the quality of cleaning and further methods for uncleaned distributions, which can be considered due to the need for cleaning. The most commonly used methods for assessing the dust deposited in the pipeline is based on a gravimetric analysis of mass on given area. In the gravimetrical vacuum test method the dust is sucked from a standardized area on a pre-weighed filter with the aid of a vacuum pump.
With this method, we can easily analyze the composition of the dust. Another method is gravimetric tape method, in which dust is collected by means of pipes predefined tape of known surface area and weight. This method has limitations in the amount of dust that tape can accommodate, but this can solve multiple use of tapes and their sum. Thanks to sufficient accuracy and great ease of the method, this tape method is used within our work. Other methods for assessing dust are used for sophisticated devices. These are various optical methods that assess the beam scattering due to reflection from dust particles. The amount of dust comes out of the percent loss of light through the contaminated tape. Other devices are based on the electromagnetic measurements of the distance from the surface dust to the sheet metal. These devices therefore assess the thickness of deposit dust. [9]
Methods
•
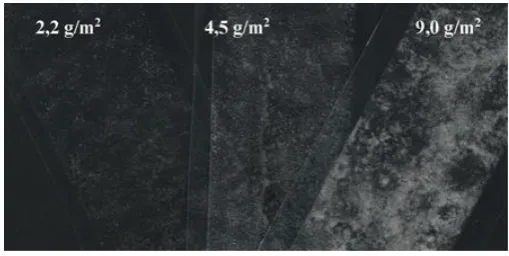
Determination of the amount of dust in the pipeline (or other arbitrary surface) on a scale which corresponds to the current building practice. The scale used abroad in [10] must be extended so that it can be classified also a thick dust layer on the pipe in various stages of assembly. This allows evaluation of improvement after cleaning mounted, but still incomplete, duct. The scale was modified from 2 to 9 g/m2.Samples are taken in a transparent adhesive tape and stick to plain paper. This is also stored and can therefore be taken any number of flat and curved surfaces of pipes, air-handling unit and end elements. Evaluation is carried out by visual comparison with the ethalon. The Ethalon consists of three particle sizes to suit different granularity and real quantity of dust was weighed with accurate weights. Thanks to safekeeping of samples it is possible to prove the success of cleaning the piping before assembling, or cleanliness of piping which will be during the construction already inaccessible.
•
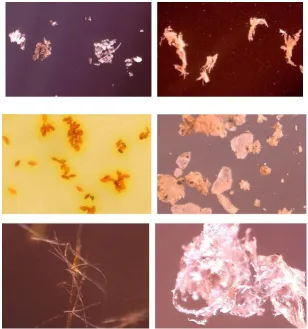
Analysis of the particulates by electron microscope, where it is possible to identify the basic types of dust according to the shape and color of the particles. This makes it possible to identify the source of particles. We distinguish four types of particles - grains of sand or plaster, sawdust, wood chips and fiber insulation. This corresponds to resources during construction activities - particles derived from masonry, concrete, plaster or wood structures, metal filings as waste of drilling or editing pipe or fibrous insulation pipe itself or insulated building structures - from walls and ceilings. Furthermore, it is possible to identify larger organic particles, e.g. pollen grains. Sample preparation is easily accomplished by distribution on the paper and fixation with adhesive tapeOn Fig. 1 and 2 there are shown for visual evaluation swatches of particles in two different sizes - 5 μm for the fine particles and 25 μm for the coarse particles. Most of the particles occur in clusters, as naturally behave during deposition on surfaces. Differences in logarithmic scale are obvious to the naked eye and sediments can thus be classified. Dust from construction site responds to the larger grain size, fine dust corresponding to residues from grinding drywall, or clogging during operation. A similar method chosen by [10]. Visual evaluation of dust below 1 g / m2 is already difficult because the structure of galvanized sheet creates masking
background for light dust.
Figure 1 - Ethalon 2,2; 4,5 a 9,0 g/m2; ground coffee material, particles 15 to 40 μm, median 25μm
Figure 3 - Examples of samples of solid particles which can be identified at a magnification of 1: 100 to 1: 150
Sawdust metallic (left), wooden (right)
Pollen (left), sand (right)
Insulation fiber (left) elastomer - rubber (right)
Results
Currently, the verification measurement of dust deposits is under way on a number of completed buildings in Brno. From these measurements directly during construction it is seen that even when the buildings categorized into several classes of cleanliness (low <0.9 g / m2, mean <0.6 g / m2 and a high <0.3 g / m2 according to [10]),
Collections of dust from the interior surfaces of piping after mounting on buildings show that the classification categories of cleanliness are inadequate. There weren't exceptional cases where class boundaries have been exceeded tenfold, as seen from the graph on the Fig. 4. Examples of such results are seen in the Fig. 5.
Figure 4 - Amount of dust in the duct during installation (lines Requirement [10])
Figure 5 - Example of dust sample on red paper (macrophoto) - sample 1
From these results it is clear that the lack of compliance procedures to maintain clean pipes, pipes must be then cleaned. However, cleaning of ventilation duct is not easy, because it cannot be simply rinsed with water, (is not waterproof), and so it is necessary to use methods of mechanical brushing alternatively cleaning with compressed air. In normal situation, if the pipe is fitted with a silencer, flaps, baffles and regulatory components of the end elements, it is not only technically very complicated, but in most cases it is unrealistic thanks to the inaccessibility.
Conclusions
Air-handling systems should be a tool for creating a healthy indoor environment and improving air quality. Pressure to speed up construction time makes that the assembly of ducts takes place before the completion of construction. Air-conditioning pipe is so heavily exposed to dusty air that it is contaminated in amounts significantly higher than the standard set [10]. Effective cleaning of distributions upon completion of building construction is quite unrealistic. More than ever there is the prevention effective, i.e. regular inspection during the construction process. Our method is very suitable for this purpose, because it allows in two steps: visually evaluated settled dust and take the samples by low-cost method in large quantities at arbitrary intervals and archived them; then allows identify the major components of dust and thus recognize the main source of contamination.
Acknowledgements
References
1. Frankel, M., Timm, M., Hansen, E. W. and Madsen, A. M. (2012), Comparison of sampling methods for the assessment of indoor microbial exposure. Indoor Air, 22: 405-414. doi: 10.1111/j .1600-0668.2012.00770.x.
2. Wikiskripta; Imise [online] dostupné z http://www.wikiskripta.eu/index.php/imise
3. Blogspot [online] dostupné z http://orgo-net.blogspot.cz/2011/03/vysledky-rozboru- kovoveho-prachu.html
4. Górka-Kostrubiec B., Jelenskal M., Król E. Magnetic signature of indoor air pollution: Household dust study; Acta Geophysica. Volume 62, Issue 6, Pages 1478-1503, ISSN (Online) 1895-7455, DOI: 10.2478/s11600-014-0238-1, September 2014.
5. Górka-Kostrubiec B.; The magnetic properties of indoor dust fractions as markers of air pollution inside buildings, Building and Environment, Volume 90, August 2015, Pages 186-195, ISSN 0360-1323. 6. Holopainen, R., Tuomainen, M., Asikainen, V., Pasanen, P., Sateri, J. and Seppanen, O. (2002), The
effect of cleanliness control during installation work on the amount of accumulated dust in ducts of new HVAC installations. Indoor Air, 12: 191-197. doi: 10.1034/j .1600-0668.2002.01119.x.
7. Holopainen, R.; Dust in ventilation ducts: accumulation, measurement and removal;
8. Dissertation for the degree of Doctor of Science in Technology; Helsinki University of Technology, 2004; ISBN 951-22-6976-7 (PDF format).
9. FELD, Martin. Degradační působení prachu [online]. In: . [cit. 2015-06-24]. Dostupné z: http://martin.feld.cvut.cz/~kudlacek/EKP/11_prach.pdf
10. Holopainen, R.; The Field Comparison of Three Measuring Techniques for Evaluation of the Surface Dust Level in Ventilation Ducts. Indoor Air: International Journal of Indoor Air Quality and Climate. Copenhagen: Munksgaard International Publishers Ltd, 2002, (12): 47¬54. ISSN 0905-6947.
11. ČSN EN 15780:2012 - Ventilation for buildings - Ductwork - Cleanliness of ventilation systems. 12. Kuznetsov S., Scott E. H., Paulos E.; A low-tech sensing system for particulate pollution; 8th
![Figure 4 - Amount of dust in the duct during installation (lines Requirement [10])](https://thumb-us.123doks.com/thumbv2/123dok_us/8959233.1868601/6.595.72.268.308.454/figure-dust-duct-installation-lines-requirement.webp)
