►Additional material is published online only. To view please visit the journal online (http:// dx. doi. org/ 10. 1136/ openhrt- 2018- 000975). To cite: Farquharson B, Abhyankar P, Smith K, et al. Reducing delay in patients with acute coronary syndrome and other time-critical conditions: a systematic review to identify the behaviour change techniques associated with effective interventions. Open Heart 2019;6:e000975. doi:10.1136/ openhrt-2018-000975
Received 21 November 2018 Accepted 21 November 2018
For numbered affiliations see end of article.
Correspondence to Dr Barbara Farquharson; b. farquharson@ napier. ac. uk
Reducing delay in patients with acute
coronary syndrome and other
time-critical conditions: a systematic review
to identify the behaviour change
techniques associated with
effective interventions
Barbara Farquharson,1 Purva Abhyankar,2 Karen Smith,3 Stephan U Dombrowski,4
Shaun Treweek,5 Nadine Dougall,1 Brian Williams,1 Marie Johnston6
© Author(s) (or their employer(s)) 2019. Re-use permitted under CC BY-NC. No commercial re-use. See rights and permissions. Published by BMJ.
AbstrAct
Background Time to treatment in many conditions,
particularly acute coronary syndrome, is critical to reducing mortality. Delay between onset of symptoms and treatment remains a worldwide problem. Reducing patient delay has been particularly challenging. Embedding behaviour change techniques (BCTs) within interventions might lead to shorter delay.
Objective To identify which BCTs are associated
with reductions in patient delay among people with symptoms or conditions where time to treatment is critical.
Methods The data sources were Cochrane Library,
MEDLINE, EMBASE, Cumulative Index to Nursing and Allied Health Literature, and PsycINFO. Study eligibility criteria include intervention evaluations (randomised controlled trials, controlled clinical trials and cohort studies) involving adults (aged >18 years) and including an outcome measure of patient delay up to August 2016. Study appraisal and synthesis methods include screening potential studies using a transparent, replicable process. Study characteristics, outcomes and BCTs were extracted from eligible studies.
Results From 39 studies (200 538 participants),
just over half (n=20) reported a significant reduction in delay. 19 BCTs were identified, plus 5 additional techniques, with a mean of 2 (SD=2.3) BCTs and 2 (SD=0.7) per intervention. No clear pattern between BCTs and effectiveness was found. In studies examining patient delay specifically, three of four studies that included two or more BCTs, in addition to the two most commonly used additional techniques, reported a significant reduction in delay.
Conclusions Around half of the interventions to reduce
prehospital delay with time-critical symptoms report a significant reduction in delay time. It is not clear what differentiates effective from non-effective interventions, although in relation to patient delay particularly additional use of BCTs might be helpful.
Trial registration number CRD42014013106.
InTROduCTIOn
It has long been recognised that time to treatment in acute coronary syndrome (ACS) is critical to reducing mortality.1 Contemporary healthcare systems and path-ways are designed to facilitate immediate
Key questions
What is already known about this subject?
► Patient delay with symptoms of time-critical condi-tions like acute coronary syndrome (ACS) remains a worldwide problem.
► Interventions to reduce delay have had mixed results.
► Embedding behaviour change techniques (BCTs) within interventions might be important in relation to effectiveness.
What does this study add?
► This systematic review has found that only half of the interventions to reduce prehospital delay with time-critical symptoms report significantly reduced delay times.
► It is unclear what differentiates effective from non-effective interventions.
► However, some limited evidence suggests that ad-ditional use of BCTs might be helpful in reducing patient delay in particular.
How might this impact on clinical practice?
► Our results suggest that the development of in-terventions that incorporate more BCTs might be a promising next step in addressing the important and long-standing problem of patient delay with time-critical symptoms.
► If interventions could be developed that successfully reduce patient delay, they have the potential to sig-nificantly reduce mortality and morbidity from ACS and other time-critical conditions.
on September 12, 2020 by guest. Protected by copyright.
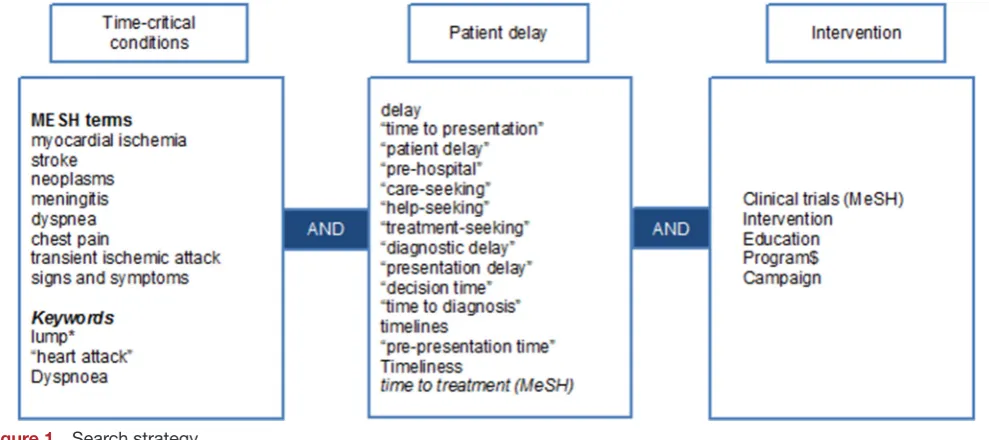
Figure 1 Search strategy.
assessment and care where ACS is suspected.2 This often includes an emergency telephone service, rapid response by paramedic, transfer to hospital by ambu-lance, immediate triage, and prompt initiation of reperfusion treatments such as percutaneous coro-nary intervention or thrombolysis.3 4 Much has been achieved and continues to be achieved by improving emergency care services. Mortality from cardiovascular disease has declined dramatically in the last 30 years in the UK5 and other high-income countries,6 with 8% of the reduction attributed to initial treatment of acute myocardial infarction.7 European registry data show continuing improvements in hospital reperfusion times as well as reduced mortality for people with ACS.8
Despite the achievements in emergency care, delays between onset of symptoms and receipt of treatment persist.9 Recently, an Irish study10 reported median delay times of more than 7 hours in their control group. The largest interval in pretreatment time has been identified as ‘patient decision time’.11 Patient deci-sion time (often referred to as ‘patient delay’) refers to the interval between onset of symptoms and seeking medical help and has proved much more challenging to reduce than other components of delay, such as transportation and hospital delays, also referred to as utilisation delay.12 However, if reductions in patient delay could be achieved, they offer the potential to lead to significant reductions in mortality for ACS.13
A number of interventions aimed at reducing patient delay times for ACS have been trialled, but to date the pattern of results is mixed. A systematic review which focused on mass media interventions to reduce delay concluded that they had little success in changing behaviour.14 More recently, an alternative strategy of intensive, targeted interventions for people at high risk of ACS (those with existing coronary heart disease) has been trialled in the USA15 and Ireland.10 The two interventions were strikingly similar, both described
as comprising an individualised, one-on-one session of approximately 30–40 min with the patient and signif-icant other, with a 15 min follow-up phone call. Both studies cite Leventhal’s theory of self-regulation as the underlying theoretical framework and provide informa-tion about symptoms, instrucinforma-tions of how and when to call for help, anticipate and plan for possible emotional responses, involve significant others, encourage signif-icant others to deputise in the event of symptoms, and provide written instructions for participants to take away. However while Mooney et al10 found a significant difference postintervention between the intervention and the control group, Dracup et al15 did not. Given that two very similar interventions produced very different results, it is yet to be determined what the effective components of an intervention to reduce patient delay are.
There is evidence to suggest that embedding evidence-based behaviour change techniques (BCTs) (eg, goal-setting, action planning)16 within interven-tions is more likely to lead to successful behaviour change. For example, an intervention using established BCTs has been effective in reducing patients’ intended delay time with symptoms of lung cancer, another time-sensitive condition.17 18 The publication of the Behaviour Change Techniques Taxonomy V.1 (BCTT V.1)19 provides an opportunity to systematically examine previous interventions to establish which specific BCTs are associated with effective interventions, but to date this has not been undertaken in the context of inter-ventions to reduce patient delay with symptoms of ACS. Patient delay is critical for a range of time-critical conditions, including but not limited to ACS.20 Given that patient perceptions of symptoms guide patient delay, rather than clinician subsequent diagnoses, we examined interventions that target patient recognition and response to acute conditions to maximise learning from the available literature.
on September 12, 2020 by guest. Protected by copyright.
Table1 Skewness of patient delay time data in studies that reported means and SD
Study Mean SD SD ×2
Likely skewness
Before and after studies
Addo et al66 B 374 512 1024 Skewed
A 296.8 356.3 712.6 Diercks et
al56 B 232 271.3 542.6 Skewed
A 224 257.9 515.8
Naegeli et
al63 B 247 248.4 496.8 Skewed
A 223.3 229.8 459.6 Wolters et
al51 B 810 4176 8352 Skewed
A 318 1146 2292
Controlled studies Dracup et
al15 I 257.4 20.40 40.8 Not skewed
C 304.8 41.4 82.8
Luepker et
al31 I 130.2 8.25 16.5 Not skewed
C 304.8 41.40 82.8
Sun et al37 I 498 348 696 Skewed
C 630 390 780
B-before A-after i-Intervention c- control
Therefore this paper reports the results of a system-atic review which for the first time aimed to identify which BCTs are associated with effective interventions to reduce patient delay (or prompt rapid help-seeking) among people with symptoms or conditions where time to treatment is critical.
MeTHOds
Protocol and registration
In line with best practice,21 a review protocol was published in 201420 and registered with the PROS-PERO International prospective register of systematic reviews based at the University of York and can be accessed through the following website: http://www. crd. york. ac. uk/ PROSPERO/ display_ record. asp? ID= CRD42014013106.
eligibility criteria
Studies were included if they met the following inclusion criteria:
Types of study
Any intervention study (including randomised controlled trials [RCTs], controlled clinical trials and cohort studies) which includes an outcome measure of patient delay/time to presentation with symptoms (ie, behaviour).
Types of participants
Adults (>18 years) with symptoms or conditions where time to treatment is critical (ie, timing of presentation has a demonstrated effect on mortality).
Types of interventions
Any intervention where the stated aim was to reduce patient delay/time to presentation to health services (eg, patient education intervention or multimedia public health campaign).
Types of outcome measure
To be included, studies had to include a measure of patient delay time (ie, interval between the onset of symptoms and seeking medical help), which is the primary outcome of interest in this review. The following secondary outcomes were also examined: intentions to seek help without delay, number and type of presentations with symptoms (general practitioner [GP], hospital, ambulance), and number of deaths and adverse events.
Papers were excluded if they did not report a primary empirical study of an intervention (ie, reviews, edito-rials, opinion pieces, commentaries, letters to editors, papers describing intervention), did not include a measure of prehospital delay and only included partici-pants <18 years. Studies were not excluded on the basis of language or year of publication.
Information sources and search strategy
A comprehensive search strategy was developed to identify primary studies evaluating interventions aimed at reducing patient delay. Five electronic databases— Cochrane Library, MEDLINE, EMBASE, Cumulative Index to Nursing and Allied Health Literature, and PsycINFO and the National Research Register (NRR)— were searched independently for publications from inception of each database to 1 August 2016. The search strategy combined terms related to time-critical condi-tions and patient delay with the AND operator. A third term related to intervention was combined by AND with the above terms to narrow down the search and limit it to studies reporting on an intervention. Both index terms (ie, medical subject headings/subject headings/ thesaurus) and free-text keywords were used. The full search strategy is presented in figure 1. The database searches were supplemented with searches through the following other sources: (1) reference lists of all included studies and previous reviews of similar interventions, (2) citations of included studies using three citation index databases (Science Citation Index, Social Sciences Cita-tion Index and Arts, and Humanities CitaCita-tion Index), (3) National Research Register, and (4) email contact with authors of conference abstracts and of studies iden-tified through the National Research Register to obtain details of ongoing, unpublished or recently completed research.
on September 12, 2020 by guest. Protected by copyright.
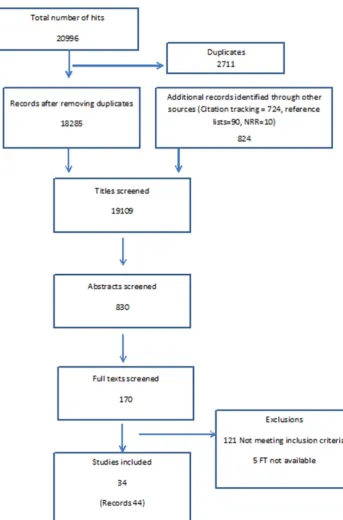
Figure 2 Flow chart of studies screened, excluded and included in review.
study selection
Initial screening of titles was undertaken by one reviewer (PA) to exclude any that were obviously irrelevant. The reliability of this screening was assessed by a second reviewer (BF) independently screening a subset of the titles. The abstracts of studies included from their titles were then screened independently by two reviewers (PA and BF) applying the inclusion/exclusion criteria. Full texts of the studies that were considered potentially rele-vant by either reviewer were screened independently by the same reviewers. At the full-text screening stage, any disagreements between the reviewers over inclusion or
exclusion were resolved by seeking independent opinion from a third reviewer (SUD). A similar process was applied to the screening of records identified from cita-tion tracking. Studies identified from the reference lists of included studies, previous reviews of similar interven-tions, author contact and the National Research Register were screened first by abstract and then by full text inde-pendently by the two reviewers (PA and BF).
Assessment of methodological quality and risk of bias
Methodological quality of the included studies was assessed using the EPHPP Quality Assessment Tool for
on September 12, 2020 by guest. Protected by copyright.
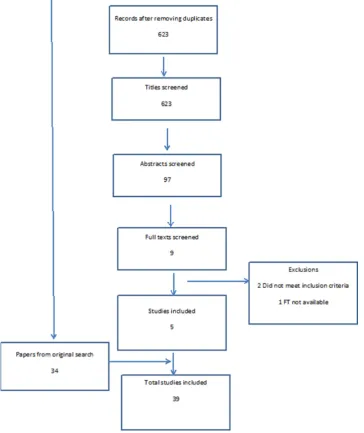
Figure 3 Update literature search.
Quantitative Studies developed by the Effective Public Health Practice Project (EPHPP), Canada.22 This tool was chosen as it enables assessment of multiple quanti-tative study designs on a comprehensive set of criteria and is recommended by the Cochrane Handbook for use in reviews of public health and health promotion inter-ventions that use a variety of study designs.23 It enables a rating of strong, moderate or weak on six methodological dimensions that assess the risk of bias: selection bias, allo-cation bias, control of confounders, blinding of outcome assessors, data collection methods, and withdrawals and dropouts. Ratings on these dimensions feed into a global rating. The tool provides two additional questions, not involved in the global rating, one assesses intervention integrity and the other appropriateness of analysis. The tool has been demonstrated to have content and construct validity and test–retest reliability.24 Using this tool, the included studies were independently assessed by
two reviewers (PA and SUD) for methodological quality, with discrepancies being resolved through discussion.
data extraction
Data extraction was performed by one team member (PA) on all studies in English and a German-speaking team member (SUD) on the studies in German. Studies in Norwegian and Swedish were translated by a native Norwegian-Swedish speaker. Guided by the Consolidated Standards of Reporting Trials25 and the Template for Intervention Description and Replication26 guidelines, a data extraction form was developed in MS Excel, piloted on six studies by two reviewers (PA and SUD) and revised to ensure that all essential information was recorded systematically. The form recorded the following informa-tion for each included study: study details (author and date, location, study duration, study age, clinical condi-tion, objectives), study methods (design, number of study
on September 12, 2020 by guest. Protected by copyright.
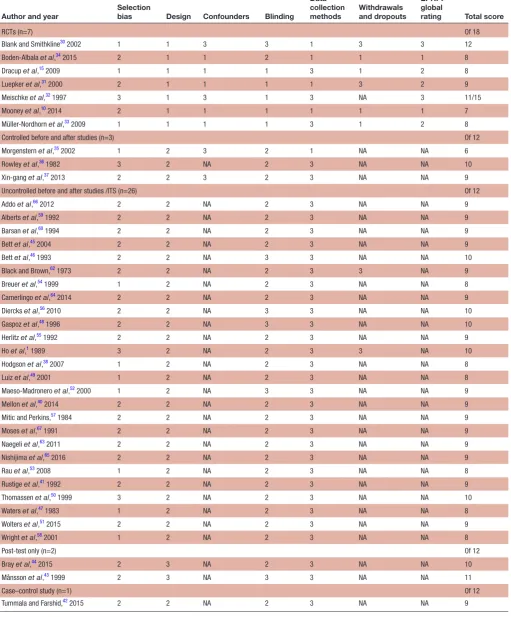
Table 2 Methodological quality ratings for included studies (n=39)
Author and year
Selection
bias Design Confounders Blinding
Data collection methods
Withdrawals and dropouts
EPHPP global
rating Total score
RCTs (n=7) Of 18
Blank and Smithkline30 2002 1 1 3 3 1 3 3 12
Boden-Albala etal,34 2015 2 1 1 2 1 1 1 8
Dracup et al,15 2009 1 1 1 1 3 1 2 8
Luepker et al,31 2000 2 1 1 1 1 3 2 9
Meischke et al,32 1997 3 1 3 1 3 NA 3 11/15
Mooney et al,10 2014 2 1 1 1 1 1 1 7
Müller-Nordhorn et al,33 2009 1 1 1 1 3 1 2 8
Controlled before and after studies (n=3) Of 12
Morgenstern et al,35 2002 1 2 3 2 1 NA NA 6
Rowley et al,36 1982 3 2 NA 2 3 NA NA 10
Xin-gang et al,37 2013 2 2 3 2 3 NA NA 9
Uncontrolled before and after studies /ITS (n=26) Of 12
Addo et al,66 2012 2 2 NA 2 3 NA NA 9
Alberts et al,59 1992 2 2 NA 2 3 NA NA 9
Barsan et al,60 1994 2 2 NA 2 3 NA NA 9
Bett et al,45 2004 2 2 NA 2 3 NA NA 9
Bett et al,46 1993 2 2 NA 3 3 NA NA 10
Black and Brown,62 1973 2 2 NA 2 3 3 NA 9
Breuer et al,54 1999 1 2 NA 2 3 NA NA 8
Camerlingo et al,64 2014 2 2 NA 2 3 NA NA 9
Diercks et al,56 2010 2 2 NA 3 3 NA NA 10
Gaspoz et al,48 1996 2 2 NA 3 3 NA NA 10
Herlitz et al,55 1992 2 2 NA 2 3 NA NA 9
Ho et al,1 1989 3 2 NA 2 3 3 NA 10
Hodgson et al,38 2007 1 2 NA 2 3 NA NA 8
Luiz et al,49 2001 1 2 NA 2 3 NA NA 8
Maeso-Madronero et al,52 2000 1 2 NA 3 3 NA NA 9
Mellon et al,40 2014 2 2 NA 2 3 NA NA 9
Mitic and Perkins,57 1984 2 2 NA 2 3 NA NA 9
Moses et al,67 1991 2 2 NA 2 3 NA NA 9
Naegeli et al,63 2011 2 2 NA 2 3 NA NA 9
Nishijima et al,65 2016 2 2 NA 2 3 NA NA 9
Rau et al,53 2008 1 2 NA 2 3 NA NA 8
Rustige et al,41 1992 2 2 NA 2 3 NA NA 9
Thomassen et al,50 1999 3 2 NA 2 3 NA NA 10
Waters et al,47 1983 1 2 NA 2 3 NA NA 8
Wolters et al,51 2015 2 2 NA 2 3 NA NA 9
Wright et al,58 2001 1 2 NA 2 3 NA NA 8
Post-test only (n=2) Of 12
Bray et al,44 2015 2 3 NA 2 3 NA NA 10
Månsson et al,43 1999 2 3 NA 3 3 NA NA 11
Case–control study (n=1) Of 12
Tummala and Farshid,42 2015 2 2 NA 2 3 NA NA 9
As the global rating, following EPHPP guidelines, could not be calculated for studies with non-randomised designs, we also calculated a sum total of the ratings across all dimensions that were applicable to the study design. This total score ranges from 6 to 18 if all six dimensions are applicable and from 4 to 12 if only four dimensions are applicable. Lower scores suggest better overall methodological quality and higher scores suggest poorer quality.
EPHPP, Effective Public Health Practice Project; ITS, interrupted time series; NA, not applicable; RCTs, randomised controlled trials.
on September 12, 2020 by guest. Protected by copyright.
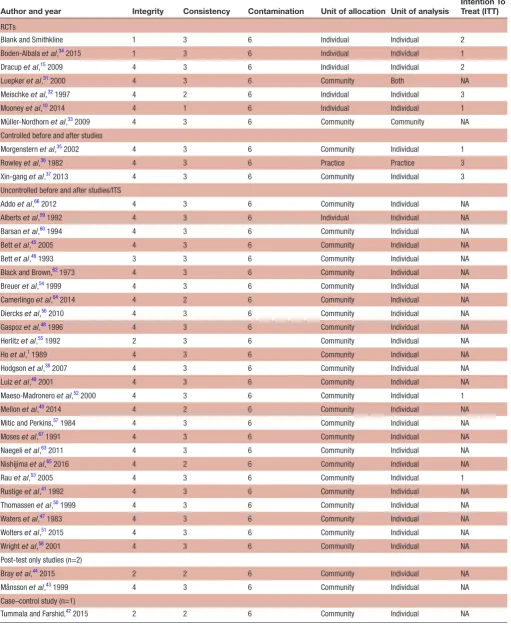
Table 3 Intervention integrity and consistency ratings for included studies (n=39)
Author and year Integrity Consistency Contamination Unit of allocation Unit of analysis
Intention To Treat (ITT)
RCTs
Blank and Smithkline 1 3 6 Individual Individual 2
Boden-Albala et al,34 2015 1 3 6 Individual Individual 1
Dracup et al,15 2009 4 3 6 Individual Individual 2
Luepker et al,31 2000 4 3 6 Community Both NA
Meischke et al,32 1997 4 2 6 Individual Individual 3
Mooney et al,10 2014 4 1 6 Individual Individual 1
Müller-Nordhorn et al,33 2009 4 3 6 Community Community NA
Controlled before and after studies
Morgenstern et al,35 2002 4 3 6 Community Individual 1
Rowley et al,36 1982 4 3 6 Practice Practice 3
Xin-gang et al,37 2013 4 3 6 Community Individual 3
Uncontrolled before and after studies/ITS
Addo et al,66 2012 4 3 6 Community Individual NA
Alberts et al,59 1992 4 3 6 Individual Individual NA
Barsan et al,60 1994 4 3 6 Community Individual NA
Bett et al,45 2005 4 3 6 Community Individual NA
Bett et al,46 1993 3 3 6 Community Individual NA
Black and Brown,62 1973 4 3 6 Community Individual NA
Breuer et al,54 1999 4 3 6 Community Individual NA
Camerlingo et al,64 2014 4 2 6 Community Individual NA
Diercks et al,56 2010 4 3 6 Community Individual NA
Gaspoz et al,48 1996 4 3 6 Community Individual NA
Herlitz et al,55 1992 2 3 6 Community Individual NA
Ho et al,1 1989 4 3 6 Community Individual NA
Hodgson et al,38 2007 4 3 6 Community Individual NA
Luiz et al,49 2001 4 3 6 Community Individual NA
Maeso-Madronero et al,52 2000 4 3 6 Community Individual 1
Mellon et al,40 2014 4 2 6 Community Individual NA
Mitic and Perkins,57 1984 4 3 6 Community Individual NA
Moses et al,67 1991 4 3 6 Community Individual NA
Naegeli et al,63 2011 4 3 6 Community Individual NA
Nishijima et al,65 2016 4 2 6 Community Individual NA
Rau et al,53 2005 4 3 6 Community Individual 1
Rustige et al,41 1992 4 3 6 Community Individual NA
Thomassen et al,50 1999 4 3 6 Community Individual NA
Waters et al,47 1983 4 3 6 Community Individual NA
Wolters et al,51 2015 4 3 6 Community Individual NA
Wright et al,58 2001 4 3 6 Community Individual NA
Post-test only studies (n=2)
Bray et al,44 2015 2 2 6 Community Individual NA
Månsson et al,43 1999 4 3 6 Community Individual NA
Case–control study (n=1)
Tummala and Farshid,42 2015 2 2 6 Community Individual NA
ITS, interrupted time series; ITT, intention to treat; NA, not available.
on September 12, 2020 by guest. Protected by copyright.
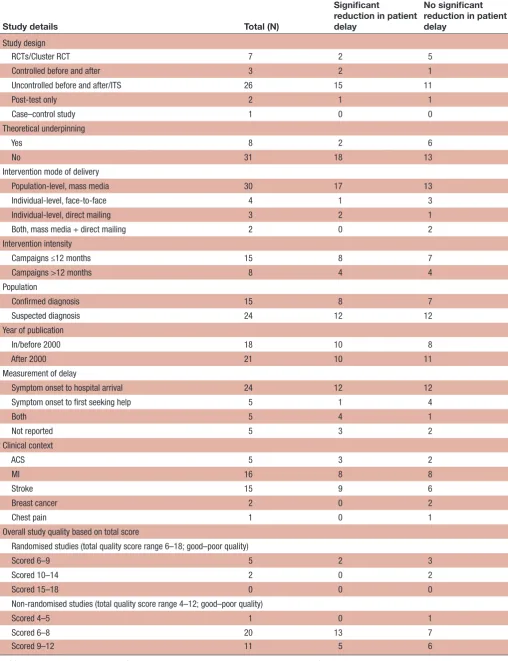
Table 4 Summary table of study and intervention characteristics associated with effectiveness of interventions aimed at reducing patient delay
Study details Total (N)
Significant
reduction in patient delay
No significant reduction in patient delay
Study design
RCTs/Cluster RCT 7 2 5
Controlled before and after 3 2 1
Uncontrolled before and after/ITS 26 15 11
Post-test only 2 1 1
Case–control study 1 0 0
Theoretical underpinning
Yes 8 2 6
No 31 18 13
Intervention mode of delivery
Population-level, mass media 30 17 13
Individual-level, face-to-face 4 1 3
Individual-level, direct mailing 3 2 1
Both, mass media + direct mailing 2 0 2
Intervention intensity
Campaigns ≤12 months 15 8 7
Campaigns >12 months 8 4 4
Population
Confirmed diagnosis 15 8 7
Suspected diagnosis 24 12 12
Year of publication
In/before 2000 18 10 8
After 2000 21 10 11
Measurement of delay
Symptom onset to hospital arrival 24 12 12
Symptom onset to first seeking help 5 1 4
Both 5 4 1
Not reported 5 3 2
Clinical context
ACS 5 3 2
MI 16 8 8
Stroke 15 9 6
Breast cancer 2 0 2
Chest pain 1 0 1
Overall study quality based on total score
Randomised studies (total quality score range 6–18; good–poor quality)
Scored 6–9 5 2 3
Scored 10–14 2 0 2
Scored 15–18 0 0 0
Non-randomised studies (total quality score range 4–12; good–poor quality)
Scored 4–5 1 0 1
Scored 6–8 20 13 7
Scored 9–12 11 5 6
ACS, acute coronary syndrome; ITS, interrupted time series; MI, myocardial infarction; RCTs, randomised controlled trials.
on September 12, 2020 by guest. Protected by copyright.
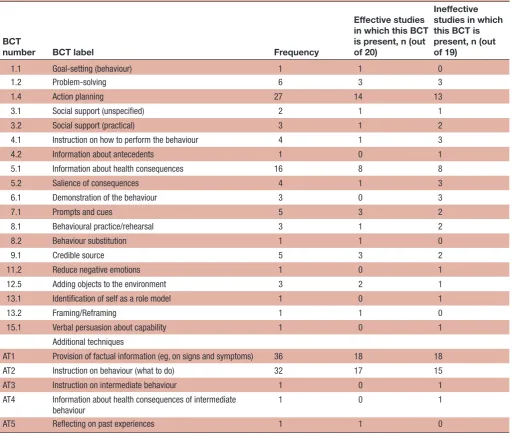
Table 5 Distribution of BCTs among studies of effective and ineffective interventions (n=39)
BCT
number BCT label Frequency
Effective studies in which this BCT is present, n (out of 20)
Ineffective studies in which this BCT is present, n (out of 19)
1.1 Goal-setting (behaviour) 1 1 0
1.2 Problem-solving 6 3 3
1.4 Action planning 27 14 13
3.1 Social support (unspecified) 2 1 1
3.2 Social support (practical) 3 1 2
4.1 Instruction on how to perform the behaviour 4 1 3
4.2 Information about antecedents 1 0 1
5.1 Information about health consequences 16 8 8
5.2 Salience of consequences 4 1 3
6.1 Demonstration of the behaviour 3 0 3
7.1 Prompts and cues 5 3 2
8.1 Behavioural practice/rehearsal 3 1 2
8.2 Behaviour substitution 1 1 0
9.1 Credible source 5 3 2
11.2 Reduce negative emotions 1 0 1
12.5 Adding objects to the environment 3 2 1
13.1 Identification of self as a role model 1 0 1
13.2 Framing/Reframing 1 1 0
15.1 Verbal persuasion about capability 1 0 1
Additional techniques
AT1 Provision of factual information (eg, on signs and symptoms) 36 18 18
AT2 Instruction on behaviour (what to do) 32 17 15
AT3 Instruction on intermediate behaviour 1 0 1
AT4 Information about health consequences of intermediate behaviour
1 0 1
AT5 Reflecting on past experiences 1 1 0
BCTs, behaviour change techniques.
arms, setting, target population, sample size estimation, sample size actual, sampling and recruitment method, outcomes, outcome definition, analysis, dates of recruit-ment), details of intervention and comparison (name, theory, materials, provider, setting, delivery format, intensity, tailoring, modifications, planned and actual fidelity assessment), BCTs included in the intervention and comparison conditions, and study results (partici-pant flow, partici(partici-pant characteristics, results for primary and secondary outcomes, ancillary analysis, adverse outcomes, authors’ conclusion). To assess the feasibility of meta-analysis, data on mean delay time and SDs (for differences in delay times between before and after, or intervention and control) were extracted where avail-able. A third member of the team (BF) independently performed data extraction on a 20% subset of the included studies (n=5) to assess reliability. No discrepan-cies in independently extracted data were found.
Identification of BCTs
To identify the BCTs, descriptions of the interventions were coded using the 93-item BCTT V.1.19 The coding was undertaken independently by two health psycholo-gists (PA and SUD). First, the coding of BCTs was piloted on six intervention descriptions, and any discrepancies were discussed and resolved by realigning interpreta-tions. During this pilot, it became apparent that inter-ventions included techniques that were not listed in BCTT V.1—these were captured as ‘additional techniques’. The two BCT coders agreed on their working labels and definitions for additional techniques prior to coding the remaining studies (see online supplementary appendix 1). Second, BCTT V.1 along with the additional tech-niques was applied to intervention descriptions of all remaining studies (n=34). Of these, 28 studies available in English were dual-coded by two independent reviewers
on September 12, 2020 by guest. Protected by copyright.
Figure 4 BCTs and effectiveness.
Figure 5 Additional techniques and effectiveness.
and six studies in German were single-coded by one reviewer (SUD).
From the first 22 dual-coded studies, a total of 58 discrepancies were observed from 2090 instances of coding. The average kappa and prevalence-adjusted and bias-adjusted kappa (PABAK) scores, calculated for the BCTs identified as present in at least four studies by either reviewer, reflected poor agreement (kappa=0.49, PABAK=0.58). As the level of agreement was poor, the discrepancies were examined to determine if they were random or systematic, that is, one reviewer consistently overcoding/undercoding a specific BCT compared with the other. The systematic discrepancies were discussed in terms of differences in interpretations of BCTs (for action planning, information about health conse-quences, credible source and problem-solving) and resolved through consensus (see online supplementary file appendix 1). With agreed interpretation of defini-tions in mind, both reviewers recoded the intervendefini-tions independently. Following recoding, a total of 33 discrep-ancies were observed, but the average kappa and PABAK scores improved to reflect satisfactory levels of agreement (kappa=0.58, PABAK=0.77). The remaining discrepan-cies were resolved through discussion with a third inde-pendent reviewer expert in identification of BCTs (MJ).
Methodological quality
During methodological quality assessment using the EPHPP tool,22 it became apparent that some items of the tool were not applicable to the design of some of the studies and hence were not rated. For uncon-trolled before and after studies (n=24), the question on ‘confounders’—assessing whether there are important differences between two groups prior to intervention— was not applicable due to a lack of a comparison group. Similarly, the questions on ‘withdrawals and drop-outs’ and ‘intention to treat analysis’ were not applicable as the before and after assessments of patient delay were carried out in different groups of people. For controlled before and after studies of public health interventions targeted at the whole community (n=3), the question on ‘withdrawals and drop-outs’ was not applicable as the people not remaining in the study at final data collec-tion period were not intencollec-tional withdrawals or dropouts but those who did not have an ‘event’ requiring urgent medical help. The EPHPP global ratings were therefore only derived for studies with RCT designs.
synthesis and analysis
The primary outcome of interest was patient decision time (patient delay). The original review protocol proposed
on September 12, 2020 by guest. Protected by copyright.
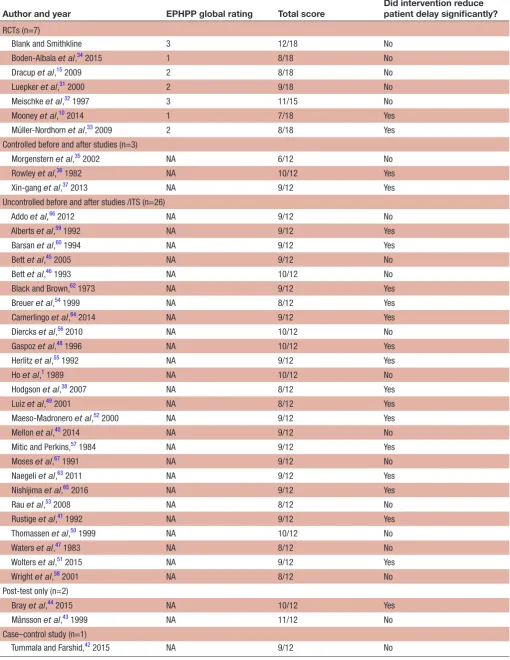
Table 6 Summary table of overall methodological quality ratings associated with intervention effectiveness
Author and year EPHPP global rating Total score Did intervention reduce patient delay significantly?
RCTs (n=7)
Blank and Smithkline 3 12/18 No
Boden-Albala et al,34 2015 1 8/18 No
Dracup et al,15 2009 2 8/18 No
Luepker et al,31 2000 2 9/18 No
Meischke et al,32 1997 3 11/15 No
Mooney et al,10 2014 1 7/18 Yes
Müller-Nordhorn et al,33 2009 2 8/18 Yes
Controlled before and after studies (n=3)
Morgenstern et al,35 2002 NA 6/12 No
Rowley et al,36 1982 NA 10/12 Yes
Xin-gang et al,37 2013 NA 9/12 Yes
Uncontrolled before and after studies /ITS (n=26)
Addo et al,66 2012 NA 9/12 No
Alberts et al,59 1992 NA 9/12 Yes
Barsan et al,60 1994 NA 9/12 Yes
Bett et al,45 2005 NA 9/12 No
Bett et al,46 1993 NA 10/12 No
Black and Brown,62 1973 NA 9/12 Yes
Breuer et al,54 1999 NA 8/12 Yes
Camerlingo et al,64 2014 NA 9/12 Yes
Diercks et al,56 2010 NA 10/12 No
Gaspoz et al,48 1996 NA 10/12 Yes
Herlitz et al,55 1992 NA 9/12 Yes
Ho et al,1 1989 NA 10/12 No
Hodgson et al,38 2007 NA 8/12 Yes
Luiz et al,49 2001 NA 8/12 Yes
Maeso-Madronero et al,52 2000 NA 9/12 Yes
Mellon et al,40 2014 NA 9/12 No
Mitic and Perkins,57 1984 NA 9/12 Yes
Moses et al,67 1991 NA 9/12 No
Naegeli et al,63 2011 NA 9/12 Yes
Nishijima et al,65 2016 NA 9/12 Yes
Rau et al,53 2008 NA 8/12 No
Rustige et al,41 1992 NA 9/12 Yes
Thomassen et al,50 1999 NA 10/12 No
Waters et al,47 1983 NA 8/12 No
Wolters et al,51 2015 NA 9/12 Yes
Wright et al,58 2001 NA 8/12 No
Post-test only (n=2)
Bray et al,44 2015 NA 10/12 Yes
Månsson et al,43 1999 NA 11/12 No
Case–control study (n=1)
Tummala and Farshid,42 2015 NA 9/12 No
EPHPP, Effective Public Health Practice Project; ITS, interrupted time series; NA, not available; RCTs, randomised controlled trials.
on September 12, 2020 by guest. Protected by copyright.
Table 7 BCTs and additional techniques used in effective and ineffective studies measuring patient delay (n=10)
BCT
number BCT label Frequency
Effective studies in which this BCT is present, n (n=5)
Ineffective studies in which this BCT is present, n (n=5)
1.1 Goal-setting (behaviour) 0 0 0
1.2 Problem-solving 1 1 0
1.4 Action planning 6 3 3
3.1 Social support (unspecified) 0 0 0
3.2 Social support (practical) 0 0 0
4.1 Instruction on how to perform the behaviour 1 1 0
4.2 Information about antecedents 0 0 0
5.1 Information about health consequences 4 2 2
5.2 Salience of consequences 2 1 1
6.1 Demonstration of the behaviour 0 0 0
7.1 Prompts and cues 1 1 0
8.1 Behavioural practice/rehearsal 0 0 0
8.2 Behaviour substitution 0 0 0
9.1 Credible source 2 2 0
11.2 Reduce negative emotions 0 0 0
12.5 Adding objects to the environment 1 1 0
13.1 Identification of self as a role model 0 0 0
13.2 Framing/Reframing 0 0 0
15.1 Verbal persuasion about capability 0 0 0
Additional techniques
AT1 Provision of factual information (eg, on signs and symptoms of disease) 10 5 5
AT2 Instruction on behaviour (what to do) 9 5 4
AT3 Instruction on intermediate behaviour 0 0 0
AT4 Information about health consequences of intermediate behaviour 0 0 0
AT5 Reflecting on past experiences 0 0 0
BCTs, behaviour change techniques.
that studies would be analysed narratively, and meta-anal-yses with subgroup analmeta-anal-yses would be conducted where the data were appropriate for such analysis. However the data were not suitable for such meta-analyses as informa-tion on means and SDs was missing, data were skewed, and there was significant heterogeneity across studies in terms of study design, intervention target, mode of delivery, target population and assessment of patient delay.
Means with or without SDs were reported in 13 studies. Fifteen of 27 authors of the remaining studies were contacted to request means and SD data. Ten of 15 authors contacted to request these data replied; data were no longer available for 8 studies. Two studies required additional analysis to obtain means and SDs as the data were not normally distributed or the sample sizes were small. For the remainder of studies (n=5), means were derived from the medians, sample size, and first and third quartiles, if reported, using a formula by Wan et al.27 This
resulted in 18 studies for which means were available, 10 of which also reported SDs (see table 1).
In seven studies for which both means and SDs were available, either reported or derived, skewness was esti-mated using the criterion suggested by Altman and Bland,28 that is, data are likely to be skewed if the mean is smaller than twice the SD. As shown in table 1, patient delay time data were likely to be skewed in seven of the ten studies, and we were therefore unable to combine studies into a meta-analysis. Instead, the results are synthesised and presented narratively following guidance on conducting systematic reviews of health promotion and public health interventions.23 29
As the main aim of this review was to identify what is effective in reducing patient delay, it was particu-larly important to examine the studies which measured patient delay distinct from those which measured prehos-pital time. Studies which measure prehosprehos-pital time have the potential to both overestimate and underestimate
on September 12, 2020 by guest. Protected by copyright.
the ability of interventions to reduce patient delay. For example, reductions in other elements of prehospital time such as transportation time might be erroneously attributed to the patient delay intervention (leading to overestimation of its effect), or similarly increases in transportation time could ‘cancel out’ the benefits of an effective patient delay intervention (underestimation).
ResulTs
Original database searches (see figure 2) identified 20 996 citations, with 18 285 remaining after removing the duplicates. Searches through other sources (citation tracking, reference lists, National Research Register, contact with authors in the field) identified 824 addi-tional citations. A total of 19 109 titles were screened. The initial screening of titles identified from database search and citation tracking was undertaken by one reviewer (PA), and the reliability of this screening was assessed by a second reviewer (BF) independently screening a subset of the titles.
Titles identified from database search
Just under 5% (n=909) of the number of titles identified from the database search were double-screened. The first screener included 31 titles and the second included 62, with both agreeing on 19 of those selections (see online supplementary material 1). The overall agreement was 94%. The second screener agreed with 61% (19/31) of the titles selected with the first screener and selected an additional 4.7% (43/909) of the titles. The PABAK was 0.88. After double-screening the abstracts of the 74 titles selected by either reviewer, 5 were selected for full-text review. Of the five papers screened in full, two were included. Extrapolating to the total number of titles iden-tified (n=18 285), it was estimated that had all the identi-fied titles been screened in this way, then no studies would have been missed (see online supplementary material 2).
Titles identified from citation tracking
Twenty per cent (n=145) of the total number of titles identified from citation tracking (n=724) were double-screened. Twelve and 18 titles were selected by the first and the second screeners, respectively, with both agreeing on 11 of those selections. The overall agreement was 94%. The second screener agreed with 91% (11/12) of the titles selected with the first screener and selected an additional 4.8% (7/145) of the titles (PABAK=0.88). On screening the abstracts of the eight titles screeners disa-greed on, only one was selected for full-text review. This study was later excluded as it did not involve a compar-ison group. This suggests that none of the additional titles included by second reviewer alone would have made it to the included studies.
An update search using the same search strategy for articles published between March 2014 and August 2016 was also undertaken (see figure 3). This identified an additional 623 citations after removing the duplicates. The 623 titles were independently screened by PA and
BF. Abstracts of all titles considered potentially relevant by either screener were then screened. A total of 97 abstracts were independently screened by both reviewers (PA and BF). Of the nine screened in full, two did not meet one or more of the inclusion criteria and one was not available in full text. One paper reported data from an intervention already included. A total of 5 addi-tional papers were identified, giving a total of 39 studies included in the review (Figure 3).
description of included studies
The main characteristics of the 39 included studies are summarised in online supplementary material 3. The studies addressed patient delay in a variety of clinical contexts: 16 in acute myocardial infarction, 15 in stroke, 5 in ACS, 2 in cancer and 1 in chest pain. The studies were published between 1973 and 2016 and varied geograph-ically, with 14 studies from the USA or Canada, 6 from Germany, 4 each from the UK and Australia, 2 from Ireland, 2 each from Sweden and Switzerland, 1 each from Norway, Italy, Japan and China, and 1 from multiple countries. The studies were heterogeneous in design: 7 were RCTs10 30–34 with individuals or communities as unit of randomisation, 335–37 controlled before and after studies, 23 uncontrolled before and after studies, 338–41 interrupted time series (ITS), 1 case–control study,42 and 243 44 post-test-only studies.
The study population in the majority of studies (n=24) consisted of individuals with a suspected diagnosis, that is, presenting with symptoms suggestive of a relevant life-threatening condition; 15 studies included only those with a confirmed diagnosis. For patient delay time, the 7 RCTs reported on a total of 30 888 partic-ipants, while 32 studies with non-randomised designs reported on a total of 169 650 participants. Across all studies that reported this information, the average mean age of participants was 65.6 years (SD=5.08, range=56– 77), and an average of 42.5% of the participants were female (range 16%–100%, SD=14.6). In all studies, the data were collected from hospital/outpatients settings, with information obtained mainly from patient medical records or relevant clinical registries. In all studies with before and after designs, prehospital/patient delay time was recorded in different people before and after the intervention.
All studies evaluated interventions aimed at reducing patient delay, that is, the time from onset of symptoms to patients seeking medical help. However, the studies varied in terms of how this delay was measured. Twen-ty-four studies assessed prehospital delay, that is, the time from symptom onset to arrival at hospital/emergency department/coronary care unit; five36 43 45–47 assessed patient delay, that is, the time from symptom onset to the first medical contact; and five assessed both.44 48–51 Five studies did not explicitly report how the delay time was measured.41 42 52–54
on September 12, 2020 by guest. Protected by copyright.
Table 8 BCTs and additional techniques used in effective and ineffective studies in ACS (n=5)
BCT
number BCT label Frequency
Effective ACS studies in which this BCT is present, n (out of 3)
Ineffective ACS studies in which this BCT is present, n (out of 2)
1.1 Goal-setting (behaviour) 1 1 0
1.2 Problem-solving 6 2 1
1.4 Action planning 27 3 1
3.1 Social support (unspecified) 2 1 0
3.2 Social support (practical) 3 1 1
4.1 Instruction on how to perform the behaviour 4 1 0
4.2 Information about antecedents 1 0 1
5.1 Information about health consequences 16 2 1
5.2 Salience of consequences 4 0 1
6.1 Demonstration of the behaviour 3 0 0
7.1 Prompts and cues 5 1 1
8.1 Behavioural practice/rehearsal 3 1 1
8.2 Behaviour substitution 1 1 0
9.1 Credible source 5 1 0
11.2 Reduce negative emotions 1 0 0
12.5 Adding objects to the environment 3 0 0
13.1 Identification of self as a role model 1 0 0
13.2 Framing/reframing 1 0 1
15.1 Verbal persuasion about capability 1 0 0
Additional techniques
AT1 Provision of factual information (eg, on signs and symptoms of disease) 36 3 1
AT2 Instruction on behaviour (what to do) 33 3 0
AT3 Instruction on intermediate behaviour 1 0 0
AT4 Information about health consequences of intermediate behaviour 1 0 0
AT5 Reflecting on past experiences 1 1 0
ACS, acute coronary syndrome; BCTs, behaviour change techniques.
Methodological quality
Overall, the methodological quality of included studies was mixed (tables 2 and 3). Seven studies were rated as strong for protection against allocation bias due to their RCT design; most of the remaining were moderately rated due to quasi-experimental designs (controlled or uncontrolled before and after studies, and ITS). Of the seven RCTs, two10 34 were judged to be strong, three15 31 33 were judged moderate and two30 32 as weak. Of the three controlled before and after studies, one35 study was rated strong on selection bias and data collection methods, with the remainder rated as moderate/weak. All three55–57 were assessed as moderate on blinding, with two assessed as weak on confounders.
Of the 29 remaining non-randomised studies (23 uncontrolled before and after, 3 ITS, 2 post-test only and 1 case–control), 738 39 47 49 52–54 58 studies were rated strong on selection bias, that is, included samples judged as likely to be representative of the target population; majority of
the remainder rated as moderate or weak (20 moderate; 2 weak). All were rated weak on data collection methods. None received a strong rating on blinding; 25 were rated moderate and 5 as weak.
In describing intervention integrity, the percentage of participants receiving the allocated intervention was reported in 630 34 42 44 46 55 of the 40 studies.
Intervention characteristics
Table 4 summarises the characteristics of interventions evaluated in included studies. There was considerable variation in the descriptions of interventions between studies. Although all interventions were directed at patients, 14 studies also included a professional educa-tion component. Eleven studies reported a theoretical basis or underlying framework to their interventions, including social marketing principles,44 53–56 58 Leventhal’s self-regulatory model,10 15 Safer’s model of patient delay,32 social cognitive theory and principles of motivational
on September 12, 2020 by guest. Protected by copyright.
interviewing,34 and a combination of self-regulatory model, social cognitive theory, diffusion theory and social marketing and community organisation principles.31
Intervention target and setting
Interventions in 30 studies were population-level education campaigns aimed at the general public, 710 15 30 33 34 36 43 were individual-level interventions aimed at high-risk individuals, and 231 32 involved both elements. All public education campaigns were delivered in the community setting (including mass media, GP prac-tices and pharmacy). Three33 36 43 of the individual-level interventions were delivered in the community setting and four10 15 30 34 in the hospital setting. Of the interven-tions involving both individual-level and population-level components, one32 was delivered in community setting and the other31 in both community and hospital settings.
Intervention mode of delivery, materials, providers and intensity All public education interventions were mass media campaigns often using multiple channels to deliver the key intervention message. Nineteen used electronic media (television and radio); 23 used print media (news-papers, magazines, press releases, handbooks, pamphlets, leaflets, books); 4 used digital media (eg, mobile phones, internet, blogs, emails); 7 used outdoor media (eg, bill-board, posters); and 13 used face-to-face events on a group basis (eg, public meetings, road shows, informa-tive sessions). The two31 32 interventions with both popu-lation-level and individual-level elements used electronic media and direct mailing; one31 also used face-to-face meetings on an individual and group bases. The most commonly used materials in these campaigns involved television and radio ads/features and posters/flyers/leaf-lets in public places. The duration of the public educa-tion campaigns varied considerably, ranging from 1 week to 48 months (M=14.5 months, SD=14.1); 15 population interventions lasted up to 12 months and 8 lasted between 13 and 48 months. The duration was not reported in nine studies.41 45 49 50 53 56 58–60 Interventions in four studies were implemented in two or more phases/waves.38–40 51 55
Three33 36 43 of the individual-level interventions were delivered remotely using direct mail (eg, letters/leaf-lets posted to participants’ homes); four10 15 30 34 were delivered face-to-face, one of which also used a directly mailed letter and a phone call as reminder and support10; and one was delivered in a group format.34 The face-to-face interventions used a variety of materials including action/advisory plans (n=1), stickers (n=2), professional scripts (n=2) and educational video (n=2). Three10 15 30 of four face-to-face interventions were provided, once only, by nurses, physicians and the researcher, and lasted an average of 28 min (range 5–40 min, SD=20). The fourth face-to-face intervention34 was provided in a group format, twice, by physicians and health educators, for an unspecified duration. Letters were mailed either by physi-cians, nurses or the research team over an average dura-tion of 5 months (range 1.5–12 months, SD=5.6).
Intervention tailoring, modifications and fidelity
Most of the interventions were not personally tailored; only one of the public education campaigns56 was tailored to women aged 40–60 years, two tailored the language of the intervention to a specific ethnic/cultural group,34 40 and two of the one-to-one interventions15 61 were tailored to patients’ past experiences and life situation. None of the studies described any modifications to the interven-tions during the course of the study. Six studies, four of public education campaigns31 51 55 57 and two of individual intervention,10 15 reported assessing fidelity of the inter-vention. Fidelity of mass media campaigns was assessed in terms of the likely reach and impact of the campaign, for example, by obtaining measures of intervention exposure, viewer ratings and random sample surveys of knowledge, attitudes and beliefs. Of the two individual intervention trials, only Mooney et al10 reported opti-mising fidelity through delivery of standardised training to providers and monthly reviews of intervention delivery and data collection procedures. Dracup et al15 reported assessing fidelity by measuring knowledge, attitudes and beliefs about ACS in both groups at baseline and follow-up.
Behaviour change techniques
A total of 19 BCTs from BCTT V.1 and 5 additional tech-niques were identified across all 39 intervention descrip-tions. An average of 2 BCTs (SD=2.3, range 0–10) and 2 additional techniques per intervention (SD=0.69, range 0–4) were coded. The most frequently presented BCTs were action planning (n=27), information about health consequences (n=16), problem-solving (n=6), credible source (n=5) and prompts/cues (n=5), and the most frequently used additional techniques were provision of information on signs and symptoms (n=36) and instruc-tion on what to do (n=32) (table 5).
Reported intervention effectiveness
Just over half (n=20)10 33 36–38 41 44 48 49 51 52 54 55 57 59 60 62–65 the studies reported a statistically significant reduction in delay following intervention, 2 of which were RCTs,10 33 while the remaining 191 15 30–32 34 35 39 40 42 43 45–47 50 53 56 58 66 67 did not, including 5 RCTs.15 30–32 34
Associations between reported intervention effectiveness and various study features
BCTs and effectiveness
A visual inspection of the distribution of effective and ineffective studies on individual BCTs suggests no clear pattern of association between the presence of indi-vidual BCTs and reported intervention effectiveness. The majority of the BCTs were equally likely to be present in studies reporting a positive effect on patient delay as those reporting no effect (see table 5 and figures 4 and 5). There was no relationship between the number of BCTs present and intervention effectiveness (point-bise-rial r=−0.086, p=0.602, n=39).
on September 12, 2020 by guest. Protected by copyright.
Intervention and study characteristics, methodological quality and effectiveness
Visual inspection of the distribution of studies reporting significant and non-significant effects of intervention on various study and intervention features (table 4) suggests absence of a clear pattern of association between reported intervention effectiveness and the examined study/inter-vention characteristics. Similarly table 6 suggests absence of a clear pattern of association between reported inter-vention effectiveness and methodological quality.
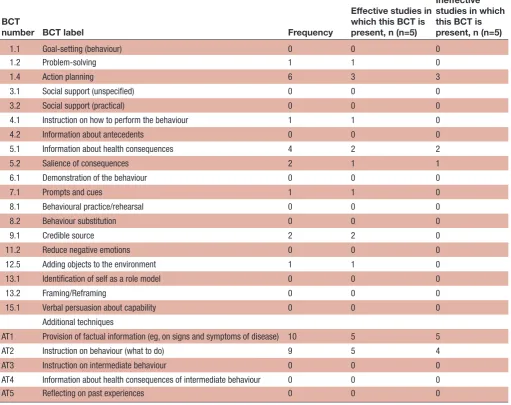
Findings specific to studies measuring patient delay
Ten studies36 43 45–51 68 assessed patient delay, that is, the time from symptom onset to first medical contact distinct from other aspects of prehospital delay (eg, transporta-tion time).
Of the ten studies which measured patient delay, none were RCTs, one36 was a controlled before and after study, seven45–51 were uncontrolled before and after, and two43 68 single-group post-test design. Eight45–51 68 evaluated mass media interventions and two direct mail educational interventions.36 43 The most commonly used techniques were techniques additional to BCTT V.1: all (10/10) studies which measured patient delay included AT1 Provision of factual information (eg, on signs and symp-toms) and almost all (9/10) included AT2 Instruction on behaviour (what to do). The results are presented in table 7, and it can be seen that there is no clear pattern of associ-ation between the presence of a particular technique and a reduction in patient delay. However, three36 49 51 of the four studies,36 47 49 51 which included two or more BCTs in addition to the commonly used AT1 and AT2, reported a significant reduction in patient delay.
Findings specific to ACs studies
Of the five studies that evaluated an intervention to reduce patient delay in ACS, two10 15 were RCTs and two56 63 were uncontrolled before and after studies, and one was a post-test-only study.44 One of each design10 44 63 reported a significant reduction in patient delay following interven-tion. The two RCTs10 15 evaluated an individual-level inter-vention delivered face-to-face in a clinical setting. The two before and after studies56 63 and one post-test-only study44 evaluated a population-level mass media campaign aimed at reducing patient delay for symptoms of ACS. The most commonly used BCTs and additional techniques were action planning (n=4) and provision of information on signs and symptoms of disease (n=4), respectively. The results are summarised in table 8, and visual inspection suggests no pattern of association between the presence of a technique and reported effectiveness.
dIsCussIOn
This comprehensive and systematic review of the existing literature in relation to reducing patient delay with serious symptoms has found that only around half of the studied interventions report any success in reducing prehospital
delay. This proportion is similar across study designs, mode of delivery, populations and clinical contexts. This demonstrates there is still much scope to improve the effectiveness of interventions to reduce delay. Despite examining a number of components that might explain the variation in effectiveness, we were unable to differen-tiate the studies reporting success from those that did not. This is true even if only the subset of studies conducted in a cardiac population are examined, and therefore the conclusions reflect a limitation of the available literature in this area and are not related to the scope of the review. When we considered only studies that measured patient delay distinct from other aspects of prehospital delay (ie, those best suited to answering our question), there is some evidence to suggest that additional use of BCTs might be helpful, but further robust enquiry is required to confirm this finding.
We have identified and described the behaviour change components of interventions to reduce patient delay. Action planning, information about health conse-quences and problem-solving were the most frequently used BCTs. However, techniques not currently classified as BCTs in BCTT V.119 were identified more commonly than the most common BCTs: information on signs and symptoms and instruction on what to do. This suggests there is scope to increase the use of BCTT V.1 techniques in interventions to reduce delay.
Unfortunately, missing and highly skewed data prevented us from being able to conduct the desired meta-analyses to explore whether particular techniques are associated with effective interventions. We also encountered some difficulties in applying BCTT V.1 to BCTs delivered by mass media to public health campaigns. Possible adjustments to BCTT V.1 have been suggested via the online feedback portal: https://www. ucl. ac. uk/ behaviour- change- techniques/ BCTTv1Feedback.
In common with previous attempts to systematically review behaviour change interventions, the quality of intervention reporting was mixed.69 70 It is difficult to identify BCTs in poorly described interventions, although still possible to achieve reliability between coders.71 Tech-niques were described in reports using terms similar to the labels used in the taxonomy but with descriptions that differed from those provided by BCTT V.1. For example, ‘action planning’ occurred in interventions, but the accounts mostly described linking symptoms with specific actions and plans being given to patients rather than actively involving them in planning. This reinforces the urgent need for the ‘common language’ and unam-biguous definitions provided by BCTT V.119 to ensure when interventions or components of interventions are described or reviewed that it is possible to compare like with like.
Guidelines have been produced in efforts to improve reporting standards,26 and as journals begin to require authors to adhere to these (eg, http://www. journals. else-vier. com/ social- science- and- medicine/ policies) interven-tion descripinterven-tions are likely to improve. Thus, in time, it
on September 12, 2020 by guest. Protected by copyright.