__________
* Corresponding author
E-mail addresses:[email protected](A.Moradi);[email protected](A.AshrafzadehAfshar) 74 ABSTRACT
Gravity field models derived from the Gravity Recovery and Climate Experiment (GRACE) satellite mission are affected by the orbital arrangement of the satellites of this mission and the spatial dependence of the gravity field coefficients, which manifest themselves in the form of north to south strips in the maps of corresponding products. One of the common ways to deal with this phenomenon is to use a Gaussian filter to reduce the contribution of higher-order coefficients and to extract realistic images of the surface-mass variability. In this paper, the applicability of the two-dimensional wavelet transforms as non-statistical methods in reducing the effect of vertical components in GRACE products, including the mentioned strips, was tested. The results for different levels of transformation, as well as for using various base functions were evaluated and then compared with the results of applying a Gaussian filter on the data of mass change derived from GRACE in Iran. The results indicate that although the two-dimensional wavelet transform can inherently be used to reduce the striping error of images, the wavelet-based de-striping of GRACE products is at most as effective as the Gaussian filter of 100km, while previous studies showed that the application of the Gaussian filter of 350km would be the optimal radius to extract the hydrological signals in Iran. However in the case of wavelet transformation, the most important issue is the number of transformation levels such that applying the wavelet transforms at levels 3 and 4 have led to the closest results to the outputs of Gaussian filtering.
S
KEYWORDS
GRACE De-striping Two-Dimensional wavelet transform Applicability analysis
1. Introduction
From a general view, the gravity field of Earth can be divided into two static and time-variable parts. Although the static part is not absolutely unchanged and experiences some variations from thousands to millions of years, such variations can be ignored. Occurring as a result of the gravity of other celestial bodies, the tide is one of the factors that makes changes in the gravity field. The non-tidal component constituting the variable part of the gravity field has mainly a hydrological, oceanic, glaciological or atmospheric source, and can inherently be considered as related to the mass movement levels in the earth (Chen, 2007).
In the past, it seemed difficult or even impossible to
directly observe the mass movement of the Earth, but with the emergence of satellite missions designed specifically for the purpose of modeling the gravity field of Earth, which have been in operation since the beginning of the current century - such as CHAMP, GRACE and GOCE - the subject has considerably changed (Drinkwater et al., 2007; Reigber et al., 2002; Tapley et al., 2004). Specifically, the GRACE satellite mission is the first dedicated gravity field mission capable of measuring the changes in distance between the twin co-orbiting low-altitude satellites along with the exact positioning of each satellite with GPS receivers as well as the non-gravitational accelerations by the accelerometers
e of mass of center the in
installed ach satellite. These
w e b s i t e : h t t p s : / / e o g e . u t . a c . i r
Applicability analysis of the two-dimensional discrete wavelet transform
for de-striping of GRACE products
Amirreza Moradi1*, Ali Ashrafzadeh Afshar2
1 Department of Surveying Engineering, Arak University of Technology, Arak, Iran 2 Department of Surveying Engineering, Zanjan University, Zanjan, Iran
Article history:
gravity field of Earth, in particular, due to the changes in the surface mass distribution at global and regional scales (Tapley et al., 2004). For this purpose, after more than a decade of observations, the products of this mission are unprecedentedly utilized in various ways to trace the global and regional changes in the mass distribution, in particular, the changes in the water resources (for example, Awange et al., 2011; Cao et al., 2015; Frappart et al., 2013; Mulder et al., 2015 and Ramillien et al., 2012 can be outlined).
Among the GRACE data available at various levels known as Level 0, 1 and 2 (Chen, 2007), the level-2 data of the mission, as presented in the form of spherical harmonic expansion coefficients of geopotential with the monthly temporal resolution, could be considered the most commonly used products in providing a picture of the temporal and spatial variations of the gravity field due to their relative ease of use. Due to the orbital arrangement of the satellites of this mission and the spatial dependency between the gravity field coefficients, this issue has led to some stripes in the north-south direction in maps representing the changes in the surface mass distribution produced by GRACE. Hence, in order to properly use these data, appropriate filtering (de-striping) has to be applied to the GRACE spherical harmonic products to remove the striping error in the corresponding maps. In the studies based on these products (Level-2 data) several methods have been used to eliminate or reduce such stripes, including the use of the Gaussian isotropic filter, by Jekeli (1981), Wahr et al. (2011) and the modified Gaussian isotropic filter by Chambers (2006), respectively. The dependency of the employed filters in the aforementioned studies on the degree of spherical harmonics is such that by increasing the degree, they approach to zero and their application leads to a decrease in the contributing coefficients.
In some studies, the non-isotropic filters are utilized to encounter the striping error (Guo et al., 2010and Han et al., 2005). These filters depend on both the degree and the order of spherical harmonics. Fathollah Zadeh et al. (2013) introduced a method in which the striping error is eliminated using the gravity gradient tensor. They showed that some components of the gravity gradient tensor that were derived from the differentiation of the gravity potential function along the latitude could effectively eliminate the striping error of the GRACE data. Fathollah Zadeh et al. (2016) presented a method based on the application of spherical wavelet transform on the GRACE level-2 data to reduce the striping error and compared the obtained results with the Gaussian filtering, concluding that the application of spherical wavelet transforms leads to more desirable results. Some other notable methods to deal with the striping error of the GRACE spherical harmonic products include Wiener optimal filtering (Sasgen et al., 2006), Statistical filtering (Davis et al., 2008) and decorrelation along with Gaussian
Similar to what happens in the GRACE gravity maps, the striping error is observed in most remote sensing images. Rezaei (2015) showed that by applying the discrete wavelet transform on the hyperspectral images and then, the Fourier filtering of vertical component, the quality of the images can be maintained while eliminating the striping error. Torres and Infante (2001) encountered the striping noise in satellite images based on the wavelet analysis, as well.
In this paper, the efficiency of the 2D discrete wavelet transform is tested as a non-statistical method for the elimination of striping errors in the mass variation data related to Iran obtained from the GRACE level-2 data, and the results for different levels of the wavelet transform and also for the application of various basis functions are compared with what resulted from applying the Gaussian filtering on the same data. For this purposes, the next sections of this paper are organized as follows. At first, in addition to a brief overview on the fundamentals of the 2D wavelet transform, we describe how this transformation is encountered with the vertical stripes. Then the desired process is introduced, the used data are described, and after applying the wavelet transform at different levels based on the selected basis functions, the results are finally presented and compared.
2. Two-dimensional discrete wavelet transform in brief
According to wavelet terminology (Burrus et al., 1997), a discrete function f(t) can be represented as a weighted summation of wavelets ψj,k(t), plus a coarse approximation φk(t) as follows
, ,
( )
k k( )
j k j k( )
k k j 0
f t
c
t
d
t
(1)where the wavelets ψj,k(t) are constructed by translating and stretching a main producer function, known as mother wavelet ψ(t)
,
( )
(
)
j
j k
t
2 t
k
(2) and the scaling functions φk(t) are translated versions of a basic scaling function φ(t) as( )
(
)
k
t
kt
k
67
( )
(
)
n 1(
)
g n
1
h
n 1
(4) The decomposition and reconstruction of a uniformly sampled function {fi+1(n),n∈Z}, can respectively be computed as follows (Li, 1996)
i i+1
k
i i+1
k
c
n =
h 2n-k f
(k)
d
n =
h 2n-k f
(k)
(5) and( ) ( ) ( ) ( ) ( )
i 1 k i k i
f n
h 2 k n c k
g 2 k n d k (6)Similar to the 1DWT, the two dimensional discrete wavelet transform (2DWT) of two dimensional functions is constructed using the above mentioned filters. In this situation, the forward and inverse 2DWT of a given 2D sequence {fi+1(n,m),m,n∈Z} can respectively be written as (Li, 1996)
i i+1
k l
i,1 i+1
k l
i,2 i+1
k l
i,3 i+1
k l
c n,m = h 2n-k h 2m-l f k,l
d n,m = g 2n-k h 2m-l f k,l
d n,m = h 2n-k g 2m-l f k,l
d (n,m)= g 2n-k g 2m-l f k,l
(7)
and
i+1 i
k l
i,1
k l
i,2
k l
i,3
k l
f n,m = h 2k-n h 2l-m c k,l +
g 2k-n h 2l-m d k,l +
h 2k-n g 2l-m d k,l +
g 2k-n g 2l-m d k,l
(8)
In expression (7), the details 𝑑𝑖,1, 𝑑𝑖,2 and 𝑑𝑖,3 are called horizontal, vertical and diagonal details, respectively, corresponding to the direction of decomposition in 2DWT
3. Used data, data analysis and obtained results
In this study, the GRACE 141-month, level-2 data were used between August 2002 and April 2015 which were extracted from GRACE level 2 Release 05, produced by the Center for Space Research (CSR) at the University of Texas (Bettadpur, 2012). These data were first modified in accordance with the methodology proposed by Ashraf Zadeh Afshar et al. (2016) by replacing the degree-one spherical harmonic coefficient with those computed by Swenson et al. (2008) and the lowest-degree zonal harmonic coefficient, C20, which is due to the flattening of the Earth, with those estimated from Satellite Laser Ranging (SLR) and finally by correcting the effect of the Caspian Sea using surface water changes derived from satellite altimetry observations. The result is the map of variations in the total water layer thickness equivalent to the total water storage (TWS) changes in Iran during this period as shown in Figure1, in which the north-south stripes are evident.
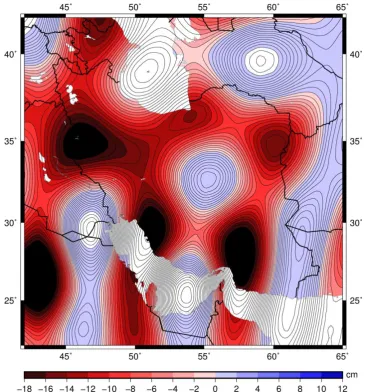
Application of isotropic Gaussian filters of different radii can reduce the above stripes to some extent. Figure 2 shows the results of applying the Gaussian smoothers with radii of 100km, 350km and 750 km, respectively, to the data used in
(2016), the application of a de-striping isotropic Gaussian filter of 350km radius could effectively extract the TWS changes in Iran.
Now, by applying the 2DWT on the monthly unfiltered total water layer thickness changes in Iran, we separate the coarse parts of the above signal from its horizontal, vertical, and diagonal details according to Eq. (7). Since the image high frequency information with vertical orientation mostly affects the obtained vertical details 𝑑𝑖,3 in Eq. (7), these coefficients are largely influenced by the striping phenomenon, while part of the effect of this phenomenon remains in the resulting approximation coefficients 𝑐𝑖. Therefore, the process of separating the approximation and the details can now be continued by reapplying the wavelet transform to the above-mentioned approximation coefficients. Each time, by filtering the vertical component of the obtained details and restoring the signal at a lower level using Eq. (8), the filtered data can be compared with the results that lead to the generation of Figure (2). In this study, the above comparison provides
Figure 2. GRACE Total Water Storage (TWS) changes in Iran from August 2002 to April 2015 after smoothing using a de-striping isotropic Gaussian filters of (a) 100km, (b) 350km and (c) 750km radii (Ashraf Zadeh Afshar
67 directions for selecting the optimal wavelet basis function as
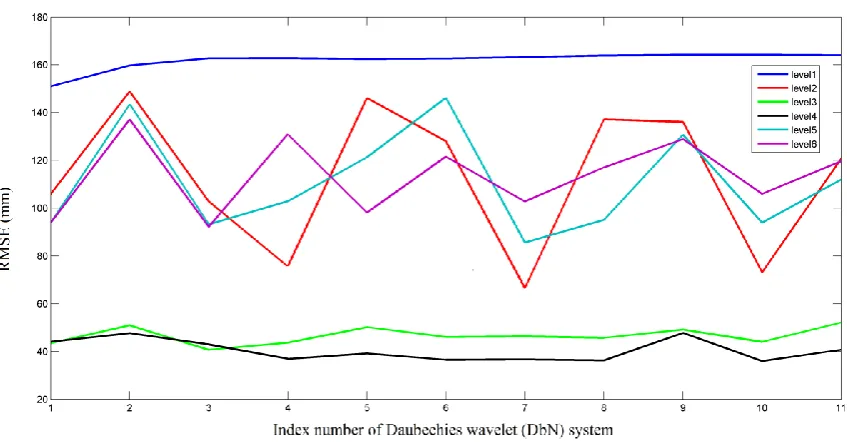
well as the number of optimum levels for the transformation. This procedure has been tested for several well-known Daubechies orthogonal wavelet functions (Daubechiesi, 1992) and for each selected basis function, the wavelet transform is applied up to level 6, as the maximum possible level that can be selected according to the number of data points and each time, the root-mean-square error (RMSE) obtained from the approximation by the wavelet transform method is estimated in comparison with their respective values from the Gaussian filtering method. These results are shown in Figure 3.
The results clearly show that, first, application of the wavelet transform up to decomposition levels 3 and 4 leads to the best results in terms of proximity to the Gaussian filtering, and its progress up to levels 5 and 6 deteriorates the results. Second, regardless of the transformation levels, it could be concluded that the issue of selecting the mother wavelet in the case of facing with the striping error will not change or improve the results. Given the above results, the application of the discrete 2D wavelet transform with a
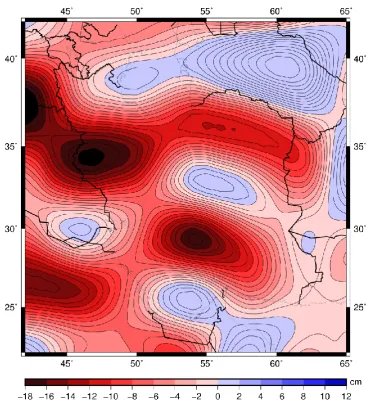
Daubechies-10 wavelet system up to level 4 on the monthly variations in the thickness of the unfiltered water layer, and the filtering of the vertical details from these transformations result in the TWS changes shown in Figure 4.
The Comparison of Figures 2 and 4 implies that the effective de-striping of the GRACE monthly solutions cannot be carried out using the 2DWT, as the best result of the wavelet-based de-striping of GRACE maps is very similar to those of applying the Gaussian filter with radius of 100km, in which the striping errors are not completely removed. The lower inefficiency of the wavelet-based method may be associated with: a) the possible number of transformation levels or b) the effect of the strips on the 2DWT components other than the vertical details at each level. According to Figure (1) and the number of possible levels for wavelet transform which is affected by the resolution of the GRACE level-2 data, the first factor is not relevant to the above mentioned inefficiency and it seems that the second factor is the reason for the failure of the wavelet transform in this particular case.
Figure 3. Root Mean Square Error (RMSE) of the wavelet-based GRACE TWS changes in Iran from August 2002 to April 2015 with respect to the corresponding values resulted from Gaussian smoothing
Figure 4. GRACE Total Water Storage (TWS) changes in Iran from August 2002 to April 2015 after smoothing using the 2DWT with Daubechies-10 wavelet system up to level 4
4. Conclusion
In this paper, the applicability of the 2D discrete wavelet transform facing the striping phenomenon was studied in the maps reflecting the surface mass distribution derived from the GRACE satellite mission. To this end, the process of eliminating the effect of striping error from the data corresponding to the monthly unfiltered total water layer thickness changes in Iran was carried out by applying the 2D discrete wavelet transform and filtering the vertical details at successive levels.
The inherent characteristics of the wavelet transform in terms of the diversity of base functions that can be used in the transformation as well as being a multispectral transformation affected the selected base functions. Besides, the number of optimum transformation levels in achieving the best results was tested in the process of de-striping. For this purpose, the optimal mode measurement, the least difference between the result of applying the wavelet transform, and the isotropic
78 could be investigated in a modified wavelet-based procedure.
References
Ashrafzadeh Afshar A, Joodaki G R & Sharifi M A. (2016). Evaluation of Groundwater Resources in Iran Using GRACE Gravity Satellite Data. JGST, 5 (4), 73-84. Awange, J.L., Fleming, K.M., Kuhn, M., Featherstone, W.E.,
Heck, B. & Anjasmara, I. (2011). On the suitability of the 4× 4 GRACE mascon solutions for remote sensing Australian hydrology. Remote Sensing of Environment, 115(3), 864-875.
Bettadpur, S. (2012). UTCSR Level-2 Processing Standards Document for Level-2 Product Release 0005. GRACE 327-742, CSR Publ. GR-12-xx, Rev, 4, 16.
Beylkin, G., Coifman, R., & Rokhlin, V. (1991). Fast wavelet transforms and numerical algorithms I. Communications on pure and applied mathematics, 44(2), 141-183.
Burrus, C. S., Gopinath, R. A., & Guo, H. (1997). Introduction to wavelets and wavelet transforms: a primer. Prenotice Hall, New Jersey.
Cao, Y., Nan, Z. & Cheng, G. (2015). GRACE gravity satellite observations of terrestrial water storage changes for drought characterization in the arid land of northwestern China. Remote Sensing, 7(1), 1021-1047. Chambers, D. P. (2006). Observing seasonal steric sea level
variations with GRACE and satellite altimetry. Journal of Geophysical Research: Oceans, 111(C3).
Chen, Y. (2007). Recovery of Terrestrial Water Storage Change from Low-Low Satellite-to-Satellite Tracking. PhD thesis, Ohio State University.
Daubechies, I. (1992). Ten lectures on wavelets (Vol. 61). Siam, Philadelphia.
Davis, J. L., Tamisiea, M. E., Elósegui, P., Mitrovica, J. X., & Hill, E. M. (2008). A statistical filtering approach for Gravity Recovery and Climate Experiment (GRACE) gravity data. Journal of Geophysical Research: Solid Earth, 113(B4).
Drinkwater, Mark R., R. Haagmans, D. Muzi, A. Popescu, R. Floberghagen, M. Kern, & M. Fehringer. (2007) The GOCE gravity mission: ESA’s first core Earth explorer. Proc. The 3rd international GOCE user workshop, 6-8 November, 2006, Frascati, Italy.
Fatolazadeh, F., Voosoghi, B., & Naeeni, M. R. (2016). Wavelet and Gaussian approaches for estimation of groundwater variations using GRACE data. Groundwater, 54(1), 74-81.
Fatolazadeh, F., Voosoghi, B., & Naeeni, M. R. (2014). Application of the Gravity Gradient Tensor in Elimination of the Striping Error of GRACE Gravity Observations (Case Study: Sumatra’s 9.2 Magnitude Earthquake on 26TH DEC 2004). JGST,3 (4), 11-20. Frappart, F., Seoane, L. & Ramillien, G. (2013). Validation
of GRACE-derived terrestrial water storage from a
regional approach over South America. Remote Sensing of Environment, 137, 69-83.
Guo, J. Y., Duan, X. J., & Shum, C. K. (2010). Non-isotropic Gaussian smoothing and leakage reduction for determining mass changes over land and ocean using GRACE data. Geophysical Journal International, 181(1), 290-302.
Han, S. C., Shum, C. K., Jekeli, C., Kuo, C. Y., Wilson, C., & Seo, K. W. (2005). Non-isotropic filtering of GRACE temporal gravity for geophysical signal enhancement. Geophysical Journal International, 163(1), 18-25. Jekeli, C. (1981). Alternative methods to smooth the Earth's
gravity field. Rep. 327, Department of Geodesy Science and Surveying., Ohio State Univ., Columbus.
Li, Z. (1996). Multiresolution approximation of the gravity field. Journal of geodesy, 70(11), 731-739.
Mallat, S. G. (1989). Multiresolution approximations and wavelet orthonormal bases of 𝐿² (𝑅). Transactions of the American mathematical society, 315(1), 69-87.
Mulder, G., Olsthoorn, T.N., Al-Manmi, D.A.M.A., Schrama, E.J.O. & Smidt, E.H. (2015). Identifying water mass depletion in northern Iraq observed by GRACE. Hydrology and Earth System Sciences, 19(3), 1487-1500.
Ramillien, G.L., Seoane, L., Frappart, F., Biancale, R., Gratton, S., Vasseur, X. & Bourgogne, S. (2012). Constrained regional recovery of continental water mass time-variations from GRACE-based geopotential anomalies over South America. Surveys in geophysics, 33(5), 887-905.
Reigber, C., Balmino, G., Schwintzer, P., Biancale, R., Bode, A., Lemoine, J. M., ... & Barthelmes, F. (2002). A high‐ quality global gravity field model from CHAMP GPS tracking data and accelerometry (EIGEN‐ 1S). Geophysical Research Letters, 29(14).
Rezaei, Y. (2015). Noise Destriping in Hyperspectral Imagery in Frequency Domain by Combination of Wavelet and Fourier Transform. JGST, 4 (4) :233-244. Sasgen, I., Martinec, Z., & Fleming, K. (2006). Wiener
optimal filtering of GRACE data. Studia Geophysica et Geodaetica, 50(4), 499-508.
Swenson, S., & Wahr, J. (2006). Post‐ processing removal of correlated errors in GRACE data. Geophysical Research Letters, 33(8).
Swenson, S., Chambers, D., & Wahr, J. (2008). Estimating geocenter variations from a combination of GRACE and ocean model output. Journal of Geophysical Research: Solid Earth, 113(B8).
78 elimination of striping noise in satellite images. Optical
Engineering, 40(7), 1309-1315.
Wahr, J., Molenaar, M., & Bryan, F. (1998). Time variability of the Earth's gravity field: Hydrological and oceanic effects and their possible detection using GRACE. Journal of Geophysical Research: Solid Earth, 103(B12), 30205-30229.