University of Trento
Doctoral School in Cognitive Sciences and Education
XXII° cycle
PhD Thesis
When 1 in 200 is higher than 5 in 1000:
The “1 in X effect” on the perceived probability
of having a Down syndrome-affected child
Advisor: PhD candidate:
Lucia Savadori Elisa Barilli
A.Y. 2009-2010
As the old joke goes, five out of four people have trouble with fractions
Part of this work was supported by a grant from the European Commission
Contents
CHAPTER 1. Field of investigation and Research problem
...
1
The importance of statistical information in doctor-patient communication
...
2
The subjective character of ―objective‖ numbers: Biases in judgment and decision making
...
4
Communicating numerical information in health-care: The importance of studying format effects
...
6
Object of investigation: A specific format effect in risk communication of prenatal genetic testing results
...
7
The specific case of Down syndrome
...
8
CHAPTER 2. Existent literature on the issue
...
11
Risk as analysis and Risk as feelings
...
13
What is known on comprehension of different ratio formats
...
15
SECTION 1. When 10 in 100 is higher than 1 in 10:
Results in favour of neglect of the denominator
...
19
1.1 Explanations and experimental evidences under main theories
...
19
1.1.1 The different number of counterfactual alternatives prompted
...
19
1.1.2 Experiential over rational system prevalence: Ratio-bias literature
...
21
1.1.3 Denominator neglect as an inclusion illusion: Fuzzy-trace theory
...
27
1.2 Other interpretations ...
36
1.2.1 Pseudo-multiplicity: Perceived Diversity Heuristics
...
36
1.2.2 Exemplar availability: Exemplar-cuing theory
...
38
1.2.3.2 Imaginability/images of the numerator, but not affectively tagged
...
43
1.3 Elicitation of health-state utilities, of numerical frequencies of social facts,
and of the probability of harm posed by a mental patient if discharged are
influenced by Ratio-bias
...
45
SECTION 2. When 1 in 10 is higher than 10 in 100:
Results in favour of neglect of the numerator
...
49
The group-diffusion effect and the reference group effect
...
49
From group diffusion to Ratio-bias
...
52
CHAPTER 3. Empirical studies
...
55
Rationale for research studies
...
56
Methodological considerations
...
57
Preliminary brief characterization of the basic constructs investigated
...
57
SECTION 1, or A new bizarre systematic effect
...
66
Study 1.1
...
66
Study 1.2
...
75
SECTION 2, or Boundaries of the bias
...
81
Study 2.1
...
83
Study 2.2
...
102
Study 2.3
...
111
Study 2.4
...
116
Study 2.5
... 118
Study 2.6
...
122
SECTION 3, or An affective explanation?
...
130
Study 3.1
...
131
Study 3.2
...
134
SECTION 4, or Test of two practical interventions
...
140
Study 4.1
...
141
Study 4.2
...
146
Study 4.3
...
150
CHAPTER 4. Conclusions and General discussion
...
155
BIBLIOGRAPHIC REFERENCES
...
167
CHAPTER 1
The importance of statistical information in doctor-patient communication
Increasing emphasis has been placed on the way doctors communicate risk to patients (Alaszewski and Horlick-Jones, 2003; Calman, Bennett, and Coles, 1999; Gigerenzer and Edwards, 2003; Gigerenzer, Gaissmaier, Kurz-Milcke, Schwartz, and Woloshin, 2007; Paling, 2003). Indeed, clinicians are increasingly recommended- even mandated by law- to help patients make informed-medical decisions by paying more attention to risk counselling (Weinstein, 1999; Schwartz, Woloshin, and Welch, 1999). Since the Seventies, the paternalistic doctor-centred model of the physician-patient communication (in which the physician was chargeable with the decision of which information was relevant, and had the sole decision making responsibility) has been progressively abandoned for a more patient-oriented approach, until a deliberative model (shared-decision approach) has become customary in most of the advanced countries (Emanuel and Emanuel, 1992). In the latter model, the physician‘s role resembles that of a friend or teacher, whose main aim is ―to help the patient determine and choose the best health-related values that can be realized in the clinical consultation. To this end, the physician must delineate information on the patient‘s clinical situation and then help elucidate the types of values embodied in the available options‖1
(p. 2222). In this new relationship-centred approach, patients as well are asked an active role both in the definition of the health problems they face, and in the evaluation of possible solutions.
Following a progressive acquisition of a prerogative state, the patient has become the main entitled holder of her/his wellbeing, and as such s/he ought to be provided with all necessary means to actuate a conscious decision in matters of health. For these reasons, doctors and technical health staff have the duty of ensuring that every choice is active and conscious, that informed consent is reached on all medical risks and on the selected practices to contrast these risks (Santuososso, 1996). As Hall et al. (2007, p. 564) have maintained, ―This is particularly evident in the context of genetic counseling, with a summary of 51 national and international guidelines for genetic counseling emphasizing the importance of patient autonomy and non-directive information giving in this context (http://www.eurogentest.org/web/info/public/unit3/guidelineswp12.xhtm, accessed on 02.10.2006)‖. Moreover, this right of acquiring information has been not only identified as important to patients (e.g., people with cancer disease), but also as one of their primary unmet needs, especially concerning that of quantitative information like probabilities of risky events (Feldman-Stewart, Kocovski, McConnell, Brundage, and Mackillop, 2000). In order to take a decision concerning their health, people might need to know the frequency of occurrence of a given outcome in their population of reference (for example, how many people out of the total
1 Not far from this idea is the concept of ―libertarian paternalism‖ advocated by Sunstein and Thaler
of those going vacating in a tropical country each year did contract malaria despite having been vaccinated against it). In agreement with this unmet need, for instance, Feldman-Stewart et al. (2000, p. 228) reported from one of their studies that ―four of the top five items (of 59) identified by men with early-stage prostate cancer as necessary for their treatment decisions concerned the chances of a particular event ‗happening‘‖.
The inclusion of statistical facts on the condition of interest or on the treatments available to cure it, in a risk message does not only represent an inescapable step of a medical communication carried out in accordance with the guidelines in force, but the important value of numbers in communications of statuses and actions entailing uncertainty has been also recognised by health communication and cognitive psychology scholars. It seems, that mentioning the likelihoods in a numerical format can increase trust and belief in and comfort with the risk information (Gurmankin, Baron, and Armstrong, 2004). Some studies indeed found that statistical information increases comprehension (Marteau, Saidi, Goodburn, Lawton, Michie, and Bobrow, cited in Visschers, Meertens, Passchier, and de Vries, 2009). However, it has been widely questioned whether patients really understand and ultimately use these values (see the literature on people‘s general innumeracy, e.g. Gigerenzer, Gaissmaier, Kurz-Milcke, Schwartz, and Woloshin, 2007, or Lipkus, Samsa, and Rimer, 2001).
The subjective character of “objective” numbers: Biases in judgement and
decision making
Albeit the apparent objectivity of their character, raw numbers are not exempt from issues of multiplicity of interpretation. Several numerical formats can be chosen to express a given probability of an outcome- the most common of these being percentages (e.g., 5%), single-event probabilities (e.g., 0.05), frequencies2 (e.g., 5 in 100), and absolute frequencies (e.g., 600); selecting one of those rather than another in risk communication is not without consequences. Research by Brase (2002) in a direct comparison of these expressions found that individuals felt them different in the degree of clarity and how easy they were to be understood; in particular, frequencies3 (―simple frequencies‖, as he termed them) were in the first position,
that is, the simplest and clearest among formats judged, followed by percentages (i.e., relative frequencies), and then by absolute frequencies based on very large reference classes, while single-event probabilities were in the last place (as they were perceived as the hardest to be understood).
Format effects trace back to the pioneering work summarised in Prospect Theory (Kahneman and Tversky, 1979), demonstrating the crucial role of the superficial format in which information is presented for its assessment, and for the decisions elaborated on its basis. Through all their works on experimental observations, Kahneman and Tversky proved systematic deviations from what theoretically expected according to the ―format invariance principle‖4
argued by supporters of the classical economic theory. In other words, they showed that even those changes in the options, that from the point of view of the apparently ―perfectly rational agent‖, could be considered irrelevant would instead move her/him away from the optimal decision, namely that theoretically predicted by the normative model. For example, as ―framing effect‖5
illustrated (Kahneman and Tversky, 1982), simply altering the frame (in positive/negative terms) of a scenario can change preferences for one course of action rather than another, even if the options have quantitatively identical outcomes. In the studies on the
2 Frequency can be defined as ―the rate at which something happens, for instance the number of times it
happens in a particular period of time‖ (Collins COBUILD English Language Dictionary, 1996), or ―the number of times an event or character occurs in a given sample.‖ (Oxford English Dictionary, 2006). In the case of the present thesis, the sample of the last definition mostly consists of a certain group of people.
3 These findings are consistent with studies of statistical reasoning, which indicate that frequency
presentations facilitate understanding of data (Cosmides and Tooby, 1996; Hoffrage and Gigerenzer, 1998) due to the suggestion that evolution and experience have been equipping people better to understand probabilistic information expressed as frequencies in a population, rather than as probabilities for an individual. In fact, Gigerenzer and Hoffrage (1995) argued that frequencies are the natural way in which people think about probabilities. However, results of studies investigating the same issue have not been consistent, hence existent research does not establish the superiority of frequency formats.
4
Such property implies that every economical agent behaving in accordance with axioms of the Utility Theory (Von Neumann and Morgenstern, 1947) will not modify her/his preferences on the basis of the presentation format of a choice problem.
5 Framing itself can be defined as ―presenting ‗logically equivalent‘ information in different ways‖
Asiatic Disease Problem (Tversky and Kahneman, 1981), two groups of participants were asked to role-play to be asked to find the best solution to face a strong epidemic, and having to choose between two urgency sanitary programs. One of them guaranteed a partial albeit sure result, while the other had a given likelihood of solving completely the problem, but could also be a complete failure. The problem was presented in two versions, namely in one the outcomes were described in terms of people saved, while in the other in terms of victims. Despite according to the invariance principle no differences had to be expected in participants‘ choices, results showed an inversion of preferences from one version to the other. Indeed, in the version expressed in terms of saved people, the majority of participants preferred the sure option, while on the contrary, in the version where the consequences of the program were described in terms of lost lives, the majority of participants expressed a preference for the risky option. Thus, authors‘ work showed that individuals did not chose on the basis of a rational assessment of options -i.e., in terms of their expected value, as predicted by Utility Theory (Von Neumann and Morgenstern, 1947), but were instead prone to the influence of minor details (like the framing of options) of the problem description.
The investigation of the ―satisficing‖6 (Simon, 1979) rather than optimal behaviour, observed in the experiments of Kahneman and Tversky has been progressively extended to judgments under uncertainty of various events in diverse areas of everyday life. The research has been re-named the ―heuristic and biases‖ program, ―a territory that Herbert A. Simon had defined and named—the psychology of bounded rationality (Simon, 1955, 1979)‖ (Kahneman, 2003, p. 697). The portrait of the average individual resulting from such experimental analyses is that of an agent rarely following formal statistical rules in making decisions outside the laboratory. Rather, it is that of an individual whose evaluations, instead of being the result of formal and extensive algorithmic processing, are often based on a restricted number of simplifying heuristics. These ―rules of thumb‖ are successful most of the times, in other words they guide to an effective solution of problems by helping individuals reducing the complexity of certain issues (see, for instance, Gigerenzer, 2008). The same rules, however, can sometimes induce in errors, named biases by scholars. Heuristic processing, therefore, is ―positive‖, may reveal highly adaptive, especially when decisions are being taken in situations that are changing, uncertain, and dynamic. However, a wrong interpretation of this approach has been circulating for several years, where the use of heuristics has been identified as error-prone and leading to some systematic predispositions, namely the above mentioned biases.
Even objective numbers are subjected to heuristic evaluations. As such, while is true that rules of thumb applied to their evaluation might in some cases lead to the same result of
6Nobel laureate Herbert Simon coined the phrase ‗satisficing‘ to describe a decision making process that
formal calculations (but with advantages in terms of time and resources), it is inevitable that in other cases they lead to some distortions.
Similarly to other superficial features, the numerical presentation format used in probability communication has been advocated as a determinant characteristic capable of influencing people‘s judgments and decisions in situations of uncertainty. In other words, it has been recognized that even numerical presentation of a probability is subjected to ―framing manipulations‖. Its effects have been intensively studied in disciplines like decision making psychology (for a review of the effects of numerical and other formats in probability communication, see Visschers, Meertens, Passchier, and de Vries, 2009)7.
Communicating numerical information in health-care: The importance of studying
format effects
In the applied field of health-care, the issue of which numerical format is best to express a probability has a decisive importance from the point of view of informed choices, and of that of bringing about reductions in risky health behaviour, for instance. The point then is defining the term ―best‖. Three features must be considered at least: best understood (i.e., analytically meaningful), useful for judgment and decision making (i.e., affectively meaningful), best to reduce people‘s reckless health behaviours.
As stated above, communicating risk is not a choice for doctors but it is a mandatory act. Many are the areas of health care in which professionals need to provide risk information to patients to enhance their decisions; consider, for instances, some of the examples reported, among others, by Burkell (2004, p. 201): ―Women making decisions about hormone replacement therapy to treat menopausal symptoms‖, as they ―must understand and weigh the reduced risk of osteoporosis, cardiovascular disease, colorectal cancer, and Alzheimer's disease against the increased risk of breast cancer, myocardial infarction, cerebrovascular disease, and thromboembolic disease‖; ―Men choosing among options for the treatment of localized prostate cancer‖, as they ―want to know the likelihood of side effects associated with the treatment options before making their decision‖; or, ―participants in genetic counseling programs‖, as they ―must understand the risks associated with treatment and the meaning of a positive test result to make informed decisions about genetic testing‖. Not only, another case in which health professionals ought to communicate probability of a certain negative health-related outcome happening to laypeople is, for instance, that of the probability that a specific pattern of behaviour (e.g., smoking) will lead to a particular health problem (e.g., lung cancer).
7 The issues analyzed included, to quote only the most discussed, a) the difference between numerical and
Moreover, nowadays the number of situations in which health-care practitioners (i.e., medical doctors, nurses or medical attendants, or technical assistants like, for example, radiologists) must communicate risks has grown extraordinarily. Unbelievable advances in medical sciences, in understanding the human genome, beside the identification of the genetic errors indictable for diseases, are on the one hand making the human being feel safer, but on the other hand are leading to an increase in number for the situations endowing a certain degree of risk that ought to be communicated. Such apparent oxymoron corresponds to the idea, that if we have gained a much better knowledge on the mechanisms regulating our body thus making us able to better pursue health welfare, on the other hand the number of conditions and possible diseases we should be tested for has expanded incredibly, making us somehow potentially ―more at risk‖. Furthermore, an additional factor adding up to the number of risky situations is represented by the increasing use of biochemical, imaging, and genetic screening tests that all provide probabilistic information.
In all those situations, determining the effects that different numerical information related to risk and presented by health care professionals have on people‘s understanding of probability, their judgments (e.g., Ancker, Senathirajaha, Kukafka, and Starren, 2006; Cuite, Weinstein, Emmons, and Colditz, 2008; Feldman-Stewart,Brundage, Van Manen, and Svenson, 2004; Lipkus, 2007), and even behavioural intentions (e.g., Marteau, Kidd, Cook, Michie, Johnston, Slack, et al., 1991) is of crucial importance.
Object of investigation: A specific format effect in risk communication of prenatal
genetic testing results
Among features deemed responsible of biases in perception, specific object of study
of
the present dissertation has been the use of different ratio8 formats in risk communication of prenatal diagnosis results. In particular, work has focused on the possible influence that those expressions of the probability related to screening9 for Down syndrome could have on
prospective parents‘ perceptions. While for a brief general outline of the peculiarities regarding the context of decision (i.e., antenatal screening for Down syndrome) we refer to the paragraph here following, for what concerns the elucidation of what is meant with ―the use of different
8 From the strictly mathematical point of view, the concept of ―ratio‖ is broader than that of ―fraction‖, as
while a fraction always illustrates a ―part to whole‖ relationship (e.g., 3/4), ratios can be used to denote a much larger set of relationships, such as part to part (e.g., 3 : 1) and whole to part (e.g., 4 : 3). Despite the present object of interest would have been more appropriately described by the term ―fraction‖, the term ―ratio‖ was chosen to refer to it since most of the relevant literature on the phenomenon at study appeared to have used that expression, e.g., ―Ratio-bias‖ (Denes-Raj and Epstein, 1994). Thus, by ratio formats we meant, verbalized frequency expressions like, for instance, ―1 in 5‖, ―3 out of 10‖, or ―2 out of every 20‖.
9 Broadly talking, ―Screening is a systematic attempt to identify from apparently healthy individuals,
ratio formats‖ the next sentences will do. When one wants to express a given probability (e.g., 10%) through a ratio format, s/he can in principle state it by means of several equivalent ratios, whose numbers at the numerator and denominator will hence be (comparatively) both smaller or larger (i.e., N in N*X, or N1 in N1*X, or N2 in N2*X ...and so on). To exemplify, one can say,
that a person has a 1 in 10 probability of having a child with Down syndrome, or, for instance, that such person has a 10 in 100 probability of having a child with Down syndrome. Does choosing one expression (i.e., 1 in 10, or N in N*X) rather than the other (i.e., 10 in 100, or N1
in N1*X, for instance) make any difference in terms of how those values are perceived by the
receiver of the communication, in the specific, the person at risk? Answering such question was the main aim of the present work.
Research originated from both a theoretical and a practical question. From a theoretical point, studying format effects is one way to validate theories on how the mind processes information about risks. These theories will be described in Chapter 2. From a practical side, format effects, as said before, have concrete consequences on judgments and decisions of individuals regarding health issues, therefore their effect could be used to promote health care.
The specific case of Down syndrome
Antenatal screening offers the possibility of preventing the birth of infants with serious congenital abnormalities, such as neural tube defects, Down syndrome, chromosome abnormalities, genetic diseases and other conditions (such as spina bifida, cleft palate, Tay Sachs disease, sickle cell anaemia, thalassemia, cystic fibrosis, and fragile x syndrome). The purposes for prenatal diagnosis are not only, as commonly thought, to give the parents the chance to abort a foetus with the diagnosed disabling condition, but also, in case they want to carry the pregnancy to full term, to enable timely medical or surgical treatment of a risky condition before or after birth; moreover, to give prospective parents the chance to ―prepare‖ psychologically, socially, financially, and medically for a baby with a health problem or disability, or for the likelihood of a stillbirth. Also, having this information in advance of the birth means that healthcare staff has the possibility to better prepare itself for the delivery of a child with a health problem.
age and any combination of maternal serum markers: she will be described as screen positive if her risk value exceeds a specified cut-off value (normally, 1 in 250/270). If an elevated risk of chromosomal or genetic abnormality is indicated by the non-invasive screening test, a more invasive but diagnostic technique may be employed to gather more information (e.g., amniocentesis or Chorionic Villus Sampling).
Despite accepting or declining prenatal screening should be the result of an informed choice, namely one based on ―relevant information‖ and ―consistent with the decision-makers‘ values‖ (van den Berg, Timmermans, Knol, van Eijk, de Smit, van Vugt, et al., 2008), it is often not so. For instance, in their study on a sample of 1159 pregnant women offered either maternal serum screening test or the nuchal translucency measurement, van den Berg and colleagues found that only 68% of the choices could be defined actually ―informed‖. Indeed, women interviewed frequently showed lack of one (or even both) of the dimensions common in all definitions of informed choices, that are sufficient knowledge (i.e., of, broadly speaking, ―characteristics of condition for which screening is being offered, characteristics of the screening test, and implications of the possible test results‖, ibid., p. 322), and value inconsistency (i.e., ―disagreement between the abstract ideals guiding their behaviour and the actual behaviour itself‖, ibid.). Counseling a couple about the Down syndrome screening result in a simple yet comprehensive way is a particular challenge for many health care providers. Indeed, a critical question is whether pregnant women and her partner have an adequate grasp of the numerical information delivered, and yet several studies have demonstrated women‘s poor understanding of Down syndrome screening (Eiser, 1998; Godyer, Barratt, and Irwig, 2000; Thornton, Hewison, Lilford, and Vail, 1995).
CHAPTER 2
The initial part of this chapter will briefly review the ―risk as analysis and risk as feelings‖ theory on how human beings comprehend risk (Slovic, Finucane, Peters, and MacGregor, 2004) on which basis the investigation was grounded. Then, the thesis will start focusing on the specific issue of research, namely how the use of superficially different but mathematically equivalent ratio formats (e.g., N in N*X or N1 in N1*X) affects the magnitude
perception of the probability which those ratios convey.
With this aim, first of all the existent research will be briefly summarised, which focused on the impact that the type of ratio format (1 at the numerators vs. other formats) used for probability presentation has on its comprehension, particularly when related to a medical domain.
Afterwards, research will be reviewed, that analysed the effect of ratio format on perceived probability and decision making. Indeed, starting in the 1990s, various empirical studies considered whether different ratio formats denoting the same objective probability -e.g., 1 in 10 vs. 10 in 100, or more generally ―1 in X‖ vs. ―N in (N*X)‖- could impact choice and subjective evaluations. These studies delivered contrasting results.
On the one hand, mainly Prof. Seymour Epstein and colleagues suggested that people tend to neglect denominators, preferring for example a lottery offering a 10 in 100 chance of winning to another offering a 1 a 10 chance of winning. That phenomenon, dubbed the ―Ratio-bias‖ effect
(e.g., Denes-Raj and Epstein, 1994; Denes-Raj, Epstein, and Cole, 1995) under the Cognitive-Experiential Self-Theory (CEST, Epstein, 1991, 1993) and attributed to the prevalence of the experiential system over the rational one, has been instead ascribed to a ―denominator neglect‖
under Fuzzy-trace theory (Reyna, 1991). The ability of such phenomenon to influence people‘s behaviour in different fields of application will be illustrated in Section 1 of the present chapter. On the other hand, Yamaguchi (1998) suggested that when people are asked to evaluate a threat, whose probability is kept constant, they tend to rate the threat as less probable when the number of individuals at threat increases, for example if it will affect 10 persons in 100, rather than 1 person in 10. That phenomenon, dubbed the ―group-diffusion‖ effect, seemed to suggest that
people neglect numerators rather than denominators, in single ratio presentation. Group- diffusion effect will be illustrated in Section 2 of this chapter.
Risk as analysis and Risk as feelings
Recently, a comprehensive theory on how human beings perceive and evaluate risk has been formally elaborated by Slovic, Finucane, Peters, and MacGregor (2004) in the wake of dual-process approaches of thinking, knowing, and information-processing in cognitive psychology (Chaiken and Trope, 1999; Kahneman and Friederick, 2002; Sloman, 1996), and modern theories of neuroscience (e. g., Damasio, 1994). A growing volume of researches and findings is increasingly being emphasizing the existence of two different essential ways in which individuals would comprehend risk, namely an ―experiential‖ way- also addressed as
―System 1‖ by Khaneman (2003) and scholars- and an ―analytic‖ way- also addressed by some
as the ―rational‖ system (e.g., Epstein, 1991) or the ―deliberative‖ system, and by others as ―System 2‖, see Kahneman (2003) and scholars10
. Both systems would be fundamental for risk processing and evaluation: while the analytic system uses normative rules and formal logic, as well as algorithms and probability calculus, the experiential system uses intuition, instincts, gut feelings, and emotions (for a review of properties of the two systems, and of the different interpretation of their facets, see section 1.1.2 and beginning of section 1.1.3 of the present chapter). Both systems would be continually active, and constantly interacting in what has been characterized as ―the dance of affect and reason‖ (Finucane, Peters, and Slovic, 2003; see also, Slovic et al., 2004). Anyway, the prevalence (for several reasons, which will be tackled throughout the present work) of one way of reasoning over the other can influence the type of ―answer‖ given by our mind to information and problems.
According to Slovic and colleagues, and similarly argued by Kahneman (2003), and Reyna (2004), not only the experiential system is the default system, necessary even to guide the analytic system to work properly (i.e., to ―do the right thing‖), but it also possess elements of rationality at same strength of the analytic system. In other words, the experiential system would be the basic fundamental way in which human beings encode and evaluate information. This interpretation is, however, very recent. Indeed, after a period (i.e., with the neoclassic approach) in which only analytic thinking was considered legitimate object of research, exactly because of being the ―epitome of rationality‖ (Slovic et al., 2004, p. 313), emotions11
re-gained
10
Otherwise differently stated, all the terms referring to one of the two systems will be used interchangeably to denote that system in the present thesis. When a specific theory will be described, instead, the terms used will be those employed by the author/s.
11A commonly accepted definition describes emotion as a vast disposition to answer that can include a
the role they should always have been entitled to, namely that of being one of the most important determinants of perception and behaviour. Previously, emotions were deemed as interfering with reason (hence somehow lowering the quality of the reasoning process).
In decision making, the revival of attention for the role of emotions approximately coincided with the conceptualization of ―the affect heuristic‖, a mental shortcut consisting in
reliance on the affective feelings12 generated by a stimulus for evaluation and decision (Finucane, Alhakami, Slovic, and Johnson, 2000; Slovic, Finucane, Peters, and MacGregor, 2004). Authors incorporated the affect heuristic in their view of individuals‘ information-processing about risk (e.g., Slovic et al., 2004). The way in which affect heuristic works can be approximated as follows: in evaluating a situation, people would form mental images (that are influenced, sometimes even determined, by individual differences and by the type of task); such images have connotative emotions, namely conscious or unconscious tags associated with objects and events representations from the past, negativity or positivity of which the person would consult in order to gain an evaluation of the stimulus. The affect rule of thumb would substitute the systematic analysis of each of the stimulus attributes, thus increasing rapidity and automaticity of the process which, indeed, are also typical features of affective responses. As other mental shortcuts, the affect heuristic would be employed particularly in those situations where decision is very difficult (because, for instance, the individual does not know the necessary rules to address the problem considered, or does not possess the abilities to do so), where temporal limits impede a complete analysis of all the features of the situation (i.e., time constraints), or where the information available is not sufficient. As in other cognitive domains, judgments and evaluations about risk are strongly related to affect.Indeed, even in probability judgments, the affect experienced or imagined during information-processing may serve as a cue for the assessment of the probability magnitude (this point will be addressed again in Section 3 of Chapter 3).Such assessment, anyway, might be influenced even by the degree to which the ratio format is understood, an issue that will be examined in the next section.
to work as a guide to decision (affect as motivation and as ―common currency‖), see Peters, Lipkus, and Diefenbach (2006).
12
What is known on comprehension of different ratio formats
Doctors use the “1 in X” format more than “N in NX” formats
Frequency formats are extensively used in communications about risk. For instance, in a study by Michie, Lester, Pinto, and Marteau (2005) on the transcripts of 115 U.K. genetic consultations, 47% of the 492 risk expressions conveyed by practitioners were numbers (the remaining 52% were words, i.e., verbal probability statements); among those, the large majority was constituted by so- called ―probabilities‖ (i.e., proportions or rates) rather than percentages (32% vs. 15%). Anyway, studies also reveal, that among ratio formats genetic risk is more frequently expressed as population size required for 1 expectant event (e.g., 1 in 8) than in what is considered the customary scientific format by experts in the field, namely rates of events per unit of population exposed to the risk, commonly 100 or 1000 (e.g., 12 in 100, in Miron-Shatz, Hanoch, Graef, and Sagi, 2009). Miron-Shatz and colleagues, for instance, stated that conveying prenatal screening test results in a ―1-in-N‖ format in written communications (i.e., e-mails) to women is ordinary practice in Israel.
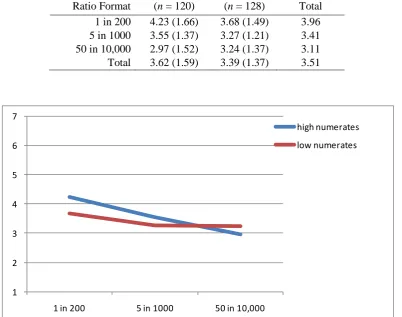
The preference of genetic counsellors for proportions with a numerator of 1 and shifting denominators in the expression of risks (e.g., 1 in 200 instead than 5 in 1000, for a .005 likelihood) has been found not to represent the implementation of a rule drawn from scientific literature attesting advantages of such format in any aspect supposed to improve the communication of risk. Rather, such inclination results from health practitioners‘ spontaneous attempt to make the population size statistics more understandable to the public (Hook, cited in Grimes and Snively, 1999). Despite health professionals‘ good intentions, some evidences seem to disprove their conventional wisdom that laypeople understand proportions better than rates, arguing instead for a facilitating effect of the customary scientific format over population size required for 1 expectant event. Such evidence will be briefly reviewed, and the issue of comprehension examined, in the next paragraph. Nevertheless, it is apparent that both formats are employed, as the following examples can show. For instance, in a report of the probability figures that a 37-year-old woman should weight in order to be able to make an informed selection about prenatal tests (i.e., between a screening test for chromosomal anomalies and a diagnostic test), Gates (2004) implicitly affirmed that what she named ―probabilities‖ (i.e., ―1 in X‖ expressions) and ―frequencies‖ (i.e., ―N in 1000‖ expressions) are the two normal ways of presenting statistics adopted in landmark epidemiologic studies of the prenatal diagnosis field. The same idea- leaving apart taxonomy issues (i.e., authors define ―1 in X‖ formats as ―proportions‖, and ―N in 1000‖ as ―rates‖) - is found in Grimes and Snively (1999).
The advantage of rates over proportions in facilitating the performance of
mathematical operations in medical decision making
Few studies have sought to determine which formats make it easier for laypeople to perform operations of the kind that might arise in medical decision making. Most of them have investigated only a single (but fundamental) operation: the ability of identifying which out of two probabilities is larger. One informative example is represented by the study of Grimes and Snively (1999), where that skill was assessed when the probabilities were expressed either as rates of disease per unit of population exposed to the threat (in that case, per 1000 people) or as proportions with 1 at the numerator and shifting denominators. To this aim, researchers presented women in numerous Obstetrics and Gynaecology outpatients clinics with a questionnaire asking, among other unrelated questions, to circle the higher out of two probabilities of having a bladder infection- both probabilities were expressed either in so-called rates (i.e., frequencies with a 1000 denominator: 2.6 in 1000 and 8.9 in 1000) or in so-called proportions (i.e., the population size required for the expected event, that is a frequency with a 1-in-n format: 1 in 112 and 1 in 384)13.Each individual assessed both formats, but the order in which they appeared was randomly varied to avoid sequence effects. Participants correctly identified the numerical risk expressions conveying the larger magnitude in 56% (1-in-n format) and 73% (rate format) of cases, thus showing a significant higher comprehension of rates than of proportions- the number of ―don‘t know‖ answers was always around 20% showing that many women did not understand either format. Superiority of the rate format was consistent across all primary languages, age groups, and levels of education of participants tested in the study.
The result was confirmed on a more representative sample constituted of laypeople (both women and men) by van Vliet, Grimes, Popkina, and Smith (2001). Using the same experimental design, and the same probability expressions of the previous study, but this time referred to the risk of Down syndrome, researchers replicated the finding of a superiority of the rate format on the 1-in-n format in terms of accuracy; its advantage on the other format (76.2% vs. 72.3% correct answers, respectively) was nevertheless slightly lower than that found by Grimes and Snively.
In another investigation, where percentages were tested apart from rates and proportions, the 1-in-n format confirmed its problematic character as it showed as the one creating most difficulties for the performance of mathematical operations of the types that might be encountered in discussions of risk (Cuite, Weinstein, Emmons, and Colditz, 2008). In that
13 The risk values corresponded to the rates of Down syndrome at birth at the maternal ages of 35 and 40
study, three waves of individuals (in total: 16,133) recruited online on a cancer-related site voluntarily took part in the research. Each wave received two experimental problems- each of which required the performance of one out of six mathematical operations (Wave1: compare and halve; Wave2: triple and add; Wave3: trade-off and sequence)- both expressed in one of the three formats under study (i.e., %, 1-in-n, and rate). All questions were presented as if they were hypothetical statements pronounced by a physician. In most cases, in risk levels used for each type of problem, probabilities were of an exactly equal size or nearly the same in the three formats (e.g., 1 in 24, 4 in 100, and 4%)14. A significant main effect on performance (i.e., answer accuracy) was detected for the type of format on all risk operations. Despite there was not one single format being best for all the six operations, each of them was best for at least one operation. The 1-in-n format was significantly better than the percentage format for the compare operations, but similar to the rate format (two results both in conflict with Grimes and Snively‘s). However, when scores were averaged across all operations, the 1-in-n format performed worse than the other two. Indeed, the mean accuracy rate for the 1-in-n format was only 45%, a significantly smaller result than the one obtained for frequency (55%), and than that obtained for percentage (57%) - the two were very similar.
Further confirmation of laypeople‘s difficulties with the 1-in-n format can be retrieved also in results of semi-structured interviews and correspondence with twenty women who had contacted Support after Termination for Abnormality (SAFTA), a British registered charity supporting parents who have foetal abnormalities diagnosed (Green and Statham, 1993). Among these women, who overall reported a high degree of anxiety before and after having received results of serum-screening for Down syndrome or amniocentesis results, at least eight had difficulty in applying a 1-in-n risk to their own pregnancy. The difficulty in grasping the meaning of 1-in-n expressions has been showed even in a study that reported individuals‘ preference for a combined percentage and frequency scale rather than a 1-in-n scale (Woloshin, Schwartz, Byram, Fischhoff, and Welch, 2000). Among available scales, the 1-in-n scale was judged as the hardest to be used. This last consideration, summed up with both the proved higher difficulty found with 1-in-n formats in performing operations normally required in health decisions, and with people‘s preference for other formats, made Woloshin and colleagues suggest medical personnel to avoid the 1-in-n format in risk communication.
Anyway, as documented in the first part of this section, doctors and health-care professionals appear to make large use of such format. Hence, an analysis of the effect that different ratio formats expressing a probability have on people‘s perceptions of the probability itself, becomes then of crucial importance. Studies performed, as well as theories that have been put forward to
14 The risk value used in the ―1-in-n‖ case was sometimes approximated so not to require harder
SECTION 1.
When 10 in 100 is higher than 1 in 10: Results in favour of neglect of
the denominator
1.1
Explanations and experimental evidences under main theories
1.1.1 The different number of counterfactual alternatives prompted
The first research (chronologically) arguing for different evaluations of a ratio according to the magnitude of the numbers employed at its numerator and denominator can be considered that of Miller, Turnbull, and McFarland (1989). These authors observed a systematic tendency in their study participants to ―[...] judge the same probability of an unlikely event as lower when the probability is presented in the form of a ratio of smaller rather than of larger numbers‖ (Denes-Raj and Epstein, 1994, p. 820). Their work was based on Kahneman and Miller (1986)‘s Norm theory whose proposers had claimed, that the judgment of an event‘s ―normality‖ (i.e., the judged degree of its occurrence in a given population) would reflect its capacity to evoke representations of similar events. In other words, according to Kahneman and Miller the easier it is for the individual to mentally simulate alternative ways to that event‘s occurrence (i.e., to produce post-outcome counterfactual thinking), the less normal, namely the less distributed, that event must be in the population of reference. Conversely, theorists foresaw that the more difficult it is to mentally simulate other ways in which an event could have occurred, the more normal (i.e., likely to happen) that event must be in the population of reference.
smaller numbers than when it had been expressed through a ratio of larger numbers (between-subjects design). For instance, in Study 1, the scenario was,
Imagine that you have a young child who loves chocolate chip cookies. Imagine further
that you buy your cookies in packages that include oatmeal as well as chocolate chip cookies.
Your child‟s practice is to go to the cookie jar and select the chocolate chip cookies, leaving the
oatmeal ones to go stale. One day you think of a strategy to cope with the situation. You tell
your child to close his eyes before he reaches into the jar, taking whichever cookie he grabs. He
agrees to this and heads to the kitchen and the cookie jar. The jar contains 1(10) chocolate chip
cookie(s) and 19(190) oatmeal cookies. Shortly, he comes back, exclaiming that he did just what
you said and he selected a chocolate chip cookie. (Miller et al., Study 1, p. 583)
Participants expressed higher judgments of suspiciousness that the child in the scenario had peaked when he could successfully draw one of the favourite cookies from a jar if the latter had been described as containing 1 of the favourite cookies (and 19 of the non-preferred type) rather than 10 of the favourite cookies (and 190 of the non-preferred type), despite the equivalence of the proportions of the preferred biscuits in the two jars. Results can be read as showing, that people thought that the child‘s chance to have extracted one of the desired cookies without peeking was larger in the case of the urn containing 10 desired cookies out of 200 than in that of the urn containing 1 desired biscuit out of 20. Nevertheless, looking in detail at the experimental material, it must be noticed that participants‘ judgment did not actually refer to a ratio expression (e.g., 1 out of 20) where one of the two terms (i.e., the numerator) conveyed the instances of the event occurring (1, in the example) and the other (i.e., the denominator) the total number of possible events (e.g., 20). Rather, such evaluation had stemmed from an odd evaluation15. Actually, out of the five studies, only three (Study 3, 4, and 5) employed experiential stimuli asking participants to evaluate a ratio, while in the case of Study 1 and 2, the comparison between the absolute instances of the event occurring (e.g., 1) and those of the event not occurring (i.e., 19) was made explicitly salient. Thus, it could have been the case that the mental representations elicited in the two sub-groups of studies in Miller, Turnbull, and McFarland differed- three reasons supporting this affirmation are considered here below. First of all, the mental operation normally prompted when evaluating an odd could be a comparison between favourable and unfavourable chances (e.g., 1 against 19); instead, that prompted in the case of a ratio could reasonably be the comparison between the positive chance of the event occurring and the total of cases (e.g., 1 out of 20). Secondly, the two messages might differ in terms of the effort required to the reader to build up a comprehensive picture of
15
the possible occurring outcomes and their respective chances. Indeed, while in the ―odd-communication‖ version of the problem, people are explicitly given descriptions of both sides of the coin16, in the ―ratio-communication‖ version only one of those descriptions is provided17. What these observations point at is, as Denes-Raj, Epstein, and Cole (1995) have observed in their article, that only the type of stimuli used in Study 3, 4, and 5 of Miller and colleagues‘ work can be considered as properly in line with later research on the Ratio-bias phenomenon (see 1.1.2). Thirdly, some other factors could intervene to influence the degree of suspiciousness for the unlikely event occurring that not necessarily would be involved in the probability assessment of the magnitude of the same probability.
1.1.2
Experiential over rational system prevalence: Ratio-bias literature (CEST
Theory)
Taking a start from the aim of proving experimentally the dual nature of their new information-processing system theory (Epstein and Pacini, 1999), research on the so-called ―Ratio-biaseffect‖ (Denes- Raj and Epstein, 1994) has been flourishing during all the nineties
even independently from its original aims, up to the point to acquire a reason on its own. Indeed, the expression ―Ratio-bias” was coined by Denes-Raj and Epstein (1994, p. 820) to refer to the systematic tendency to ―[...] judge the same probability of an unlikely event as lower when the probability is presented in the form of a ratio of smaller rather than of larger numbers‖ (for the first time described by Miller, Turnbull, and McFarland, 1989). The appearance of such systematic tendency has later been attested with written vignettes illustrating improbable outcomes (e.g., Alonso and Fernández-Berrocal, 2003; Denes-Raj, Epstein, and Cole, 1995), but mainly through a game of chance created for the specific purposes of the research (e.g., Denes-Raj et al., 1995; Kirkpatrick and Epstein, 1992; Pacini and Epstein, 1999-a). Through the game, participants‘ choice between two options was demanded. Each option consisted in an urn containing balls in two colours (e.g., some white and some red), and described18 as offering a given numerical probability of winning (or losing) associated with the withdrawal of a ball of
16
As it will be highlighted throughout the next paragraph (i.e., 1.1.2), this happens in many stimuli employed in empirical studies under CEST approach.
17 An additional operation is required to those people who want to figure out the other ―side of the coin‖;
in other words, imagining the complementary event to that described requires the person to compute the probability that the event will not occur, i.e. the difference between the total possibilities and those favourable to the event whose chances had been originally described. The requirement of additional mental operations could have significant consequences on the way the message is elaborated (depending on, for instance, participant‘s degree of motivation, her/his abilities to compute, or the amount of available time) hence this operation could be performed or not. This, in turn, will likely influence the answer given to the task.
18 If we exclude the only case where participants took part to the game in the laboratory (i.e. Kirkpatrick
one specific of the two colours (e.g., the red one). Alike in those other studies that have been classified as ―heuristic‖ problems (Reyna and Brainerd, 2008; for a distinction between ―heuristic‖ and ―non-optimal‖ problems, see the same source), urns offered the same proportion of balls of either colour, but they differed in the total number of balls of each colour they contained, with one urn (described as the ―large‖ one, in some studies) displaying a larger number of balls than the other (the ―small‖ one). As an example of the typical game of chance proposed to participants, the following scenario illustrates:
Imagine that someone is presented with two bowls of folded tickets. One bowl
contains 1 ticket marked “winner” and 9 blank tickets. The other bowl contains 10 tickets marked “winner” and 90 blank tickets. The person must draw one
ticket (without peeking, of course) from either bowl: if he/she draws a ticket
marked “winner” he/she wins $8.00, otherwise he/she wins nothing and the
game is over.
Even though the odds are identical for the two bowls, research shows that
many people have a distinct preference as to which of these bowls they would
rather draw from. Which bowl do you think most people choose in this
situation?
(Kirkpatrick and Epstein, 1992: Exp. 2, p. 539)
As it is even openly remarked in the scenario, options in the problem offered an identical chance (.1) of withdrawing the target item. The rational answer would have been indifference toward the two urns, but that answer was generally achieved only when participants answered from their own point of view (i.e., ―self-perspective‖), or from the point of view of a ―completely logical person‖ (see Amsel, Close, Sadler, and Klaczynski, 2009; Epstein and Pacini, 2000-2001). Instead, when answering from the point of view of ―the average person‖ (e.g., Kirkpatrick and Epstein, 1992) or in other words, of ―most people‖ (e.g., Denes-Raj, Epstein, and Cole, 1995; Pacini and Epstein, 1999-a), individuals tended to express a preference for the bowl offering a larger absolute number of winning tickets- in the example above, the 10/100 one19. Overall, findings supported Epstein and colleagues‘ predictions, as the self and logical perspectives always resulted in prompting a similar, mostly unbiased, answer (i.e., no preference between the two urns) while the others-perspective made the bias occurr (see Alonso and Fernández-Berrocal, 2003- for the heuristic pair; Denes-Raj et al., 1995- Study 3; Epstein
19The device of eliciting people‘s choices according to multiple views had been adopted in this and other
and Pacini, 2000-2001, for standard instructions- i.e., textual without visualisation ; Kirkpatrick and Epstein, 1992; Pacini and Epstein, 1999-a except the lose condition in self perspective). The interesting point is, why would people manifest a systematic irrational tendency to prefer the option whose probability of success is stated in ratios of larger numbers, to another option whose probability of success is, instead, stated in ratios of smaller numbers, despite having understood the two options mathematical equivalence? The explanation offered by scholars referred to the CEST (Cognitive-Experiential Self-Theory, Epstein, 1991, 1993, 2003) relating such bias to a prevalence of ―feelings‖ over ―reasoning‖. On the basis of study participants‘ feedback after the task completion, authors described the bias as resulting from the rational understanding of the mathematic equivalence of the options in the scenarios, but at the same time the subjective (experiential) feeling that the odds described by the ―large‖ urn were more favourable than those described by the ―small‖ one20
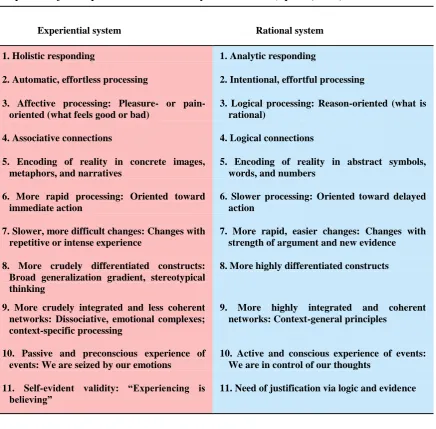
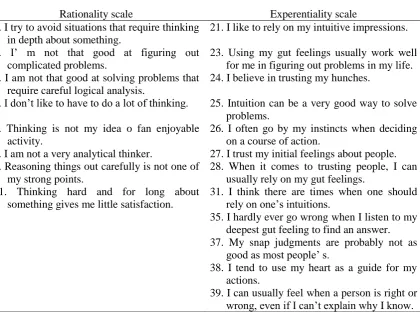
(e.g., Kirkpatrick and Epstein, 1992). CEST is the ―dual process‖ theory comprehensively developed by Epstein, such theory, in line with the other so-called ―dual system‖ approaches in judgement and decision making (e.g., Chaiken and Trope, 1999; Kahneman and Friederick, 2002; Sloman, 1996) assumed the existence of two alternating modes of thinking, an experiential and a rational one21. The attributes of the two system, listed in Table 1 as reported by Epstein (2003), can be summarised in author‘s words as: operating ―in a manner that is preconscious, automatic, rapid, effortless, holistic, concrete, associative, primarily nonverbal, and minimally demanding of cognitive resources‖ (Epstein, 2003, p. 5) for what concerns the experiential system, and operating ―in a manner that is conscious, analytical, effortful, relatively slow, affect-free, and highly demanding of cognitive resources‖ for what concerns the rational system (Epstein, 2003, p. 6). The two systems, operating in parallel and sometimes interacting, would not always be synchronous, but occasionally would let their inherent qualities become apparent to people, who instead normally are only aware of what appears to them to be a single process. According to authors, when the experiential system becomes robustly engaged and prevails on the rational one (either because the latter did not intervene to correct possible dissonant tendencies, or because, despite intervening, the appropriate rule to the situation had been bypassed, or instead could not be retrieved), Ratio-bias would occur. A more detailed description of the principles determining the irrational tendency is contained in the section above.
20 Indeed, authors (e.g., Pacini and Epstein, 1999-a) considered that commonly experienced contradictory
sensation whose arousal is spontaneous and hard to contrast as a clear evidence for the existence of the two distinct ways of information- processing inside the same person hypothesised under CEST (i.e., experiential and rational ways of information-processing).
21
Table 1
Comparison of the experiential and rational system attributes (Epstein, 2003)
Features of the experiential system causing Ratio-bias
Denes-Raj, Epstein, and Cole (1995) explained the bias as due to two attributes of the experiential system, i.e., the ―concretive principle‖, and the ―small-numbers effect‖; a third facet, the ―affirmative-representation principle‖, was further added to their theoretical explanation to account for people‘s choice behaviour when a negative outcome was involved (Pacini and Epstein, 1999-a).For what concerns the first principle, in authors‘ words (p. 307), ―[…] the experiential system encodes and better comprehends numerosity than ratios because single numbers are more concrete than relations between numbers‖. Thus, the concretive principle would be responsible for people‘s strong tendency to be overly influenced by absolute numbers rather than by ratios, because of their more concretive nature (congruent with the concrete way in which experiential system would represent information). This facet is in line with what foreseen by the numerosity heuristic (Pelham, Sumarta, and Myakovsky, 1994),
Experiential system Rational system
1. Holistic responding 1. Analytic responding
2. Automatic, effortless processing 2. Intentional, effortful processing
3. Affective processing: Pleasure- or pain-oriented (what feels good or bad)
3. Logical processing: Reason-oriented (what is rational)
4. Associative connections 4. Logical connections
5. Encoding of reality in concrete images, metaphors, and narratives
5. Encoding of reality in abstract symbols, words, and numbers
6. More rapid processing: Oriented toward immediate action
6. Slower processing: Oriented toward delayed action
7. Slower, more difficult changes: Changes with repetitive or intense experience
7. More rapid, easier changes: Changes with strength of argument and new evidence
8. More crudely differentiated constructs: Broad generalization gradient, stereotypical thinking
8. More highly differentiated constructs
9. More crudely integrated and less coherent networks: Dissociative, emotional complexes; context-specific processing
9. More highly integrated and coherent networks: Context-general principles
10. Passive and preconscious experience of events: We are seized by our emotions
10. Active and conscious experience of events: We are in control of our thoughts
11. Self-evident validity: “Experiencing is believing”
according to which people attribute a judgment of quantity (or probability) to a stimulus on the basis of the number of units into which the stimulus is divided, without completely taking into account determinant variables like the size of the units. In the case of Ratio-bias, the tendency to focus on absolute numbers rather than ratios could have lead participants to perceive the probability as higher when presented in larger rather than smaller numbers, as individuals would concentrate mainly on numerators (10 > 1) without taking enough account of the reference population out of which their value is expressed (100, 10).
In the second principle posited by scholars (i.e., the small-numbers effect) it is assumed, that the experiential system comprehends smaller numbers better than larger ones, because the former are more concrete than the latter, in the sense they are easier to visualize, a conventional test of concreteness (Paivio, 1991). Advocates of the CEST explanation (e.g., Pinto-Prades, Martinez-Perez, and Abellán-Perpiñán, 2006) had been again called Pelham and others (1994)‘ findings upon as proofs in favour of the fact that probability conveyed in (comparatively) smaller numbers would be easier to interpret than that in (comparatively) larger numbers. In such an experiment, participants were required to express their preferences for one out of two lotteries: one where all individuals received one ticket or one in which all individuals received 10 tickets. Results indicated that people had a preference for the ―large‖ lottery (the one where they received 10 tickets) if they were told the number of participants was 1 million, but they did not show preferences for either lottery if the number of participants they were communicated was only two people. It appeared as when the lottery was described through lower numbers ―they (could) better realize that the chances are the same in both lotteries‖ (Pinto-Prades et al., 2006, p. 120).
For what concerned the third principle of the experiential system responsible for Ratio-bias, instead, some actual evidences exist in support of their authors‘ explanation. That principle would explicate people‘s behaviour in those situations where a negative event is involved (e.g., the possibility to lose some money in association to the withdrawal of a red jellybean, in the case of the game of chance). In such instances, authors affirmed, that people would normally reverse their focus of attention compared with those situations involving a positive outcome- in the study of Kirkpatrick and Epstein (1992), a large number of participants reading a scenario entailing losses, indeed, reported to have focused on the desirable white jellybeans rather than on the undesirable red ones during the decisional process. Authors claimed this shift of attention would happen for in general affirmation is more concrete than negation: ―[…] the experiential system can more easily encode positive representations (e.g. drawing a desirable white jellybean) than negative ones (e.g., not drawing an undesirable red jellybean)‖ (Pacini and Epstein, 1999-a, p. 310).
of events occurrence from the representations encoded in the experiential system, namely generalisations from past emotionally significant experiences (Kirkpatrick and Epstein, 1992). For instance, authors argued, that because life is full of experiences in which, when facing the probability of ―1 in a large number‖ of a given event, that event does not occur in fact (e.g., statistics on winnings at the lottery), people might have learned to classify the corresponding expressions as conveying the probability of an event that rarely takes place. Hence, people would judge the probability in an ―1 in X‖ format (where X is a sufficiently large number) as smaller than the equivalent one conveyed in ratios of larger numbers (i.e., a format not making use of small numbers like 1 in the numerator). This principle is of particular relevance for the empirical work that will be illustrated in the present dissertation, hence it will receive further attention, especially in the conclusive chapter.
The mechanisms through which the three principles illustrated would interact to produce the Ratio-bias effect have been elucidated with clarity under the CEST theory, and will be reviewed in the following section.
Outcome valence, probability value, and effect intensity
example, the 30% condition read: ―Consider a condition in which there are 30% red jellybeans in both trays. That is, there are 3 red jellybeans and 7 white jellybeans in the small tray, and there are 30 red jellybeans and 70 white jellybeans in the large tray‖ (Pacini and Epstein, 1999-a, p. 314). Participants asked from which tray they (and most people) would prefer to select a jellybean (small/ large/ no preference) generally confirmed the bias in others-perspective, with the relationship between probability magnitude and size of the effect represented by a negative linear trend in win conditions. Ratio-bias effect was significant for probability values of 10, 30 and 50%. A positive linear trend was found, instead, in lose conditions. Ratio-bias effect was significant for probability values of 50, 70, and 90%. Despite from a self-perspective the effect showed the same trend, differences in people‘s declared choices did not reach significance for most probability levels in win conditions, but they did reach it in lose conditions, with a significant preference for the option stated through ratios of large numbers for probability values of 50, 70, and 90% (Pacini and Epstein, 1999-a).
1.1.3 Denominator neglect as an inclusion illusion: Fuzzy-trace theory
The paternity of the discovery of those tendencies that like Ratio-bias are due to a neglect of the denominator, has been openly claimed by theorists of the ―Fuzzy-trace‖ approach: ―The ratio-bias phenomenon is a rediscovery of the same phenomenon that occupied researchers in the probability judgment literature beginning in the 1970‘s (for the most recent review of that literature, see Reyna and Brainerd, 1994)‖ (Reyna and Brainerd, 2008, p. 95). That phenomenon, generally dubbed ―denominator neglect‖ 22, refers to, in Okan, Garcia-Retamero, Cokely, and Maldonado (in press, p. 6)‘s words, ―people‘s tendency to pay too much attention to numerators in ratios (i.e. the number of times a target event has happened) and insufficient attention to denominators (i.e. the overall opportunities for it to happen; Reyna, 2004; Reyna & Brainerd, 2008)‖.
Similarly to CEST (and other dual-process theories), Fuzzy-Trace Theory of reasoning, or the ―New Intuitionism‖ as its founders have sometimes defined it (e.g., Reyna, 2004; Reyna and Brainerd, 1995) postulated the existence of two parallel modes of representing information23 about the world in memory, namely, a vague qualitative intuitive gist-based one and a detailed quantitative verbatim one. Under this approach, though, it is further maintained that people have a preference for reasoning and performing decisions on the basis of the vague gist of information even in those cases in which verbatim (e.g., quantitative) detail of the it is
22
Or ―numerosity effect‖ as dubbed by Reyna and Brainerd (2008, p. 96).
23 In opposition with most dual theories of reasoning and decision making, but similarly to CEST theory,
remembered. More precisely, individuals would normally favour to operate as closely as possible on categorical gist, namely, on the least precise representation that can be used to accomplish the task at hand. The logic of this preference would reside in its ―economical‖ nature ―[…] from an evolutionary perspective, in that many routine tasks requires only a fuzzy representation‖ (Wolfe, 1995, p. 86). Indeed, as Wolfe précised, ―Just because subjects can discriminate differing quantities, and can act on those discriminations, it does not follow that problems are invariably solved by processing information at the highest possible resolution‖ (Wolfe, 1995, p. 86). According to authors under this approach, the explanation of Ratio-bias would reside exactly on the fuzzy processing preference just described. Ratio-bias would be nothing else than a reasoning error occurring from the wrong comparison of numerical parts to numerical wholes (Brainerd and Reyna, 1990; Reyna, 1991), likewise the other problems defined as ―inclusion illusions‖ (e.g., base-rate neglect, the conjunction and disjunction fallacy, or overestimation of small probabilities). Indeed, Reyna (quoted in Barbey and Sloman, 2007, p. 258) observed that ―problems in the inclusion illusions family have two-dimensional structures, with one dimension (the subset-subset) being salient and easy to process and the other (the subset-superordinate set), which is crucial to solution, being obscure‖. Denominator neglect would be a product of the structure of information, as ―processing focuses on the subset mentio