R E S E A R C H
Open Access
Developing measures on the perceptions of the
built environment for physical activity: a
confirmatory analysis
Jennifer L Gay
1*, Kelly R Evenson
2, Jessalyn Smith
3Abstract
Background:Minimal validity evidence exists for scales assessing the built environment for physical activity. The purpose of this study was to assess the test-retest reliability and invariance of a three-factor model (Neighborhood Characteristics, Safety/Crime, and Access to Physical Activity Facilities) across gender, race, geographic location, and level of physical activity.
Methods:To assess measurement invariance, a random sample of 1,534 adults living in North Carolina or Mississippi completed a computer assisted telephone interview that included items examining perceptions of the neighborhood for physical activity. Construct level test-retest reliability data were collected from a purposeful sample of 106 participants who were administered the questionnaire twice, approximately two weeks apart. Fit indices, Cronbach’s alpha, Mokken H and Spearman correlation coefficients (SCC) were used to evaluate configural and co/variance invarianc,e and intraclass correlation coefficients (ICC) were used to assess reliability.
Results:Construct test-retest reliability was strong (ICC 0.90 to 0.93). SCC for Neighborhood Characteristics and Crime/Safety were weak with Access (0.21 and 0.25), but strong between Crime/Safety and Neighborhood Characteristics (0.62). Acceptable fit and evidence of measurement invariance was found for gender, race (African American and White), geographic location, and level of physical activity. Fit indices consistently approached or were greater than 0.90 for goodness of fit index, normed fit index, and comparative fit index which is evidence of configural invariance. There was weak support of variance and covariance invariance for all groups that was indicative of factorial validity.
Conclusions:Support of the validity and reliability of the three-factor model across groups expands the
possibilities for analysis to include latent variable modeling, and suggests these built environment constructs may be used in other settings and populations.
Background
With the advent of ecological models, physical activity research now frequently incorporates built environment measures [1]. While there is a clear cross-sectional asso-ciation between built environmental characteristics and physical activity, the majority of research is conducted at the item level [2]. Analysis of individual items ignores the potential underlying themes or constructs that may exist, particularly in perceptual measures. Further, item-level analysis precludes the use of multiitem-level modeling
techniques that can account for the latent constructs inherent in measures of beliefs and attitudes [3].
Several scales exist that measure perceptions of the built environment for physical activity among adults [4-7]. However, little evidence is available regarding the validity or reliability of these measures. The most com-monly reported measurement property is test-retest reliability [2]. To date few studies report the construct validity, including factorial validity, of perceptions of the built environment for physical activity. Construct valid-ity is necessary for operationalizing variables and making inferences. Factorial validity is a type of construct valid-ity that applies to the structure of how latent, or under-lying, constructs are measured using scales of multiple * Correspondence: [email protected]
1
Division of Behavioral Sciences and Health Promotion, University of Texas School of Public Health, Brownsville, TX, USA
Full list of author information is available at the end of the article
items. Each item on a scale should strongly relate to one latent construct and weakly relate to any other con-structs being measured [8].
In 2005, Evenson and McGinn [6] developed a ques-tionnaire for adults examining perceptions of the built environment for physical activity using the framework of Pikora et al [9] for perceptions around walking and cycling. The framework included the following physical environmental domains: destination, functionality, aes-thetic, and safety. The destination feature relates to the availability of public and private facilities. The function-ality feature reflects the physical attributes of the street and path that make up the fundamental structural aspects of the local environment, such as the type and width of the street and the volume, speed, and type of traffic. The aesthetic feature included both streetscape (e.g., trees, garden and street maintenance, cleanliness, pollution) and views (e.g., sights, architecture). The safety feature represents both personal safety and traffic safety. Item-level test-retest reliability was between 0.4 and 0.8 (intraclass correlation coefficients) among a sample of African American and White adults [6].
A recent examination of the psychometric properties of 26 items from this questionnaire in a separate sample of 479 White and African American adults, along with 21 items regarding convenience of physical activity facil-ities from Sallis et al. [10], revealed a five-factor struc-ture [11] different than the Pikora et al [9] framework. The Convenience items formed one factor, while 16 items from the Evenson and McGinn [6] questionnaire produced four factors: Crime/Safety, Neighborhood Characteristics, Access to Physical Activity Facilities (referred to as Access), and Places of Worship [11]. The internal consistency and scalability coefficients of these constructs indicated separate constructs. However, the sample size in this study and the relative homogeneity of the sample in terms of gender (86% female), race (68% White), 100% from four urban areas in South Car-olina, and level of exercise (92% did not meet physical activity recommendations) [12] precluded further testing of construct validity. Measurement invariance means that the same latent construct is being measured across groups. If a measure is invariant by group membership there is evidence that the measure is not biased, and allows for mean comparisons of the latent constructs. Confirming the factor structure and testing the mea-surement invariance are the next steps in establishing validity and reliability for the new factor structure described in Gay and Smith [11].
Using self-reported built environment data collected on a diverse sample of adults, this paper had two aims: 1) to confirm the factor structure, reliability, and scal-ability of three of the five factors (Neighborhood Char-acteristics, Crime/Safety, and Access) found in Gay and
Smith [11] by gender, race/ethnicity, physical activity level, and geographic location, and 2) to assess the test-retest reliability of these constructs. The Convenience and Places of Worship factors from the prior study were not tested since the confirmatory data did not contain the requisite items.
Methods
Sample
A telephone survey was conducted using a computer assisted telephone interview system (CATI) between January and July 2003 on a random sample of non-insti-tutionalized adults 18 years or older residing in two regions: Forsyth County, North Carolina and the metro-politan statistical area (MSA) of Jackson, Mississippi. Disproportionate sampling was used for Forsyth County in order to ensure representation for less urban areas outside of the Winston-Salem metropolitan area within the county. Respondents were randomly chosen in two stages: the first stage at the household level and the sec-ond stage at the individual level. Surveys were only con-ducted in English. Each participant provided consent and the study was approved by the Institutional Review Board at the University of North Carolina. Participants were paid $5 for their participation for each survey they completed. More detail is available elsewhere [6].
Reliability Interviews
Overall 1,662 men and women completed the survey. At the end of the interview, 1,448 adults were asked if they would be willing to participate in a retest interview. The remaining 214 adults were not asked to participate in a retest interview, because the interview quota was com-plete. Among these 1,448 adults, 76% (n = 1,104) agreed to be called back for the retest survey. Reliability infor-mation was collected from a 6% (n = 106) purposeful sample of women and men, to ensure approximately equal numbers of participants from both sites, by gen-der, and by race/ethnicity. The mean time between interviews was 16.8 days (standard deviation 4.2, range 9-30 days).
Questionnaire
Physical Activity
current physical activity guidelines [14]: Meeting guide-lines was calculated as moderate-intensity activity for at least 150 minutes per week, or vigorous-intensity activ-ity for at least 75 minutes per week, or a combination of the two (treating vigorous activity as twice as many min-utes as moderate-intensity activity) [15]. If participants did not report enough activity to meet guidelines they were classified as Not Meeting Guidelines.
Other Measures
All respondents were asked questions regarding age, gender, race/ethnicity, marital status, education, and employment. Employment was grouped into two cate-gories: employed or not employed (out of work, home-maker, student, retired, or unable to work). Self-reported height and weight were collected to calculate body mass index (BMI).
Analysis Plan
The analysis includes three factors from the exploratory analysis presented in Gay and Smith [11]: Neighborhood Characteristics, Crime/Safety, and Access. Thirteen items (Additional file: 1) were included in the confirma-tory factor analysis (CFA). Cronbach’s alpha [16] was calculated to assess internal consistency of the three fac-tors, and values greater than 0.70 were considered
acceptable. Mokken H, a measure of scale homogeneity,
was also used to verify the consistency of the three
fac-tors. AnHbetween 0.30 and 0.40 denoted a weak scale,
0.40 to .50 a moderate scale, and 0.50 to 1.00 a strong scale [17].
Intraclass correlation coefficients were calculated to examine the test-retest reliability of the three factors. Landis and Koch [18] suggest that agreement values are slight or poor if less than or equal to 0.20, 0.21 to 0.40 is fair, 0.41 to 0.60 is moderate, 0.61 to 0.80 is substantial, and almost perfect is greater than 0.80. Separate invar-iance tests were conducted by level of activity, gender, race/ethnicity, and geographic location. Geographic loca-tion was defined as Jackson, Mississippi, Winston-Salem, North Carolina, and Forsyth County, North Carolina, where the Forsyth County sample refers to all areas except Winston-Salem; those areas were both suburban and rural. Mokken scaling was conducted in R [19]. All other analyses were conducted using LISREL [20]. Statistics Used to Determine Measurement Invariance Measurement model fit holds if the goodness-of-fit index (GFI), normed fit index (NFI), and comparative fit index (CFI) are >0.90. The lower cutoff of 0.90 is used because this is not a well-established instrument that is in the formative stage. We also examine the standar-dized root-mean-square residual (SRMR; values <0.05), and the root-mean-square error of approximation (RMSEA; values less than or equal to 0.08 indicated
acceptable fit) and the expected cross-validation index (ECVI; values closer to zero).
Measurement invariance holds if the constraints make a significant improvement in the model fit. Typically, to
assess this, the Δc2 is examined between two nested
models. This value follows a c2 distribution with the
degrees of freedom equal to the difference of the degrees of freedom between the nested models. If mea-surement invariance holds, there will be a non-signifi-cant improvement in fit. However, some have questioned the usefulness of theΔc2[21,22] since it is a function of the sample size. Therefore,Δc2 may reject trivial differences in the model that do not have much practical importance. As a result, some practitioners recommend using the change of fit indices to determine whether measurement invariance holds. Hu and Bentler
[23] recommend ΔCFI, if it is within 0.01, indicating
evidence that measurement invariance holds. This is the criterion we used to assess measurement invariance. Types of Measurement Invariance
Configural invariance is tested to determine whether the conceptual framework is the same across different groups [24-26]. Here the pattern of the free and fixed loadings is the same across groups. Lack of evidence of configural invariance indicates that measurement invar-iance does not hold. Therefore, no further invarinvar-iance testing should be done [24-27]. Factor co/variance invar-iance is tested to determine if the varinvar-iance covarinvar-iance structure across groups holds. If both the factor var-iances and covarvar-iances are invariant, the correlations between the constructs are invariant as well. If error variances are invariant across groups, this indicates that the measurement error is invariant across groups. If it is found that measurement invariance holds, the items can be assumed to be equally reliable across groups.
Results
The sample consisted of 1,534 adults (mean age = 47.88 ± 17.05) living in Jackson, Mississippi (n = 741), Forsyth County, Winston-Salem, North Carolina (n = 379), and Forsyth County, North Carolina rural areas (n = 414). Nearly two-thirds of the sample was female (66.8%), 91.2% graduated high school and 42.6% attended at least 4 years of college. Just over half (61.7%) of partici-pants were employed. Less than half of the sample was married (45.7%) with the next largest group being those who were never married (20.4%). More than one-third (36.3%) of the sample was Black, non-Hispanic while the majority were White, non-Hispanic (58.8%). The
mean BMI for the sample was 27.2 kg/m 2 (SD = 6.26)
combination of moderate- and vigorous-intensity activ-ity per week).
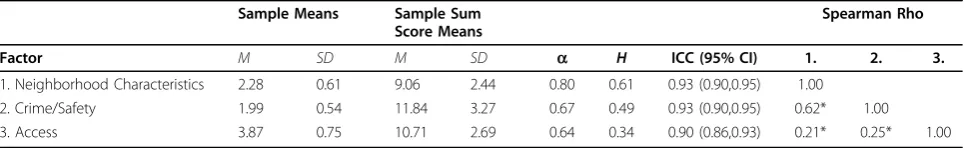
Means, standard deviations, and ranges for the three constructs are provided in Table 1. Sum score means are also provided as these constructs may be treated as indices. The Neighborhood Characteristics construct had acceptable internal consistency. The Crime/Safety and Access constructs had adequate internal consistency coefficients above 0.60. The MokkenHscalability coeffi-cient was strongest for Neighborhood Characteristics (0.61) indicating a strong scale. Crime/Safety had a
moderate scalability coefficient, and the Hfor Access
was weak.
Construct test-retest reliability was assessed using intraclass correlations (Table 1). All three constructs had high ICCs indicating almost perfect test-retest relia-bility [18]. There was a strong, positive correlation between Neighborhood Characteristics and Crime/ Safety, and weak positive associations with Access (all items were coded so that higher scores indicated a more favorable perception of the environment).
Group Invariance - Gender
Measurement models for all groups produced acceptable factor loadings. Table 2 provides model fit indices for each group in the invariance testing. For the GFI, NFI, and CFI, values above 0.90 indicate strong fit [28,29]. Since the model values were slightly lower than 0.90, there was evidence of fair model fit. Additionally, SRMR is only slightly above the 0.05 cutoff, in support of acceptable fit. The RMSEA was larger than ideal (0.05) cutoff, indicating less support of acceptable fit. With the exception of the GFI, the models have the same degree of fit across gender.ΔCFI (Table 3) indicated that there was some evidence of configural measurement invar-iance. However theΔ c2 indicated a lack of configural measurement invariance. Additionally, both theΔc2and
ΔCFI indicated the factor variances and covariances
between factors were the same for both males and females.ΔCFI indicated that there was some evidence of error variances being equivalent for both males and
females. As a result, since only the ΔCFI favored surement invariance, there was evidence of weak mea-surement invariance for males and females.
Group Invariance - Meeting Guidelines for Physical Activity
Based on the model fit information (Table 2), there was no indication that there was a lack of model fit. Both the group meeting physical activity guidelines and those not meeting guidelines had nearly the same model fit. For both groups, the SRMR and RMSEA were higher than the 0.08 cutoff. The results indicate that there was weak measurement invariance across activity levels since there was no change in the CFI (Table 4).
Group Invariance - Race/Ethnicity
As the GFI, NFI, and CFI were all close or above 0.90 (Table 2) there was strong indication that the measure-ment model fit for non-Hispanic Black individuals. However, for those identifying as non-Hispanic White, the model fit indices were lower than the values indica-tive of acceptable fit. The results (Table 5) indicate that there was weak measurement invariance across race since there was a slight change in the CFI. However, the
Δc2
and the ΔCFI support measurement invariance
across the loadings.
Group Invariance - Location
Model fit for Jackson, Mississippi, Winston-Salem, North Carolina urban, and Forsyth County, North Caro-lina (suburban/rural) is shown in Table 2. The model fit for individuals from Jackson, Mississippi was slightly better than for those from Forsyth County, North Caro-lina and Winston-Salem, North CaroCaro-lina. There was an indication that the measurement model fit for these locations since for all locations the GFI, NFI, and CFI met or approached 0.90. The RMSEA was higher than desirable for all locations. The results indicated that there was weak measurement invariance across all loca-tions (Table 6) as the p-values were small and theΔCFI was small. With the slight change in theΔCFI for factor
Table 1 Sample Means (M), Standard Deviations (SD), Sum Score Means, Cronbach’sa, MokkenH, Intraclass Correlation Coefficients (ICC) with 95% Confidence Intervals (CI), and Spearman Rho Correlation Coefficients for the Three Factor Model (N = 1,534)
Sample Means Sample Sum
Score Means
Spearman Rho
Factor M SD M SD a H ICC (95% CI) 1. 2. 3.
1. Neighborhood Characteristics 2.28 0.61 9.06 2.44 0.80 0.61 0.93 (0.90,0.95) 1.00
2. Crime/Safety 1.99 0.54 11.84 3.27 0.67 0.49 0.93 (0.90,0.95) 0.62* 1.00
3. Access 3.87 0.75 10.71 2.69 0.64 0.34 0.90 (0.86,0.93) 0.21* 0.25* 1.00
*p < .0001
Table 2 Measurement Model Fit for Gender, Activity Level, Race/Ethnicity, and Geographic Location Invariance Tests c2
GFI SRMR NFI CFI RMSEA ECVI Critical N
Gender
Male 319.70 0.76 0.08 0.87 0.89 0.11 1.02 104.29
Female 647.54 0.87 0.08 0.86 0.87 0.12 1.08 91.87
Meeting Guidelines for Physical Activity
Not Meeting Guidelines 363.14 0.91 0.07 0.90 0.91 0.10 0.75 138.96
Meeting Guidelines 500.57 0.91 0.08 0.89 0.90 0.09 0.68 147.42
Race/Ethnicity
White 325.66 0.89 0.09 0.86 0.87 0.11 0.85 116.66
Black 817.78 0.92 0.07 0.90 0.90 0.09 0.65 150.53
Geographic Location
Forsyth County, North Carolina - suburban/rural 294.92 0.89 0.08 0.86 0.88 0.10 0.93 116.72
Jackson, MS 380.09 0.92 0.06 0.90 0.91 0.09 0.67 157.75
Winston-Salem, North Carolina - urban 283.95 0.90 0.09 0.87 0.90 0.10 0.91 121.30
GFI - Goodness-of-fit index; SRMR - Standardized root mean square residual; NFI - Normed fit index; CFI - Comparative fit index; RMSEA - Root mean square error of approximation; ECVI - Expected cross-validation index
Table 3 Gender Invariance Testing c2
ν CFI NNFI ECVI Δν Δc2 p-value ΔCFI
Baseline 927.238 124 0.877 0.845 1.056
Factor loadings 979.258 134 0.877 0.857 1.049 10 52.020 <0.001 0.000
Var/cov 987.478 140 0.876 0.862 1.046 6 8.220 0.220 0.001
Errors 1034.223 153 0.870 0.867 1.081 13 46.745 <0.001 0.006
CFI - Comparative fit index; NNFI - Normed fit index; ECVI - Expected cross-validation index
Table 4 Meeting Guidelines for Physical Activity Invariance Testing c2
ν CFI NNFI ECVI Δν Δc2 p-value ΔCFI
Baseline 863.666 124 0.904 0.879 0.712
Factor loadings 907.756 134 0.900 0.884 0.727 10 44.09 <0.001 0.004
Var/cov 921.734 140 0.899 0.887 0.732 6 13.978 0.0299 0.001
Errors 953.803 153 0.896 0.894 0.737 13 32.069 0.0023 0.003
CFI - Comparative fit index; NNFI - Normed fit index; ECVI - Expected cross-validation index
Table 5 Race/Ethnicity Invariance Testing c2
ν CFI NNFI ECVI Δν Δc2 p-value
ΔCFI
Baseline 1443.443 124 0.891 0.862 0.721
Factor loadings 1454.702 134 0.890 0.872 0.718 10 11.259 0.338 0.001
Var/cov 1463.356 140 0.890 0.877 0.717 6 8.645 0.195 0.000
Errors 1506.707 153 0.889 0.886 0.720 13 43.351 <0.001 0.001
CFI - Comparative fit index; NNFI - Normed fit index; ECVI - Expected cross-validation index
Table 6 Invariance Testing by Geographic Location (Jackson, Mississippi; Winston-Salem, North Carolina urban; and Forsyth County, North Carolina (suburban/rural; excluding Winston Salem)
c2
ν CFI NNFI ECVI Δν Δc2 p-value ΔCFI
Baseline 958.955 186 0.900 0.874 0.792
Factor loadings 1001.407 206 0.897 0.883 0.796 20 42.452 0.002 0.003
Var/cov 1039.906 218 0.892 0.884 0.814 12 38.499 <0.001 0.005
Errors 1166.810 244 0.882 0.887 0.852 26 126.903 <0.001 0.01
loadings, the locations exhibited some configural invariance.
Discussion
Measuring perceptions of the built environment for phy-sical activity has become more prevalent as the use of ecologic models increases in the physical activity domain [1]. Missing from much of the built environment litera-ture are validity tests of the self-report instruments. The purpose of this paper was the test the factor structure, reliability, and scalability of the three factors (Neighbor-hood Characteristics, Crime/Safety, and Access) found in Gay and Smith [11] using a larger confirmatory sam-ple from Evenson and McGinn [6]; we also examined the factorial validity of the constructs by level of physi-cal activity, gender, race/ethnicity, and geographic loca-tion using tests of configural invariance.
The means, standard deviations, and ranges for the Neighborhood Characteristics and Crime scales were similar to the values found in Gay and Smith [11], but the mean value for Access to physical activity facilities was higher in the overall sample for this study (3.87 ± 0.75) than in the exploratory study (2.16 ± 0.58). Regardless, the measurement model fit was acceptable in this study. Similarly the scales exhibited adequate reli-abilities for both internal consistency and test-retest reliability. The Mokken Hscalability coefficients were slightly higher in this study for Neighborhood Charac-teristics and lower for Crime, but still moderate-to-strong for both scales. The Neighborhood Characteris-tics scale is similar to the Neighborhood Environment Walkability Scale (NEWS) Traffic Hazards subscale identified in the Baltimore, Maryland [30] and Austra-lian samples [4]. The Crime scales from this study and from the NEWS studies contain many of the same items. The Access scale did not align with items from NEWS. While two of the three scales are similar, the NEWS focuses solely on walking behavior. The current study includes all forms of physical activity in the neigh-borhood. The differences in factor structures of this study and the NEWS may reflect perceptual variations based on type of activity.
The configural invariance was tested to examine the theoretical framework across gender, race/ethnicity, phy-sical activity group, and geographic location as the parti-cipants came from three distinct areas. There was weak measurement invariance for all group invariance tests and indications that the measurement model had accep-table fit based on the GFI, NFI and CFI. The RMSEA, generally less affected by large sample sizes, was larger than expected. However, the spectrum of fit indices indicated acceptable fit across all groups. The factor structures were the same as the a priori model resulting from the exploratory factor analysis [11]. While the
evidence is not as strong as desired, there is sufficient confirmation of the factors to conduct further validation studies using these scales. Future research may consider further instrument development and testing of the psy-chometric properties.
This study is unique as we have provided initial sup-port for the generalizability of the factor structure for perceptions of the built environment for physical activity across race/ethnicity, gender, level of activity, and per-haps most importantly geographic location. Given that the built environment, and therefore perceptions, can change by neighborhoods, cities, or rural or urban loca-tion, validity of the factor structure across geographically diverse areas encouraging. One possible implication of these findings is that this scale can be used to assess perceptions in various settings. As changing perceptions of the built environment may increase physical activity, these factors may be used to determine targets for built environmental change.
Limitations
The findings from this study should be taken within the context of several limitations. First, neither this sample nor the original exploratory paper had samples that included a large proportion of Hispanics or other races such as Asian or Native American. The survey and fac-tor structure should be tested in more diverse popula-tions and in other languages. Second, the version of the measure used in this study did not include the Conveni-ence or Places of Worship scales [10]. Therefore the Convenience and Places of Worship factors from the exploratory study [11] could not be tested. Finally, parti-cipants were asked to consider their neighborhood as the area within a 20-minute walk or one-mile from their home. While the purpose of the study and the built environment items was to capture physical activity near their home, participants may engage in physical activity in areas outside of these boundaries and indeed the measure of physical activity was more general. Our results may have been stronger for physical activity if we focused on physical activity also conducted within one mile of their home, as there may have been a disconnect between the perceptions of the neighborhood for activity and the amount of physical activity if the person is active outside of the neighborhood [31].
Conclusions
walking, not physical activity more broadly. We have explored the factorial structure and results indicate that the subscales apply to suburban/rural and urban set-tings, across race/ethnicity, gender, and whether or not physical activity guidelines were met. Having a general-izable factor structure expands the possible analyses beyond item-level variables and allows for the creation of factor scores for use in statistical analysis as well as in latent variable modeling. Using such thematic or latent analyses may allow for targeting specifics of groups of environmental characteristics that most impact physical activity. These strategies are used fre-quently in psychology and education domains, from which public health draws. The results from this study contribute to establishing validity for a perceptual mea-sure of the built environment for physical activity. Furthering the measurement of perceptions of the built environment may contribute to improved interventions and ultimately increased physical activity.
Additional material
Additional file 1: Items, by factor, included for invariance testing.
Acknowledgements
The authors would like to thank Fang Wen for her contribution. This study was funded by a grant to Kelly Evenson from the American Heart Association.
Author details
1Division of Behavioral Sciences and Health Promotion, University of Texas
School of Public Health, Brownsville, TX, USA.2Department of Epidemiology, Gillings School of Global Public Health, University of North Carolina, Chapel Hill, North Carolina, USA.3CTB/McGraw Hill, Monterey, CA, USA.
Authors’contributions
JLG conceptualized the manuscript, drafted the manuscript and conducted some statistical analyses. KRE designed the questionnaire, conducted the project from which the data are derived, and provided feedback on drafts of the manuscript. JS provided input on and conducted some statistical analyses, and provided feedback on drafts of the manuscript. All authors read and approved the final manuscript.
Competing interests
The authors declare that they have no competing interests.
Received: 18 May 2010 Accepted: 7 October 2010 Published: 7 October 2010
References
1. Sallis JF:Measuring physical activity environments: a brief history.Am J Prev Med2009,36:S86-S92.
2. Brownson RC, Hoehner CM, Day K, Forsyth A, Sallis JF:Measuring the built environment for physical activity: State of the science.Am J Prev Med 2009,36:S99-123.
3. Churchill JG:A paradigm for developing better measures of marketing constructs.J Mark Res1979,16:64-73.
4. Cerin E, Leslie E, Owen N, Bauman A:An Australian version of the neighborhood environment walkability scale: Validity evidence.
Measurement in Physical Education and Exercise Science2008,12:31-51.
5. Cerin E, Saelens BE, Sallis JF, Frank LD:Neighborhood Environment Walkability Scale: validity and development of a short form.Med Sci Sports Exerc2006,38:1682-1691.
6. Evenson KR, McGinn AP:Test-retest reliability of a questionnaire to assess physical environmental factors pertaining to physical activity.Int J Behav Nutr Phys Act2005,2[http://www.ijbnpa.org/content/2/1/7], Accessed 04/ 11/2007.
7. SIP 4-99 Research Group:Environmental Supports for Physical Activity Questionnaire.Prevention Research Center, Norman J.Arnold School of Public Health, University of South Carolina 2002 [http://prevention.sph.sc. edu/tools/docs/Env_Supports_for_PA.pdf], Accessed 04/12/2007 from. 8. Bollen K:Structural equations with latent variablesNew York: John Wiley &
Sons, Inc 1989.
9. Pikora T, Giles-Corti B, Bull F, Jamrozik K, Donovan R:Developing a framework for assessment of the environmental determinants of walking and cycling.Soc Sci Med2003,56:1693-1703.
10. Sallis JF, Johnson MF, Calfas KJ, Caparosa S, Nichols JF:Assessing perceived physical environmental variables that may influence physical activity.Res Q Exerc Sport1997,68:345-351.
11. Gay J, Smith J:Validity of a scale assessing the built environment for physical activity.Am J Health Behav2010,34:420-431.
12. Haskell WL, Lee IM, Pate RR, Powell KE, Blair SN, Franklin BA, Macera CA, Heath GW, Thompson PD, Bauman A:Physical activity and public health: Updated recommendation for adults from the American College of Sports Medicine and the American Heart Association.Med Sci Sports Exerc 2007,39:1423-1434.
13. Yore MM, Ham SA, Ainsworth BE, Kruger J, Reis JP, Kohl HW III, Macera CA: Reliability and validity of the instrument used in BRFSS to assess physical activity.Med Sci Sports Exerc2007,39:1267-1274.
14. U.S.Department of Health and Human Services:Physical Activity Guidelines for Americans.ODPHP Publication No. U0036 2008.
15. Loustalot F, Carlson SA, Fulton JE, Kruger J, Galuska DA, Lobelo F: Prevalence of self-reported aerobic physical activity among U.S. States and territories–Behavioral Risk Factor Surveillance System, 2007.J Phys Act Health2009,6(Suppl 1):S9-17.
16. Cronbach LJ:Coefficient alpha and the internal structure of tests.
Psychometrika1951,16:297-334.
17. Sijtsma K, Molenaar IW:Introduction to nonparametric item response theory Thousand Oaks, CA: Sage 2002.
18. Landis JR, Koch GG:The measurement of observer agreement for categorical data.Biometrics1977,33:159-174.
19. R Development Core Team:R Language Definition. (2.11.1 (05-2010) draft edition).The R Foundation for Statistical Computing 2007.
20. Jöreskog K, Sörbom D:LISREL. (8.80).Scientific Software International, Inc 2007.
21. Brannick MT:Critical comments on applying covariance structure modeling.J Organ Behav1995,16:201-213.
22. Kelloway EK:Structural equation modeling in perspective.J Organ Behav 1995,16:215-224.
23. Hu Lt, Bentler PM:Cutoff criteria for fit indexes in covariance structure analysis: Conventional criteria versus new alternatives.Struct Equ Modeling1999,6:1-55.
24. Cheung GW, Rensvold RB:Evaluating goodness-of-fit indexes for testing measurement equivalence.Struct Equ Modeling2002,9:233-255. 25. Horn JL, McArdle JJ:A practical and theoretical guide to measurement
invariance in aging research.Exp Aging Res1992,18:117-144. 26. Vandenberg RJ, Lance CE:A review and synthesis of the measurement
invariance literature: Suggestions, practices, and recommendations for organizational research.Organizational Research Methods2000,3:4-70. 27. Little T:Mean and covariance structures (MACS) analyses of
cross-cultural data: Practical and theoretical issues.Multivariate Behav Res1997, 32:53-76.
28. Bentler PM, Bonett DG:Significance tests and goodness of fit in the analysis of covariance structures.Psychol Bull1980,88:588-606. 29. Kline RB:Principles and practice of structural equation modelingNew York:
Guilford Press 1998.
31. Giles-Corti B, Timperio A, Bull F, Pikora T:Understanding physical activity environmental correlates: increased specificity for ecological models.
Exerc Sport Sci Rev2005,33:175-181.
doi:10.1186/1479-5868-7-72
Cite this article as:Gayet al.:Developing measures on the perceptions of the built environment for physical activity: a confirmatory analysis. International Journal of Behavioral Nutrition and Physical Activity20107:72.
Submit your next manuscript to BioMed Central and take full advantage of:
• Convenient online submission
• Thorough peer review
• No space constraints or color figure charges
• Immediate publication on acceptance
• Inclusion in PubMed, CAS, Scopus and Google Scholar
• Research which is freely available for redistribution