R E S E A R C H
Open Access
Cost-effectiveness of tailored print
communication, telephone motivational
interviewing, and a combination of the two:
results of an economic evaluation alongside the
Vitalum randomized controlled trial
Hilde M van Keulen
1*, Judith E Bosmans
2, Maurits W van Tulder
2, Johan L Severens
3,4, Hein de Vries
1,
Johannes Brug
5, Ilse Mesters
6Abstract
Background:The aim of the present study was to evaluate the cost-effectiveness of tailored print communication (TPC), telephone motivational interviewing (TMI), a combination of the two, and no intervention on two outcomes in adults aged 45 to 70, half of them having hypertension: increasing the number of public health guidelines met for three behaviors (physical activity and fruit and vegetable consumption), and impact on quality adjusted life years (QALYs).
Methods:Participants (n= 1,629) from 23 Dutch general practices were randomized into one of four groups, which received 4 TPCs, 4 TMIs, 2 of each (combined), or no intervention (control), respectively. The self-reported outcomes, measured at baseline and 73 weeks follow-up (7 months after the last intervention component), were difference in total number of guidelines met at follow-up compared to baseline, and number of QALYs
experienced over 73 weeks. The costs of implementing the intervention were estimated using a bottom-up approach.
Results:At 73 weeks follow-up participants showed increased adherence with 0.62 (TPC), 0.40 (TMI), 0.50
(combined), and 0.26 (control) guidelines compared to baseline, and experienced 1.09, 1.08, 1.08, and 1.07 QALYs, respectively. The costs for the control group were considered to be zero. TMI was more expensive (€107 per person) than both the combined intervention (€80) and TPC (€57). The control condition was most cost-effective for lower ceiling ratios, while TPC had the highest probability of being most cost-effective for higher ceiling ratios (more than€160 per additional guideline met, and€2,851 for each individual QALY).
Conclusions:For low society’s willingness to pay, the control group was most cost-effective for the number of QALYs experienced over 73 weeks. This also applied to the increase in the number of guidelines met at lower ceiling ratios, whereas at higher ceiling ratios, TPC had a higher probability of being more cost-effective than the TMI, combined or control conditions. This also seemed to apply for QALYs experienced over 73 weeks. More research is needed on the long-term efficacy of both TPC and TMI, as well as on how to increase their cost-effectiveness.
Trial registration:Dutch Trial Register NTR1068
* Correspondence: [email protected] 1
School for Public Health and Primary Care (Caphri), Department of Health Promotion, Maastricht University, the Netherlands
Full list of author information is available at the end of the article
Background
In 2005, cardiovascular disease (CVD) was estimated to account for 30% of the 58 million deaths from all causes worldwide [1] and to cost the EU economy€169 billion, with 62% of these costs being attributed to healthcare use, 21% to productivity losses, and 17% to informal care [2]. Yet CVD can largely be prevented by modifying risk factors such as unhealthy dietary behavior and phy-sical inactivity [1]. Evidence-based interventions target-ing these behaviors are thus clearly of vital importance.
Computer tailoring and motivational interviewing (MI) have been reported as promising interventions for chan-ging health behavior [3-5]. Computer tailoring has been defined as“a strategy intended to reach one specific son, based on characteristics that are unique to that per-son, related to the outcome of interest, and have been derived from and individual assessment” [6]. MI has been characterized as“a collaborative, person-centered form of guiding to elicit and strengthen motivation to change”[7]. However, few individual studies have actu-ally compared these two types of intervention [8-10]. In research that has been undertaken to date, computer tailoring and MI did not show statistically different effi-cacy levels in changing absolute physical activity and fruit and vegetable consumption [8,11] or in improving guideline adherence for physical activity (≥5 days/week for ≥30 minutes/day with a moderate intensity) [10,11]. However, in improving adherence to consumption guidelines for fruit (≥ 2 servings/day) and vegetables (≥ 200 grams/day), computer tailoring appeared to be more effective than MI [11].
Economic evaluations of health behavior change inter-ventions targeting physical activity and fruit and vegeta-ble consumption, including computer tailoring and MI interventions do exist [8,12-14], but are still scarce [15-18]. Information on the cost-effectiveness of such interventions is needed for evidence-based decision making when it comes to the large-scale implementation of computer-tailored and MI interventions [19,20]. The North Carolina Strategies for Improving Diet, Exercise, and Screening (NC STRIDES) study [8,21] did assess the cost-effectiveness of a computer-tailored print interven-tion, a telephone-delivered MI intervention and a com-bination of the two versus no intervention, but did not report a head-to-head comparison for the cost-effective-ness of computer tailoring versus MI [8].
This study reports on the economic evaluation of tai-lored print communication (TPC), telephone motiva-tional interviewing (TMI), and a combination of them in comparison with each other and with no interven-tion in improving the number of guidelines met for three different lifestyle behaviors, and the number of quality adjusted life years (QALY) experienced over a
period of 73 weeks in older adults with and without hypertension.
Methods
Study design
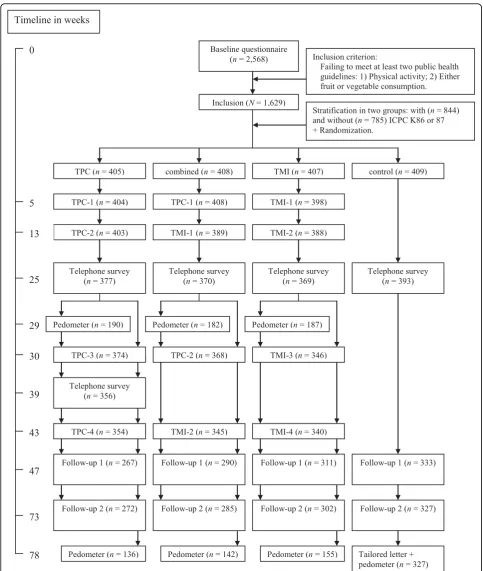
A detailed description of the Vitalum study can be found elsewhere [9]. It was approved by the Medical Ethics Committee of Maastricht University and the Uni-versity Hospital Maastricht, and is registered with the Dutch Trial Register (NTR1068). Vitalum participants (n = 6,420) were randomly selected from 23 general practices [22,23] in two southern provinces of the Neth-erlands (Limburg and Noord-Brabant). The following recruitment aims were used: aged 45-70; ± 50% diag-nosed by their GP as hypertensive according to the International Classification of Primary Care (ICPC code K86 or K87 for hypertension without or with organ damage respectively) [24-26]; ± 50% male; not partici-pating in other studies according to the GP database; and only one person per address. Hypertension status was included as a recruitment aim to check whether already having a risk factor for cardiovascular disease [27] moderates the intervention effects [9]. To ensure participants’ suitbility for the study, some of those selected were excluded (n = 875; 14%) by GPs before receiving an invitation (see for exclusion criteria [9]). After this exclusion, 5,545 participants (86% of the selection) received a Vitalum invitation from their GP explaining the content of the study and the group assignment. Those who consented to participate (n= 2,881) received a written baseline questionnaire. People who returned the baseline questionnaire were included in Vitalum if they failed to meet at least two out of three Dutch public health guidelines: those for physical activity and either fruit or vegetable consumption. In total, 1,629 (63%) of the 2,568 participants who filled out the baseline questionnaire were included in Vitalum. They were stratified based on their GP’s diagnosis of hypertension, then the first author used a computer pro-gram to randomly link them to one of the four groups: TPC, TMI, combined or control (see Figure 1 for the study design and timeline).
Interventions
Participants in the TPCgroup received four printed, tai-lored letters; the first was approximately 4 pages and addressed physical activity, the second and fourth were about 5 pages and focused on fruit and vegetables, and the third was around 3 pages and dealt again with physi-cal activity.
physical activity was preferred in the first interview, fruit and vegetable consumption was discussed in the second, and vice versa. The same procedure took place in inter-views 3 and 4. Interviewers received six 3-hour training sessions from two certified trainers, after which they were required to perform one TMI conversation with adequate integrity before being appointed. Eligible inter-viewers were students at Maastricht University. In total, 39 out of 53 students finished the training, 34 out of 39 performed with adequate integrity, and 16 out of 34 were contracted to work on Vitalum. They used an interview protocol, received additional information (e.g. general information about CVD), and after each inter-view wrote a summary to assist in the next interinter-view.
Participants in thecombinedgroup received two tai-lored print letters and two telephone motivational inter-views in turns. The first tailored letter was about 4 pages; the second was approximately 5 pages. The first letter and interview focused on physical activity; the second let-ter and inlet-terview on fruit and vegetable consumption.
Participants in thecontrolgroup received one tailored letter after the last follow-up questionnaire (at 73 weeks).
All tailored letters were computer-generated, i.e. parti-cipants’questionnaire answers were scanned and linked to messages filed in the computer. Hardcopy letters were mailed to participants’home addresses.
Participants from the three intervention groups received their four intervention components at 5, 13, 30, and 43 weeks after they had returned the baseline ques-tionnaire. A telephone survey held part-way through the study (week 25) was used to assess all participants’ behaviors and determinants in order to gather the most recent information for the computer-tailored interven-tion (i.e. the letters after week 25). Participants in the TPC group completed an additional survey (week 39) to collect the most recent data on their behavior and its determinants for the fourth tailored letter. Intervention effects were assessed using two postal questionnaires at 47 and 73 weeks follow-up.
Effects
Because Vitalum focused on the combination of three behaviors [9] and intervention costs cannot be separated for each behavior, the cost-effectiveness analysis focused on effects on overall outcomes. Outcomes therefore included the increase in the total number of public health guidelines met from baseline to 73 weeks follow-up, and the number of QALYs experienced over 73 weeks. Choosing for guideline adherence as the outcome variable for a cost-effectiveness analysis suits with health promotion policy goals because these are often formu-lated in terms of proportions of people adhering to guidelines [1,28-30]. Besides guideline adherence, we
chose QALYs as the outcome measure for the cost-effectiveness analysis because it has the advantage of allowing comparison of intervention effects focusing on different behaviors, domains or populations.
Guideline adherence was determined for physical activity and consumption of fruit and vegetables using self-report measures. The Dutch guidelines for these behaviors, which are based on international public health recommendations, were used to determine adher-ence. These guidelines recommend that adults consume at least two servings (approximately 200 grams in total) of fruit per day and 200 grams of vegetables per day, and engage in moderately intensive physical activity at least five days a week for 30 or more minutes a day [28,29,31-35]. Adherence to the guidelines for fruit and vegetable consumption was measured using the short questionnaire for fruit and vegetable intake [36]. Adher-ence to the physical activity guideline was measured using the modified CHAMPS physical activity question-naire [37], where the total hours per week of moderately intensive physical activity was calculated with a mini-mum of three metabolic equivalents as cut-offs [33,38]. Added to this was the summary question ("How many days a week do you cycle, engage in do-it-yourself activ-ities, do gardening, play a sport or engage in other strenuous physical activities for at least 30 minutes a day?”) of the Short QUestionnaire to ASsess Health-enhancing physical activity (SQUASH) [39]. The reason for this addition was that the modified CHAMPS does not allow for determination of whether participants were physically active with moderate intensity for at least 5 days a week. Participants were only coded as meeting the physical activity guideline if they were phy-sically active with at least moderate intensity for at least 2.5 hours a week according to the modified CHAMPS, and answered“five or more days”to the SQUASH sum-mary question [29,32,33].
Health-related quality of life was assessed with the RAND 36-item Health Survey 1.0 [40,41]. QALYs were calculated which combined quality and quantity of life in a single measure. Quality of life is expressed as the desirability or societal preference of the patient’s health state (a utility score) [42]. The SF-6 D [43] was used to estimate the utility of the health status reported by par-ticipants. QALYs were estimated by multiplying the average utility of baseline, and 47 and 73-weeks follow-up with the corresponding time, assuming a linear increase (or decrease) over time. Given this time hori-zon, the maximum QALY score is 1.4 (i.e. 73 weeks fol-low-up/52 weeks).
Costs
charges for TMI) and the costs of the time invested by participants were included. Other healthcare consump-tion costs were expected to be equal between the groups, and were thus not measured. The developmental costs of the interventions were calculated for the num-ber of eligible participants, and were therefore nil. Pro-tocol-driven costs (i.e. the costs of gathering data as part of a clinical trial) were considered to be sunk costs and not included in the cost-effectiveness analysis [44].
Costs were divided into fixed costs, that are costs unrelated to the number of participants (e.g. purchase of equipment), variable costs, that are cost related to the number of participants (e.g. postal charges), and total costs, that is the sum of the fixed and variable costs. Most prices were based on actual costs, i.e. invoices. In other cases, Dutch pricing guidelines [45] were used to determine the costs. Participant time was valued€8.54 per hour based on a shadow price (i.e. lost leisure time valued equally for each participant by using the hourly wage of a legally employed domestic cleaner) as recom-mended by Oostenbrink et al. [45], and included time spent on participating in the intervention (e.g. reading TPCs or engaging in TMIs). With regard to MI, training costs were calculated for the number of participants who can potentially be trained per counselor. Also, the hourly wage of motivational interviewers were based on the salaries of practice assistants (€31.87) because they are most likely to be used in delivering TMI if the inter-vention was implemented on a large scale. An overview of the total cost of Vitalum interventions is presented in Table S1, additional file 1.
Cost-effectiveness ratios
Incremental cost-effectiveness ratios (ICERs) were calcu-lated by dividing the difference in costs by the differ-ences in effects between two alternatives. Beginning with the least costly strategy, alternatives were compared with the next least costly strategy to calculate ICERs. In cases where dominance is reported, the dominating strategy is more effective and less costly than one of the other strategies. Extended dominance exists if the ICER for a given alternative is higher than that of the next, more effective alternative [44].
Statistical analysis
Independent t-tests were executed (SPSS version 15.0; SPSS Inc, Chicago, Illinois) to examine the differences in outcomes between the groups. Selective dropout was investigated by way of mixed logistic regression using PQL estimation with MLwiN software [46].
Dropout was the dependent variable, and group, time of measurement, group by time of measurement interac-tions, baseline age, gender, hypertension, region and education level were used as predictors.
Cost data were complete for all groups. To account for the skewed distribution of costs, nonparametric bias-corrected accelerated bootstrapping with 2000 replications was performed using Stata to estimate percentile-based 95% confidence intervals around the differences in costs [47].
The effect data were not complete; thus, multiple imputation techniques were used to result in five com-plete data sets [48]. Multiple imputation is the state-of-the-art method for handling missing outcomes [49,50]. The complete cases as well as the imputed cases were then analyzed to check for bias introduced by partici-pant dropout and missing data. The multiply imputed costs and effects were simultaneously bootstrapped in Microsoft Excel (2000 replications), and for each itera-tion net monetary benefits were calculated using various ceiling ratios, i.e. society’s willingness to pay for the effect [51]. The strategy with the highest net monetary benefit at a specific ceiling ratio was considered most cost-effective for that specific ceiling ratio. Cost-effec-tiveness acceptability curves were estimated to depict visually the probability that an intervention is more cost-effective than the alternatives at various ceiling ratios. The imputed analysis showed similar results to the analyses without imputation of missing values. The results of this imputed analysis are presented below, with the complete case analyses being mentioned only where they differ from the imputed analysis.
Results
Sample
Mean age of the sample was 57.15 years (SD = 7.13), half of the participants (52%) were classified as hyper-tensive due to the inclusion criteria, 55% were men, 54% had a low (less than secondary or vocational education) and 23% had an intermediate education level (secondary through pre-university education). There were no rele-vant differences in demographic variables and on adher-ence to separate guidelines between groups at baseline (allp> .05).
Results of the interventions with regard to absolute behavior change revealed that TMI, TPC and the com-bined intervention were equally effective; participants in these groups increased their level of physical activity (hours/week) and intake of fruit (servings/day) and vege-tables (grams/day) significantly more than those in the control group (Cohen’sdeffect sizes ranged from .15 to .18) [11].
40% (vegetable intake) of participants in the TPC group adhered to the guidelines; this was 24%, 50% and 36% for the TMI group, respectively, 29%, 48% and 34% for the combined intervention, and 23%, 44% and 28% for the control group. For adherence to the physical activity guideline, all three interventions seemed equally effec-tive, and the following ranking applied between groups: combined (OR compared to control = 2.08) > = TPC (OR = 1.82) > = TMI (OR = 1.57) > control (with‘ >’ representing a significant difference and‘> =’ represent-ing a borderline or no significant difference). With regard to adherence to the recommendations for fruit and vegetable consumption, TPC seemed to be the most effective intervention. The following ranking seemed to apply for fruit: TPC (OR compared to control = 1.78) > = TMI (OR = 1.44) > = combined (OR = 1.17) > = con-trol. For vegetables the ranking was TPC (OR = 1.73) > = TMI (OR = 1.32) = combined (OR = 1.31) > = control.
The mean number of baseline guidelines (range 0 to 3) met was 0.8 (sd = 0.7) in the TPC group, 0.7 (sd = 0.7) in the TMI group, 0.7 (sd = 0.7) in the combined group, and 0.8 (sd= 0.7) in the control group. Baseline differences between groups in mean number of guide-lines met were not significant (p= .52). Mean utility at baseline did not differ between groups (p = .48): 0.77 (sd = 0.11) in the TPC group, 0.76 (sd= 0.10) in the TMI group, 0.76 (sd= 0.10) in the combined group, and 0.76 (sd= 0.10) in the control group.
The number of dropouts was significantly higher among participants who received TPC (TPC and com-bined groups; weeks 25, 47, and 73: 8%, 32%, and 32%) than among participants who did not (TMI and control groups; weeks 25, 47, and 73: 6%, 22%, and 22%). Also, participants with a low education level (i.e. less than sec-ondary or vocational education) were more likely to drop out than participants with higher education levels (25% vs. 17%). No relation was found between dropout and age, gender, hypertension, or region.
Effects
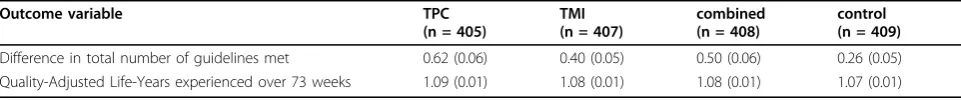
Table 1 shows the mean values of the self-reported out-comes per group, i.e. difference in total number of pub-lic health behavior guidelines met between baseline and 73 weeks follow-up, and number of QALYs experienced over 73 weeks. Participants in the control group showed
the smallest improvement in total number of guidelines met (0.3), whereas those in the TPC group showed the largest improvement (0.6). The same pattern held for the number of QALYs experienced over 73 weeks.
Group comparisons on the outcome variables are reported in Table 2. Participants in the TPC, TMI, and combined groups improved on significantly more guide-lines from baseline to 73 weeks follow-up than partici-pants in the control group. Also, participartici-pants in the TPC group did significantly better than participants in the TMI group on this outcome.
Group differences (i.e. interventions compared to no information, and interventions compared to each other) in number of QALYs experienced over 73 weeks were small and not statistically significant. In the complete case analysis, however, the difference in number of QALYs between participants in the TPC and control group, and between participants in the TMI and control group were statistically significant (p< .001 andp< .05, respectively).
Costs
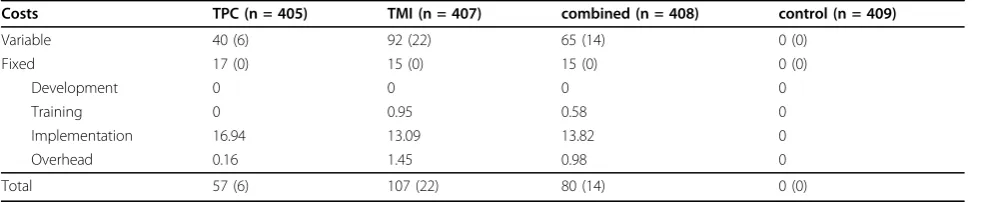
Table 3 summarizes the cost prices of the interventions as well as mean variable, fixed, and total costs per group. The costs for the control group were zero, as the participants in this group received no intervention. TPC was the least and TMI the most expensive intervention. Table 4 summarizes the group comparisons of interven-tion costs and shows the following ranking of costs (starting from the most expensive strategy): TMI > com-bined > TPC > control.
Cost-effectiveness analyses
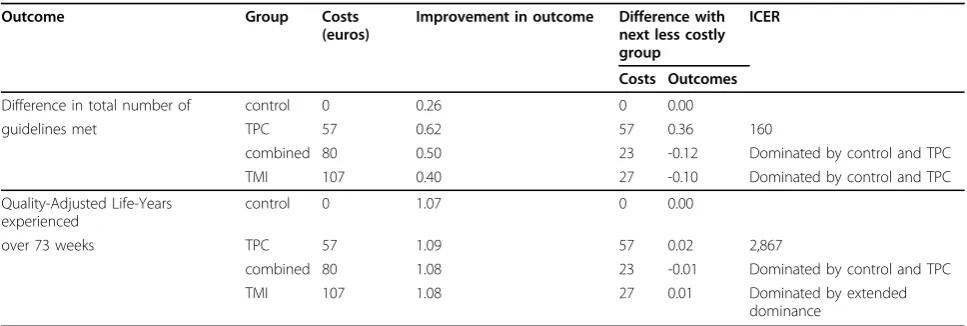
Table 5 gives an overview of the ICERs. This table shows that the combined intervention and TMI are both domi-nated by control and TPC for the difference in total number of guidelines met. The ICER for the TPC group in comparison with the control group was€160.
For the number of QALYs experienced over 73 weeks, the combined intervention was dominated by control and TPC, while the latter two groups showed extended dominance over the TMI intervention. The ICER for the TPC group in comparison with the control group was €2,867 per QALY experienced over 73 weeks.
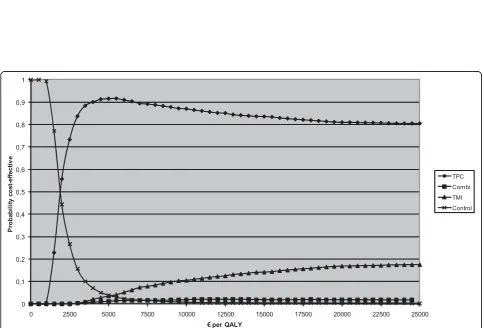
The cost-effectiveness acceptability curves of the Vita-lum groups are shown for each outcome in figures 2
Table 1 Pooled mean values (standard errors) of the outcome variables per group in Vitalum
Outcome variable TPC
(n = 405)
TMI (n = 407)
combined (n = 408)
control (n = 409)
Difference in total number of guidelines met 0.62 (0.06) 0.40 (0.05) 0.50 (0.06) 0.26 (0.05)
Quality-Adjusted Life-Years experienced over 73 weeks 1.09 (0.01) 1.08 (0.01) 1.08 (0.01) 1.07 (0.01)
and 3. In no cost-effectiveness analyses were TMI or the combined intervention considered the most cost-effec-tive option.
With regard to the difference in the total number of guidelines met at 73 weeks follow-up compared to the baseline measurement (Figure 2), the control group had the highest probability of being cost-effective for ceiling ratios below €160. For ceiling ratios higher than €160, TPC was the most cost-effective option. Similarly, for ceiling ratios of €226 or more, the probability of TPC being the most cost-effective intervention was 95% or higher.
With respect to the number of QALYs experienced over 73 weeks (Figure 3), the control group had the highest probability of being the most cost-effective for ceiling ratios lower than€2,851 per QALY. For ceiling ratios higher than€2,851, TPC seemed to be the most cost-effective strategy; however, its probability of being the most cost-effective ranged from 50% at a ceiling ratio of€2,851 up to a maximum probability of 80% at a ceiling ratio of€8,200.
Conclusions
This article has presented an economic evaluation of the comparative cost-effectiveness of TPC, TMI, a combina-tion of them, and no intervencombina-tion in improving (i) adherence to public health guidelines for three lifestyle behaviors, and (ii) health-related quality of life in older adults with and without hypertension.
With regard to the increase in total number of guide-lines met, the control group had the highest probability of being the most cost-effective at lower ceiling ratios (< €160) and the TPC group at higher ceiling ratios
(> €160). For this outcome, neither the TMI nor the combined intervention were more cost-effective at any point than the TPC and control groups. Considering the large group of people who may be eligible for a TPC intervention, i.e. the population of adults aged 45-70 years in the Netherlands (5,298,716 people in 2009 [52]), widespread implementation of the TPC interven-tion could have an enormous impact on the Dutch healthcare budget. Thus, before decision makers can decide whether they are willing to pay this amount of money, research is needed to investigate whether the long-term benefits of TPC justify this investment.
As regards the number of QALYs experienced over 73 weeks, no intervention (i.e. the control group) was the most cost-effective strategy at lower ceiling ratios (< €2,851) and the TPC group seemed most cost-effective at higher ceiling ratios (>€2,851).
The Dutch Council for Public Health and Health Care has recently proposed thresholds for expenditures on QALYs depending on the disease burden [53], with a maximum threshold of 80,000 euro per QALY for a relative disease burden of 1.0 (maximum). Compared to the threshold of hypertension, estimated as a relative disease burden of 0.26 [53] which implies a threshold of 20,800 euro per QALY, the costs of the TPC interven-tion in the present study were much lower per QALY. Comparing the probability of the different strategies being the most cost-effective at higher ceiling ratios indicates that control and combination should not be considered and TPC has a four time higher probability (80% at max) of being most cost-effective compared to TMI. However, because there is no consensus regarding the minimal probability at which an intervention should
Table 2 Pooled mean differences (standard errors) andpvalues* of group comparisons on the outcome variables
Outcome variable TPC vs.
combined
TPC vs. TMI
TPC vs. control
combined vs. TMI
combined vs. control
TMI vs. control
Difference in total number of guidelines met 0.12 (0.07)
p= 0.10
0.20 (0.07)
p= 0.001
0.36 (0.07)
p< 0.001
0.10 (0.07)
p= 0.13
0.24 (0.07)
p< 0.001
0.14 (0.06)
p= 0.02 Quality-Adjusted Life-Years experienced over
73 weeks
0.01 (0.01)
p= 0.35
0.00 (0.01)
p= 0.73
0.02 (0.01)
p= 0.09
-0.01 (0.01)
p= 0.42
0.01 (0.01)
p= 0.32
0.02 (0.01)
p= 0.07
NotesTPC = tailored print communication; TMI = telephone motivational interviewing; combined = combination of TPC and TMI; *pvalues obtained by independent t tests
Table 3 Mean costs in euros (standard deviation) per participant of Vitalum groups
Costs TPC (n = 405) TMI (n = 407) combined (n = 408) control (n = 409)
Variable 40 (6) 92 (22) 65 (14) 0 (0)
Fixed 17 (0) 15 (0) 15 (0) 0 (0)
Development 0 0 0 0
Training 0 0.95 0.58 0
Implementation 16.94 13.09 13.82 0
Overhead 0.16 1.45 0.98 0
Total 57 (6) 107 (22) 80 (14) 0 (0)
be considered cost-effective compared to its alternative, results with regard to the cost per QALY need to be considered cautiously. In addition, group differences in the number of QALYs experienced over 73 weeks fol-low-up were very small and clinically irrelevant. Also, despite the fact that half of the participants had hyper-tension and they failed at least two out of three health behavior guidelines, participants valued their health as relatively good (mean baseline utility scores ranged from 0.76 to 0.77). Although QALYs have the advantage of allowing comparison of intervention effects focusing on different behaviors, domains or populations, it is difficult to find significant effects on QALYs in a relatively healthy population, such as that described here. Quality of life appears to be rather stable and most likely to change temporarily as a result of major life events, e.g. a car accident. This can be explained by the Set-Point Model, which states that everyone has a baseline quality of life level to which they will return after changes in life circumstances [54,55].
The participants’ QALY scores in the present study (approximately 1.1 in all groups) were somewhat lower than the maximum QALY score of 1.4 given the time horizon. This was most likely caused by their age (45-70 years), in view of the fact that aging may be associated with functional decline and chronic disease [56,57].
Moreover, as a result of our recruitment aim, half of the participants had been diagnosed with hypertension [9].
The results of this economic evaluation differ from those of NC STRIDES [8,21]; the latter study found its combined intervention to be the most cost-effective for fruit and vegetable consumption. Participants in the com-bined NC STRIDES group received four TPC and four TMI components, whereas participants in the combined Vitalum group received only two of each. As is to be expected, the NC STRIDES combined group showed lar-ger effects than the Vitalum combined group. In contrast, the effects on absolute fruit and vegetable consumption in the TPC and TMI groups in Vitalum (which for both groups were significantly greater than in the control group) were stronger than in NC STRIDES (where neither intervention significantly differed from the con-trol group). Another explanation for the differences between Vitalum and NC STRIDES may be the outcome chosen for the cost-effectiveness analysis. The outcome of the NC STRIDES analyses was restricted to fruit and vegetable consumption, whereas that for Vitalum was the total number of guidelines met for three behaviors (phy-sical activity as well as fruit and vegetable consumption).
TMI was the most expensive intervention due to the fact that it is delivered personally (thus the counselors’ salaries and call charges need to be paid). Data entry
Table 4 Mean differences (95% confidence intervals) andpvalues of group comparisons*
Costs TPC vs. combined TPC vs. TMI TPC vs. control combined vs. TMI combined vs. control TMI vs. control
Variable -24 (-26 to -23)
p< 0.001
-52 (-54 to -49)
p< 0.001
40 (40 to 41)
p< 0.001
-27 (-29 to -24)
p< 0.001
65 (63 to 66)
p< 0.001
92 (89 to 94)
p< 0.001
Fixed 2 2 17 -0.1 15 15
Total -23 (-24 to -21)
p< 0.001
-50 (-50 to -47)
p< 0.001
57 (57 to 58)
p< 0.001
-27 (-30 to -25)
p< 0.001
80 (79 to 81)
p< 0.001
107 (105 to 109)
p< 0.001
NotesTPC = tailored print communication; TMI = telephone motivational interviewing; combined = combination of TPC and TMI; *Confidence intervals andp
values were obtained by bias corrected accelerated bootstrapping with 2000 replications in Stata.
Table 5 Incremental cost-effectiveness ratios (ICER) of Vitalum groups
Outcome Group Costs
(euros)
Improvement in outcome Difference with next less costly group
ICER
Costs Outcomes
Difference in total number of control 0 0.26 0 0.00
guidelines met TPC 57 0.62 57 0.36 160
combined 80 0.50 23 -0.12 Dominated by control and TPC
TMI 107 0.40 27 -0.10 Dominated by control and TPC
Quality-Adjusted Life-Years experienced
control 0 1.07 0 0.00
over 73 weeks TPC 57 1.09 57 0.02 2,867
combined 80 1.08 23 -0.01 Dominated by control and TPC
TMI 107 1.08 27 0.01 Dominated by extended
dominance
Figure 2 Cost-effectiveness acceptability curve of difference in total number of guidelines met.Notes TPC = tailored print communication; TMI = telephone motivational interviewing; combined = combination of TPC and TMI.
accounted for more than half of the fixed intervention costs, with the largest share for TPC. These costs could be reduced in the future if electronic surveys are used instead. With regard to computer tailoring, the interven-tion costs could be further reduced by combining elec-tronic surveys with cheaper modes of delivery, for example the internet. The cost-effectiveness of such sec-ond-generation tailored interventions should therefore be examined.
The economic evaluation presented here may overesti-mate the costs of TMI due to the fact that the data entry costs of the measurements were included in the cost calculations. Data were used to provide behavioral feedback at the start of the TMI sessions. Assessing an individual’s health behavior by way of surveys, as carried out here, is not an essential part of MI [7], and could be replaced by a brief assessment at the start of the TMI session. Furthermore, the fidelity of MI delivery in the present study was rated as substandard for some ele-ments [11] of the Motivational Interviewing Treatment Integrity Code 3.0 [58]. More research into the cost-effectiveness of TMI is therefore required.
Although we did not measure the cost-effectiveness of the interventions on decreased CVD risk by means of epidemiological modeling, the interventions may be expected to also decrease CVD risk, depending on how long the intervention effects are maintained. As outlined in the introduction, unhealthy dietary behavior and low levels of physical activity are modifiable risk factors of CVD [1], estimated to account for 31% (fruit and vege-table intake) and 22% (physical inactivity) of ischemic heart disease [59]. Moreover, lack of physical activity and inadequate nutrition often co-occur [60-65], which further increases the risk of morbidity, mortality and healthcare costs [66,67]. We therefore recommend that future cost-effectiveness studies targeting CVD risk behaviors either employ a longer follow-up period to examine how CVD risk is affected, or use modeling techniques.
A limitation of the present study is the use of self-reporting measures in assessing guideline adherence, as self-reports are prone to measurement bias such as socially desirable answers [68-70]. Another limitation is the somewhat restrictive perspective used for the eco-nomic evaluation, which may have led to the exclusion of important costs from the societal perspective [71], for example changes in productivity and healthcare utiliza-tion [72]. Although an analysis from a societal perspec-tive would provide the most complete information for decision makers [71], we were unable to take this angle as our time frame was restricted to 73 weeks follow-up and we did not expect any effect on overall healthcare utilization or lost productivity during this period. Also, we wanted to reduce the participant burden by
excluding questions about healthcare use. A third limita-tion was that dropout was higher in participants with a low education level than with higher levels of education. The cost-effectiveness analyses could be biased in case of non-ignorable dropout (i.e. dropout depending on unmeasured outcome variables). Because the cost-effec-tiveness analyses were intention-to-treat [50], and drop-out did not seem to depend on other covariates, the analyses were unbiased under the assumption of miss-ingness at random. In addition, dropout rates were high-est among participants receiving TPC and the combined intervention. This could be explained by the participant evaluation of the interventions [11]. Participants who received TMI were more satisfied with the intervention and perceived it as more interesting than did partici-pants who received TPC. Another reason could be the personal delivery of TMI, as this may enhance commit-ment among participants. Finally, a disadvantage of using overall outcomes in stead of focusing on separate behavioral outcomes in the cost-effectiveness analysis is that the difference in effect between the behaviors are neglected and valued equally. However, as was described before, the cost-effectiveness in the present study was assessed for overall outcomes because Vitalum focused on the combination of three behaviors [9] and interven-tion costs could not be separated for each behavior.
Overall, this economic evaluation indicated that the control group, i.e. the group that received no interven-tion, displayed the most cost-efficacy for the number of QALYs experienced over 73 weeks when willingness to pay by the society was low. This also applied to the increase in the number of guidelines met at lower ceil-ing ratios, whereas at higher ceilceil-ing ratios, TPC had a higher probability of being more cost-effective than TMI, the combined version or control. With regard to QALYs experienced over 73 weeks, the TPC interven-tion seemed most cost-effective at higher ceiling ratios. Future research should examine the long-term effective-ness of the interventions as well as strategies to increase the cost-effectiveness of TPC and TMI.
Additional material
Additional file 1: Total fixed costs (in euros) per intervention group in Vitalum.NotesTPC = tailored print communication; TMI = telephone motivational interviewing; combined = combination of TPC and TMI.
Acknowledgements
Author details
1School for Public Health and Primary Care (Caphri), Department of Health
Promotion, Maastricht University, the Netherlands.2Department of Health Sciences and EMGO Institute for Health and Care Research, VU University Amsterdam, the Netherlands.3Institute for Health Policy and Management, Erasmus University Rotterdam, the Netherlands.4School for Public Health and Primary Care (Caphri), Department of Health Organization, Policy, and Economics, Maastricht University, Maastricht, the Netherlands.5EMGO Institute for Health and Care Research, VU University Medical Centre, Amsterdam, the Netherlands.6School for Public Health and Primary Care (Caphri), Department of Epidemiology, Maastricht University, the Netherlands.
Authors’contributions
IM and JB obtained the finances for this study. HMVK and IM developed and executed the study, with HDV advising on its development. JLS advised on the conceptions of data collection, analyses and execution. JEB contributed statistical expertise, and performed the analyses under the supervision of MWVT. HMVK and JEB significantly contributed to the writing of the manuscript, while IM, HDV, JB, MWVT and JLS were involved in revising it. All authors have seen and approved of the version to be published.
Competing interests
The authors declare that they have no competing interests.
Received: 17 February 2010 Accepted: 3 September 2010 Published: 3 September 2010
References
1. WHO:Prevention of cardiovascular disease. Guidelines for assessment and management of cardiovascular risk.Geneva: WHO 2007. 2. Leal J, Luengo-Fernandez R, Gray A, Petersen S, Rayner M:Economic
burden of cardiovascular diseases in the enlarged European Union.
European Heart Journal2006,27:1610-1619.
3. Hettema J, Steele J, Miller WR:Motivational interviewing.Annual Review of Clinical Psychology2005,1:91-111.
4. Martins RK, McNeil DW:Review of Motivational Interviewing in promoting health behaviors.Clinical Psychology Review2009,29:283-293.
5. Noar SM, Benac CN, Harris MS:Does tailoring matter? Meta-analytic review of tailored print health behavior change interventions.
Psychological Bulletin2007,133:673-693.
6. Kreuter MW, Skinner CS:Tailoring: what’s in a name?Health Education Research2000,15:1-4.
7. Miller WR, Rollnick S:Ten things that motivational interviewing is not.
Behavioural and Cognitive Psychotherapy2009,37:129-140.
8. Campbell MK, Carr C, Devellis B, Switzer B, Biddle A, Amamoo MA, Walsh J, Zhou B, Sandler R:A randomized trial of tailoring and motivational interviewing to promote fruit and vegetable consumption for cancer prevention and control.Annals of Behavioral Medicine2009,38:71-85. 9. van Keulen HM, Mesters I, Brug J, Ausems M, Campbell M, Resnicow K,
Zwietering PJ, van Breukelen G, van Mechelen W, Severens JL, de Vries H:
Vitalum study design: RCT evaluating the efficacy of tailored print communication and telephone motivational interviewing on multiple health behaviors.BMC Public Health2008,8:216.
10. Prochaska JO, Butterworth S, Redding CA, Burden V, Perrin N, Leo M, Flaherty-Robb M, Prochaska JM:Initial efficacy of MI, TTM tailoring and HRI’s with multiple behaviors for employee health promotion.Preventive Medicine2008,46:226-231.
11. Van Keulen HM:Vitalum. Development and evaluation of tailored print communication and telephone motivational interviewing to improve lifestyle behaviors among older adults.PhD thesis.Maastricht University, Health Promotion2010.
12. Dalziel K, Segal L:Time to give nutrition interventions a higher profile: cost-effectiveness of 10 nutrition interventions.Health Promotion International2007,22:271-283.
13. Sevick MA, Napolitano MA, Papandonatos GD, Gordon AJ, Reiser LM, Marcus BH:Cost-effectiveness of alternative approaches for motivating activity in sedentary adults: results of Project STRIDE.Preventive Medicine
2007,45:54-61.
14. Sukhanova A, Ritzwoller DP, Alexander G, Calvi JH, Carlier C, McClure JB, Rolnick S, Johnson C:Cost analyses of a web-based behavioral
intervention to enhance fruit and vegetable consumption.International Journal of Behavioral Nutrition and Physical Activity2009,6:92.
15. Neville LM, O’Hara B, Milat AJ:Computer-tailored dietary behaviour change interventions: a systematic review.Health Education Research
2009,24:699-720.
16. Burke BL, Arkowitz H, Menchola M:The efficacy of motivational interviewing: a meta-analysis of controlled clinical trials.Journal of Consulting and Clinical Psychology2003,71:843-861.
17. Dunn C, Deroo L, Rivara FP:The use of brief interventions adapted from motivational interviewing across behavioral domains: a systematic review.Addiction2001,96:1725-1742.
18. Rimer BK, Kreuter MW:Advancing Tailored Health Communication: A Persuasion and Message Effects Perspective.Journal of Communication
2006,56:S184-201.
19. Glasgow RE, Emmons KM:How can we increase translation of research into practice? Types of evidence needed.Annual Review of Public Health
2007,28:413-433.
20. Rabin BA, Brownson RC, Kerner JF, Glasgow RE:Methodologic challenges in disseminating evidence-based interventions to promote physical activity.American Journal of Preventive Medicine2006,31:S24-34. 21. Campbell MK, Quintiliani LM:Tailored interventions in public health:
where does tailoring fit in interventions to reduce health disparities?
American Behavioral Scientist2006,49:775-793.
22. Metsemakers JF, Hoppener P, Knottnerus JA, Kocken RJ, Limonard CB:
Computerized health information in The Netherlands: a registration network of family practices.British Journal of General Practice1992,
42:102-106.
23. Van den Akker M, Metsemakers JFM, Limonard CBG, Knottnerus JA:General Practice: a gold mine for research. Data and scientific use of the Registration Network Family Practices.Maastricht: Unigraphic2004. 24. Lamberts H, Wood M:ICPC International Classification of Primary Care
Oxford: Oxford University Press 1987.
25. Nederlands Huisartsen Genootschap:NGH-Standaard cardiovasculair risicomanagement M84 [Dutch College of General Practitioners (NGH)-Guidelines for cardiovascular risk management M84].Houten: Bohn Stafleu van Loghum 2006, 1-26.
26. Walma EP, Thomas S, Prins A, Grundmeyer HGLM, Van der Laan JR, Wiersma T:NHG - Standaard hypertensie (derde herziening) [Dutch College of General Practitioners (NHG) - Guidelines for hypertension (third revision)].Huisarts en Wetenschap2003,46:435-449.
27. Lewington S, Clarke R, Qizilbash N, Peto R, Collins R:Age-specific relevance of usual blood pressure to vascular mortality: a meta-analysis of individual data for one million adults in 61 prospective studies.Lancet
2002,360:1903-1913.
28. Gezondheidsraad:Richtlijnen goede voeding 2006
-achtergronddocument [Guidelines for good nutrition 2006 - background material].Den Haag: Gezondheidsraad 2006.
29. USDHHS:Physical activity and health: A report of the surgeon general.
Department of Health and Human Services, Centers for Disease Control and Prevention, National Center for Chronic Disease Prevention and Health Promotion, Atlanta1996.
30. World Cancer Research Fund/American Institute for Cancer Research:Policy and action for cancer prevention. Food, nutrition, and physical activity: a global perspective.Washington DC: American Institute for Cancer Research 2009.
31. Haskell WL, Lee IM, Pate RR, Powell KE, Blair SN, Franklin BA, Macera CA, Heath GW, Thompson PD, Bauman A:Physical activity and public health: updated recommendation for adults from the American College of Sports Medicine and the American Heart Association.Circulation2007,
116:1081-1093.
32. Kemper HGC, Ooijendijk WTM, Stiggelbout M:Consensus over de Nederlandse norm gezond bewegen [Consensus on Dutch
recommendations for physical activity to promote health].Tijdschrift voor Gezondheidswetenschappen2000,78:180-183.
34. USDHHSA:Nutrition and your health: dietary guidelines for American. 2005 Dietary guidelines advisory committee report.Department of Health and Human Services and Agriculture2005.
35. WHO:Diet, nutrition and the prevention of chronic diseases.Geneva: WHO 2003.
36. Bogers RP, Van Assema P, Kester AD, Westerterp KR, Dagnelie PC:
Reproducibility, validity, and responsiveness to change of a short questionnaire for measuring fruit and vegetable intake.American Journal of Epidemiology2004,159:900-909.
37. Resnicow K, McCarty F, Blissett D, Wang T, Heitzler C, Lee RE:Validity of a modified CHAMPS physical activity questionnaire among African-Americans.Medicine & Science in Sports & Exercise2003,35:1537-1545. 38. Ainsworth BE, Haskell WL, Whitt MC, Irwin ML, Swartz AM, Strath SJ,
O’Brien WL, Bassett DR Jr, Schmitz KH, Emplaincourt PO, Jacobs DR Jr, Leon AS:Compendium of physical activities: an update of activity codes and MET intensities.Medicine & Science in Sports & Exercise2000,32: S498-504.
39. Wendel-Vos GC, Schuit AJ, Saris WH, Kromhout D:Reproducibility and relative validity of the short questionnaire to assess health-enhancing physical activity.Journal of Clinical Epidemiology2003,56:1163-1169. 40. Brazier JE, Harper R, Jones NM, O’Cathain A, Thomas KJ, Usherwood T,
Westlake L:Validating the SF-36 health survey questionnaire: new outcome measure for primary care.British Medical Journal1992,
305:160-164.
41. Van der Zee KI, Sanderman R:Het meten van de algemene gezondheidstoestand met de RAND-36. Een handleiding [Measuring general health with the RAND-36. A manual] Groningen: Noordelijk Centrum voor Gezondheidsvraagstukken.Rijksuniversiteit Groningen1993, 1-28.
42. Weinstein MC, Torrance G, McGuire A:QALYs: the basics.Value in Health
2009,12(Supplement 1):S5-9.
43. Brazier J, Roberts J, Deverill M:The estimation of a preference-based measure of health from the SF-36.Journal of Health Economics2002,
21:271-292.
44. Drummond MF, Sculpher MJ, Torrance GW, O’Brien BJ, Stoddard GL:
Methods for the Economic Evaluation of Health Care Programmes.New York: Oxford University Press, Second 2005.
45. Oostenbrink JB, Bouwmans CAM, Koopmanschap MA, Rutten FFH:
Handleiding voor kostenonderzoek, methoden en standaard kostprijzen voor economische evaluatie in de gezondheidszorg [Manual for cost analysis, methods and guidelines prices for economic evaluation in healthcare].Amstelveen: College voor zorgverzekeringen2004.
46. Rasbash J, Brown W, Goldstein H, Yang M, Plewis I, Healy M, Woodhouse G, Draper D, Langford I, Lewis T:A user’s guide to MLwiNLondon: Multilevel Models Project, Institute of Education, University of London 2000. 47. Briggs AH, Wonderling DE, Mooney CZ:Pulling cost-effectiveness analysis
up by its bootstraps: a non-parametric approach to confidence interval estimation.Health Economics1997,6:327-340.
48. Rubin DB:Multiple imputation for nonresponse in surveysNew York, NY: John Wiley & Sons 1987.
49. Molenberghs G, Kenward M:Missing data in clinical studiesChichester, UK: Wiley 2007.
50. Schafer JL, Graham JW:Missing data: our view of the state of the art.
Psychological Methods2002,7:147-177.
51. Van Hout BA, Al MJ, Gordon GS, Rutten FF:Costs, effects and C/E-ratios alongside a clinical trial.Health Economics1994,3:309-319.
52. Bevolking. Leeftijd, herkomstgroepering, geslacht en regio [Population. Age, ethnicity, gender and region].[http://statline.cbs.nl/].
53. Raad voor de Volksgezondheid en Zorg:Zinnige en duurzame zorg [Sensible and durable care].Zoetermeer: Raad voor de Volksgezondheid en Zorg 2006.
54. Lucas RE:Adaptation and the setpoint model of subjective wellbeing -Does happiness change after major life events?Current Directions in Psychological Science2007,16:75-79.
55. Diener E, Lucas RE, Scollon CN:Beyond the hedonic treadmill: revising the adaptation theory of well-being.American Psychologist2006,
61:305-314.
56. Goldspink DF:Ageing and activity: their effects on the functional reserve capacities of the heart and vascular smooth and skeletal muscles.
Ergonomics2005,48:1334-1351.
57. Burt VL, Cutler JA, Higgins M, Horan MJ, Labarthe D, Whelton P, Brown C, Roccella EJ:Trends in the prevalence, awareness, treatment, and control of hypertension in the adult US population. Data from the health examination surveys, 1960 to 1991.Hypertension1995,26:60-69. 58. Moyers TB, Martin T, Manual JK, Miller WR, Ernst D:Revised Global Scales:
Motivational Interviewing Treatment Integrity 3.0 (MITI 3.0).University of New Mexico, Center on Alcoholism, Substance Abuse and Addictions (CASAA)
2007,28.
59. WHO:The World Health Report 2002. Reducing risks, promoting healthy life.Geneva: WHO 2002.
60. Schuit AJ, van Loon AJ, Tijhuis M, Ocke M:Clustering of lifestyle risk factors in a general adult population.Preventive Medicine2002,35:219-224. 61. De Vries H, van‘t Riet J, Spigt M, Metsemakers J, van den Akker M,
Vermunt JK, Kremers S:Clusters of lifestyle behaviors: results from the Dutch SMILE study.Preventive Medicine2008,46:203-208.
62. Johnson MF, Nichols JF, Sallis JF, Calfas KJ, Hovell MF:Interrelationships between physical activity and other health behaviors among university women and men.Preventive Medicine1998,27:536-544.
63. Simoes EJ, Byers T, Coates RJ, Serdula MK, Mokdad AH, Heath GW:The association between leisure-time physical activity and dietary fat in American adults.American Journal of Public Health1995,85:240-244. 64. Raitakari OT, Leino M, Rakkonen K, Porkka KV, Taimela S, Rasanen L,
Viikari JS:Clustering of risk habits in young adults. The Cardiovascular Risk in Young Finns Study.American Journal of Epidemiology1995,
142:36-44.
65. De Vries H, Kremers S, Smeets T, Reubseat A:Clustering of diet, physical activity and smoking and a general willingness to change.Psychology & Health2008,23:265-278.
66. Edington DW, Yen LT, Witting P:The financial impact of changes in personal health practices.Journal of Occupational and Environmental Medicine1997,39:1037-1046.
67. Edington DW:Emerging research: a view from one research center.
American Journal of Health Promotion2001,15:341-349.
68. Matthews CE:Use of self-report instruments to assess physical activity.In
Physical activity assessments for health-related research.Edited by: Welk GJ. Champaign: Human Kinetics; 2002:107-123.
69. Schwarz N:Self-reports: How the questions shape the answers.American Psychologist1999,54:93-105.
70. NIH guide: Improving diet and physical activity assessment.[http:// grants.nih.gov/grants/guide/pa-files/PAR-03-009.html].
71. Jonsson B:Ten arguments for a societal perspective in the economic evaluation of medical innovations.The European Journal of Health Economics2009,10:357-359.
72. Graf von der Schulenburg JM, Hoffmann C:Review of European guidelines for economic evaluation of medical technologies and pharmaceuticals.
Health Economics in Prevention and Care2000,1:2-8.
doi:10.1186/1479-5868-7-64
Cite this article as:van Keulenet al.:Cost-effectiveness of tailored print communication, telephone motivational interviewing, and a
combination of the two: results of an economic evaluation alongside the Vitalum randomized controlled trial.International Journal of Behavioral Nutrition and Physical Activity20107:64.
Submit your next manuscript to BioMed Central and take full advantage of:
• Convenient online submission
• Thorough peer review
• No space constraints or color figure charges
• Immediate publication on acceptance
• Inclusion in PubMed, CAS, Scopus and Google Scholar • Research which is freely available for redistribution