R E V I E W
Open Access
Climate change and mosquito-borne diseases in
China: a review
Li Bai
1, Lindsay Carol Morton
2and Qiyong Liu
1,3*Abstract
China has experienced noticeable changes in climate over the past 100 years and the potential impact climate change has on transmission of mosquito-borne infectious diseases poses a risk to Chinese populations. The aims of this paper are to summarize what is known about the impact of climate change on the incidence and prevalence of malaria, dengue fever and Japanese encephalitis in China and to provide important information and direction for adaptation policy making. Fifty-five papers met the inclusion criteria for this study. Examination of these studies indicates that variability in temperature, precipitation, wind, and extreme weather events is linked to transmission of mosquito-borne diseases in some regions of China. However, study findings are inconsistent across geographical locations and this requires strengthening current evidence for timely development of adaptive options. After synthesis of available information we make several key adaptation recommendations including: improving current surveillance and monitoring systems; concentrating adaptation strategies and policies on vulnerable communities; strengthening adaptive capacity of public health systems; developing multidisciplinary approaches sustained by an new mechanism of inter-sectional coordination; and increasing awareness and mobilization of the general public.
Keywords:Climate change, Malaria, Dengue fever, Japanese encephalitis, Adaptation, China
Introduction
The Intergovernmental Panel on Climate Change (IPCC) has reported the existence of abundant evidence of cli-mate change on a global scale [1]. According to the IPCC’s fourth assessment in 2007, global average surface temperature will increase by 1.1-6.4°C by 2100, 2-9 times more than globally averaged warming during last cen-tury [1]. Furthermore, the frequency and extent of extreme weather events; such as heat waves, bushfires, floods, and cyclones, can be highly impacted by the changing climate. Anthropogenic climate change has also been identified as an important risk factor for popu-lation health [2], including transmission of infectious diseases, and most importantly suspected impacts distri-bution and occurrence of vector borne diseases [1]. Despite the ongoing debate over the influence climate
factors have on mosquito-borne disease occurrence, it is widely assumed that distribution and occurrence of these diseases, such as malaria, are determined by cli-mate and that global warming trends will lead to higher incidence and wider geographic range [3-10]. In con-trast, some studies hold that the current evidence is in-sufficient to clearly attribute local resurgences or such geographic spread to regional changes in climate [11-14]. More research is needed to better understand the relationship between climate change and transmis-sion of mosquito-borne diseases, and to further promote adaptive policies formulation to reduce unexpected climate-related risk at a global, regional or local level.
Mosquito-borne diseases in China remain a serious public health problem. For example, 46,988 malaria cases and 18 deaths were reported in 1,097 counties in 2007 [15]. In 2002, the most serious outbreak of dengue fever occurred in Taiwan with 5,285 diagnosed cases [16]. In 2006, an outbreak of Japanese encephalitis oc-curred in Shanxi Province causing 19 deaths [17]. As the largest developing country, China has experienced con-siderable changes in climate over during the last decade with more rapid changes in the past 50 years [18]. The * Correspondence:liuqiyong@icdc.cn
1
State Key Laboratory for Infectious Diseases Prevention and Control, National Institute for Communicable Disease Control and Prevention, Chinese Center for Disease Control and Prevention, Beijing 102206, People’s Republic of China
3
Shandong University Climate Change and Health Center, Jinan 250012Shandong, People’s Republic China
Full list of author information is available at the end of the article
annual average temperature has risen by 0.5-0.8°C, which is slightly higher than the global average level. These vari-ation and fluctuvari-ation in weather patterns and extreme cli-matological phenomena (e.g. droughts, storms, floods etc.) may have a detrimental effect on frequency and distribu-tion of mosquito-borne diseases.
In recent years, the impact of climate change on the transmission of mosquito-borne diseases has been stud-ied in China. However, the quantitative relationship be-tween meteorological variables and the spatial and temporal distributions of these infectious diseases is still not clear. Study findings are inconsistent, which may be due to methodological limitations, unavailability of rele-vant data and many uncertainties about the range and magnitude of influences of climate change. Moreover, there remains no adaptive mechanism to reduce adverse consequences of mosquito-borne diseases under the changing climate in China. It is urgent to improve our understanding of current evidence, knowledge gaps and development of adaptation options. Our aims were to summarize previous research exploring climate change-related impacts on mosquito-borne diseases in China by reviewing the published studies examining the relation-ship between climate variability and the transmission of malaria, dengue fever and Japanese encephalitis, and to give some suggestions for the development of adaptation strategies and measures to lessen the adverse impacts on mosquito-borne diseases in China.
Methods Search strategy
The PubMed electronic database and China Hospital Knowledge Database (CHKD) were used in December
2011 to retrieve original studies published in English and Chinese, respectively. Searches of the“Google”search en-gine and“Google Scholar”were also conducted. Combina-tions of the key terms“malaria”,“dengue”,“dengue fever”, “dengue hemorrhagic fever”,“Japanese encephalitis”,“ cli-mate”, “weather”, “climate change”, “climate variability”, “climatic factors”,“temperature”,“rainfall”, and“humidity” were used to maximize search yield. Titles, abstracts and keywords were first screened for relevance and full texts were obtained to evaluate for inclusion criteria. Reference lists of each included article were then evaluated if missed in the in the initial electronic database search. Figure 1 illustrates the systematic search and inclusion/exclusion process.
Inclusion criteria
Studies were included on the basis of the following criteria:
1. Articles must evaluate the effects of climatic factors on the distribution and transmission of malaria, dengue fever or Japanese encephalitis. Meteorological variables (e.g. temperature, rainfall etc.) or ecological proxy indicators (e.g. Normalized Difference
Vegetation Index, South Oscillation Index) had to be included. Disease variables (e.g. incidence, cases) or entomologic variables (e.g. Breteau Index, House Index etc.) had to be included.
2. The papers had to use an epidemiological study design (e.g. time series analysis, spatial and/or temporal analysis and descriptive study) to identify the association between climatic variables and incidence of mosquito-borne diseases and/or vector
factors (e.g. mosquito density, distribution, infectious life span).
3. Only studies published before December 2012 and conducted in China (including Chinese Autonomous Regions, Hong Kong, Macau and Taiwan) were examined.
Results and discussion Literature search
To avoid language bias, studies published in English and Chinese were considered for inclusion (Table 1). The ini-tial search generated 3769 articles from PubMed, CHKD and Google Scholar databases. Review of the titles, ab-stracts and keywords excluded 2989 articles, leaving 780 studies identified as potential epidemiological papers. Then, 517 full-text articles were identified based on the abstracts and evaluated for inclusion. Of these, fifty-four articles met the inclusion criteria and 3 papers were in-cluded after cross-referencing. The methodologies and major findings of the final 57 studies are summarized in Tables 2, 3 and 4.
Study sites mainly included Yunnan Province (n = 9), Hainan Province (n = 8), Anhui Province (n = 7), Taiwan (n = 7), Guizhou Province (n = 5), Shandong Province (n = 3), Guangdong Province (n = 3), Henan Province (n = 2), Hubei Province (n = 2), Jiangsu Province (n = 2), and Liaoning Province (n = 2). Other locations included Jiangxi Province, Hebei Province, Shanxi Province, Shaanxi Province, Sichuan Province, Gansu Province, Zhejiang Province, Fujian Province, Beijing Municipality, Chongqing Municipality, Tianjin Municipality, Inner Mongolian Autonomous Region, and Tibetan Autonomous Region. However, there was no study conducted in some regions where mosquito-borne diseases are endemic, such as Guangxi and Hunan Province.
All included studies examined the relationship between climatic variables and mosquito-borne diseases. Of these, only 6 studies evaluated of the impacts of both meteoro-logical factors and other relevant determinants, such as urbanization, agriculture and vaccination [51,54,64,71,73]. Several studies used ecological proxy indicators including Normalized Difference Vegetation Index (NDVI) and South Oscillation Index (SOI) as risk variables [28,29,35,37,39,43].
Two studies explored the influence of typhoons on out-breaks of dengue fever [48,52]. The main outcome indica-tors evaluated in this review were case count and incidence rate. Several studies collected data on entomologic factors [38,47,48,60]. Only 7 studies evaluated both disease and mosquito data together [21,48,49,54,55,59,61].
A variety of methods were used to determine the ef-fects of climatic variables on diseases and mosquitoes. Among them, 9 employed spatial study designs [23,31, 35,39,43,47,48,54,56], 6 time-series analyses [20,22,27, 30,55,62], and 4 spatial-temporal methods [19,24-26]. Simple comparisons between climate, disease and/or vector data were applied in 10 descriptive studies [34,45, 53,57,58,60,61,68,73,75]. Correlations and multiple re-gressions (e.g logistic and Poisson regression) were widely conducted among selected articles to examine associations between weather parameters and mosquito-borne dis-eases. Time-series models including autoregressive inte-grated moving average (ARIMA) model and seasonal ARIMA model were mainly used in recently published studies. Risk maps of mosquito-borne diseases and vector distribution in different regions were also present in some articles using spatial analysis with Geographic Information System (GIS) [23,47,56]. Other statistical methods used in-cluded study designs utilizing Principle Component Ana-lysis (PCA), Back propagation artificial neural network and CLIMEX model etc.
Associations between climatic variables and mosquito-borne diseases
Malaria
Despite considerable reductions in the overall burden of malaria in the 20th century, this ancient disease still rep-resents a significant public health problem in China, es-pecially in the southern and central regions. In 2010, 7,855 diagnosed malaria cases and 34,082 suspected cases with 19 deaths were reported in 1191 counties of 239 Provinces/Municipalities/Autonomous Regions in China. The annual incidence was 0.66/10,000 population [76]. Only sixteen percent of malaria cases were caused by Plasmodium falciparum [76] mostly occurring in Yunnan Province, which is located in southern China. Yunnan remains a hypo-endemic region with persistent cases of bothP. falciparumandP. vivaxmalaria.
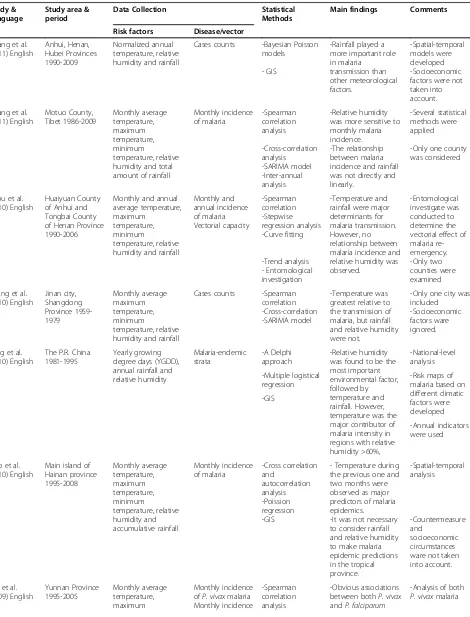
To identify risk factors related to climate change and its role in malaria transmission, a series of studies were conducted in mainland China to investigate the relation-ships between meteorological variables and malaria [19-46]. Except for a single study that found no associ-ation, all studies showed correlations between climatic variables and malaria in different locations and study pe-riods in China. The contradictory study likely resulted from a short (6-month) study period [36]. In Yunnan province, two studies were conducted in 2009 to clarify Table 1 Numbers of selected studies published in English
and Chinese
Studies in English
Published between 1998-2011
Studies in Chinese
Published between 1995-2011
Total
Malaria 13 15 28
Dengue fever 9 6 15
Japanese encephalitis 4 10 14
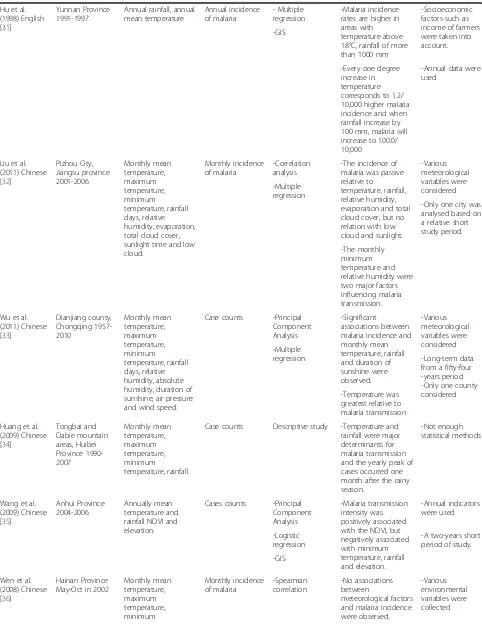
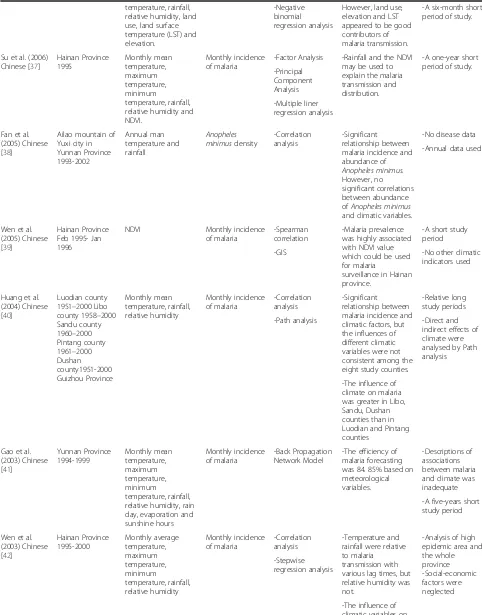
Table 2 Characteristics of studies on the association between climatic variables and malaria transmission
Study & Language
Study area & period
Data Collection Statistical Methods
Main findings Comments
Risk factors Disease/vector
Huang et al. (2011) English [19]
Anhui, Henan, Hubei Provinces 1990-2009
Normalized annual temperature, relative humidity and rainfall
Cases counts -Bayesian Poisson models
-Rainfall played a more important role in malaria transmission than other meteorological factors. -Spatial-temporal models were developed
- GIS -Socioeconomic
factors were not taken into account.
Huang et al. (2011) English [20]
Motuo County, Tibet 1986-2009 Monthly average temperature, maximum temperature, minimum temperature, relative humidity and total amount of rainfall
Monthly incidence of malaria -Spearman correlation analysis -Relative humidity was more sensitive to monthly malaria incidence. -Several statistical methods were applied -Cross-correlation analysis -The relationship between malaria incidence and rainfall was not directly and linearly.
-Only one county was considered -SARIMA model
-Inter-annual analysis
Zhou et al. (2010) English [21]
Huaiyuan County of Anhui and Tongbai County of Henan Province 1990-2006
Monthly and annual average temperature, maximum
temperature, minimum
temperature, relative humidity and rainfall
Monthly and annual incidence of malaria Vectorial capacity -Spearman correlation -Temperature and rainfall were major determinants for malaria transmission. However, no relationship between malaria incidence and relative humidity was observed.
-Entomological investigate was conducted to determine the vectorial effect of malaria re-emergency. -Stepwise
regression analysis -Curve fitting
-Trend analysis -Only two
counties were examined - Entomological
investigation
Zhang et al. (2010) English [22]
Jinan city, Shangdong Province 1959-1979 Monthly average maximum temperature, minimum temperature, relative humidity and rainfall
Cases counts -Spearman correlation
-Temperature was greatest relative to the transmission of malaria, but rainfall and relative humidity were not.
-Only one city was included -Cross-correlation -Socioeconomic
factors ware ignored. -SARIMA model
Yang et al. (2010) English [23]
The P.R. China 1981-1995
Yearly growing degree days (YGDD), annual rainfall and relative humidity Malaria-endemic strata -A Delphi approach -Relative humidity was found to be the most important environmental factor, followed by temperature and rainfall. However, temperature was the major contributor of malaria intensity in regions with relative humidity >60%,
-National-level analysis
-Multiple logistical regression
-Risk maps of malaria based on different climatic factors were developed -GIS -Annual indicators were used
Xiao et al. (2010) English [24]
Main island of Hainan province 1995-2008 Monthly average temperature, maximum temperature, minimum temperature, relative humidity and accumulative rainfall Monthly incidence of malaria -Cross correlation and autocorrelation analysis
- Temperature during the previous one and two months were observed as major predictors of malaria epidemics. -Spatial-temporal analysis -Poission regression -GIS -Countermeasure and socioeconomic circumstances ware not taken into account. -It was not necessary
to consider rainfall and relative humidity to make malaria epidemic predictions in the tropical province.
Hui et al. (2009) English [25]
Yunnan Province 1995-2005 Monthly average temperature, maximum Monthly incidence ofP. vivaxmalaria Monthly incidence
-Spearman correlation analysis
-Obvious associations between bothP. vivax
andP. falciparum
-Analysis of both
Table 2 Characteristics of studies on the association between climatic variables and malaria transmission(Continued)
temperature, minimum
temperature, relative humidity and rainfall
ofP. falciparum
malaria
malaria and climatic factors with a clear 1-month lagged effect, especially in cluster areas.
andP. falciparum
malaria -Temporal
distribute analysis
-Spatio-temporal analysis -Spatial
autocorrelation
-Minimum temperature was most closely correlated to malaria incidence
-Spatial cluster analysis - GIS
Clements et al. (2009) English [26]
Yunnan Province 1991-2006
Monthly average rainfall, maximum temperature and minimum temperature
Monthly incidence ofP. vivaxmalaria Monthly incidence ofP. falciparum
malaria
-Corss-correlation -Significant positive relationships between malaria incidence and rainfall and maximum temperature for both
P. vivaxandP. falciparummalaria
-Analysis of both
P. vivaxmalaria andP. falciparum
malaria -Bayesian Poisson
regression
-Spatial-temporal analysis -GIS
-Socioeconomic factors were ignored. -High-incidence
clusters located adjacent the international borders were not explained by climate, but partly due to population migration.
Tian et al. (2008) English [27]
Mengla County, Yunnan Province 1971-1999
Monthly rainfall, minimum temperature, maximum
temperature, relative humidity, and fog day frequency
Monthly incidence of malaria
-ARIMA models -Temperature and fog day frequency were key predictors of monthly malaria incidence. However, relative humidity and rainfall were not.
-Fog day frequency used
-P. vivaxmalaria andP. falciparum
malaria were pooled together when malaria incidence was calculated. -The annual fog
frequency was the only weather predictor of the annual incidence of malaria
Bi et al. (2005) English [28]
Anhui province 1966-1987
Monthly EI-Nino Southern Oscillation Index (ENSO)
Monthly malaria cases
-Spearman correlation
-A positive correlation between ENSO and the incidence of malaria with no lag effect was found.
-The impact of ENSO on malaria was analysed -Other meteorological variables were not considered.
-Only used correlation method
Liu et al. (2006) English [29]
Twenty-one townships of 10 counties in Yunnan province 1984-1993
Monthly minimum temperature, maximum temperature, rainfall, sunshine duration, NDVI.
Monthly incidence of malaria and vector density.
-Principle component analysis
-Remote sensing NDVI and climatic variables had a good correlation with
Anophelesdensity and malaria incidence rate.
-Both environmental and vector factors were analysed. -Factor analysis
-Grey correlation analysis
Bi et al. (2003) English [30]
Sunchen County in Ahui Province 1980-1991
Monthly maximum temperature, minimum
temperature, relative humidity and rainfall
Monthly incidence of malaria
-Spearman correlation
-Monthly average minimum
temperature and total monthly rainfall, at one-month lag were major determinants in the transmission of malaria.
-Non-climatic factors were neglected -Cross-correlation
Table 2 Characteristics of studies on the association between climatic variables and malaria transmission(Continued)
Hu et al. (1998) English [31]
Yunnan Province 1991-1997
Annual rainfall, annual mean temperature
Annual incidence of malaria
- Multiple regression
-Malaria incidence rates are higher in areas with temperature above 18°C, rainfall of more than 1000 mm
-Socioeconomic factors such as income of farmers were taken into account. -GIS
-Every one degree increase in temperature corresponds to 1.2/ 10,000 higher malaria incidence and when rainfall increase by 100 mm, malaria will increase to 100.0/ 10,000
-Annual data were used
Liu et al. (2011) Chinese [32]
Pizhou City, Jiangsu province 2001-2006
Monthly mean temperature, maximum temperature, minimum temperature, rainfall days, relative humidity, evaporation, total cloud cover, sunlight time and low cloud.
Monthly incidence of malaria
-Correlation analysis
-The incidence of malaria was passive relative to temperature, rainfall, relative humidity, evaporation and total cloud cover, but no relation with low cloud and sunlight.
-Various meteorological variables were considered -Multiple
regression
-Only one city was analysed based on a relative short study period
-The monthly minimum temperature and relative humidity were two major factors influencing malaria transmission.
Wu et al. (2011) Chinese [33]
Dianjiang county, Chongqing 1957-2010
Monthly mean temperature, maximum temperature, minimum temperature, rainfall days, relative humidity, absolute humidity, duration of sunshine, air pressure and wind speed.
Case counts -Principal Component Analysis
-Significant associations between malaria incidence and monthly mean temperature, rainfall and duration of sunshine were observed.
-Various meteorological variables were considered -Multiple
regression -Long-term data
from a fifty-four -years period -Only one county considered -Temperature was
greatest relative to malaria transmission
Huang et al. (2009) Chinese [34]
Tongbai and Dabie mountain areas, Huibei Province 1990-2007
Monthly mean temperature, maximum temperature, minimum
temperature, rainfall.
Case counts Descriptive study -Temperature and rainfall were major determinants for malaria transmission and the yearly peak of cases occurred one month after the rainy season.
-Not enough statistical methods
Wang et al. (2009) Chinese [35]
Anhui Province 2004-2006
Annually mean temperature and rainfall NDVI and elevation.
Cases counts -Principal Component Analysis
-Malaria transmission intensity was positively associated with the NDVI, but negatively associated with minimum temperature, rainfall and elevation.
-Annual indicators were used
-Logistic regression
-A two-years short period of study.
-GIS
Wen et al. (2008) Chinese [36]
Hainan Province May-Oct in 2002
Monthly mean temperature, maximum temperature, minimum
Monthly incidence of malaria
-Spearman correlation
-No associations between
meteorological factors and malaria incidence were observed.
Table 2 Characteristics of studies on the association between climatic variables and malaria transmission(Continued)
temperature, rainfall, relative humidity, land use, land surface temperature (LST) and elevation.
However, land use, elevation and LST appeared to be good contributors of malaria transmission. -Negative
binomial regression analysis
-A six-month short period of study.
Su et al. (2006) Chinese [37]
Hainan Province 1995
Monthly mean temperature, maximum temperature, minimum
temperature, rainfall, relative humidity and NDVI.
Monthly incidence of malaria
-Factor Analysis -Rainfall and the NDVI may be used to explain the malaria transmission and distribution.
-A one-year short period of study. -Principal
Component Analysis
-Multiple liner regression analysis
Fan et al. (2005) Chinese [38]
Ailao mountain of Yuxi city in Yunnan Province 1993-2002
Annual man temperature and rainfall
Anopheles minimusdensity
-Correlation analysis
-Significant relationship between malaria incidence and abundance of
Anopheles minimus. However, no significant correlations between abundance ofAnopheles minimus
and climatic variables.
-No disease data
-Annual data used
Wen et al. (2005) Chinese [39]
Hainan Province Feb 1995- Jan 1996
NDVI Monthly incidence
of malaria
-Spearman correlation
-Malaria prevalence was highly associated with NDVI value which could be used for malaria
surveillance in Hainan province.
-A short study period
-GIS -No other climatic
indicators used
Huang et al. (2004) Chinese [40]
Luodian county 1951–2000 Libo county 1958–2000 Sandu county 1960–2000 Pintang county 1961–2000 Dushan county1951-2000 Guizhou Province
Monthly mean temperature, rainfall, relative humidity
Monthly incidence of malaria
-Correlation analysis
-Significant relationship between malaria incidence and climatic factors, but the influences of different climatic variables were not consistent among the eight study counties.
-Relative long study periods
-Path analysis -Direct and
indirect effects of climate were analysed by Path analysis
-The influence of climate on malaria was greater in Libo, Sandu, Dushan counties than in Luodian and Pintang counties
Gao et al. (2003) Chinese [41]
Yunnan Province 1994-1999
Monthly mean temperature, maximum temperature, minimum
temperature, rainfall, relative humidity, rain day, evaporation and sunshine hours
Monthly incidence of malaria
-Back Propagation Network Model
-The efficiency of malaria forecasting was 84. 85% based on meteorological variables.
-Descriptions of associations between malaria and climate was inadequate
-A five-years short study period
Wen et al. (2003) Chinese [42]
Hainan Province 1995-2000
Monthly average temperature, maximum temperature, minimum
temperature, rainfall, relative humidity
Monthly incidence of malaria
-Correlation analysis
-Temperature and rainfall were relative to malaria transmission with various lag times, but relative humidity was not.
-Analysis of high epidemic area and the whole province -Social-economic factors were neglected -Stepwise
regression analysis
potential risk factors of malaria transmission [26,31]. Clements et al. (2009) demonstrated that for P. vivax the relative risk appeared to cycle every 3 to 4 years, whereas for P. falciparum the pattern was less regular [26]. Hui et al. (2009) found that the influence of me-teorological variables on P. vivax malaria was greater than that of P. falciparum malaria, especially in cluster areas, indicatingP. vivax malaria may be more climate-sensitive [31].
Almost all of these analyses identified a positive association between temperature indices and malaria transmission. Some studies also reported that temperature was the most important climatic determinant in the trans-mission of malaria. For example, a study conducted in
Jinan, which is a temperate city in northern China, showed that a 1°C rise in maximum temperature may be related to a 7.7% to 12.7% increase in the number of mal-aria cases, while a 1°C rise in minimum temperature may result in approximately 11.8% to 12.7% increase in cases [22]. Zhou et al. (2010) revealed that temperature was a key meteorological factor correlated to malaria incidence, implying the potential role of global warming in malaria re-emergence in central China early in the 21th century, especially in Anhui, Henan and Hubei Provinces along the Huang-Huai River [21]. However, the association between temperature variables and malaria incidence may not be constant year-round. Tian et al. (2008) emphasized the stronger effect of minimum temperature on malaria Table 2 Characteristics of studies on the association between climatic variables and malaria
transmission(Continued)
malaria was more obvious in high epidemic area than that in the whole province
Huang et al. (2002) Chinese [43]
Jiangsu Province 1973-1983
Monthly rainfall, rain days, relative humidity, evaporation and NDVI
Monthly incidence of malaria
-Correlation analysis
-The NDVI positively correlated with precipitation and relative humidity.
-No temperature data included
-GIS -Only correlation
method used -The NDVI may be a
good indicator to predict the distribution and transmission of malaria.
Huang et al. (2001) Chinese [44]
Gaoan city, Jiangxi Province 1962-1999
Annually average rainfall during April to June, annually average temperature during July to August, annual average rainfall and temperature
Case counts -Circular distribution method
-Malaria cases increased with increase of average temperature from July to August and rainfall from April to June.
-Annual index were used
-Descriptive study
Kan et al. (1999) Chinese [45]
Anhui Province 1969-1999
Annual temperature and rainfall
Annual incidence of malaria
-Descriptive study -Annual incidences of malaria in 1975, 1977, 1980 in Madian, Lixin County increased with increase of rainfall, while decreased in 1976, 1978, 1981 with decreased rainfall
-Not enough explanation on effects of climate factors on malaria.
-No statistical methods used
Yu et al. (1995) Chinese [46]
Libo County, Guizhou Province 1958-1993
Monthly average temperature, rainfall, relative humidity
Monthly incidence of malaria
-Correlation analysis
-Positive associations between malaria incidence and climatic factors were observed.
-Relative long study periods
-Path analysis -Direct and
indirect effects of climate were analysed -Direct effect of
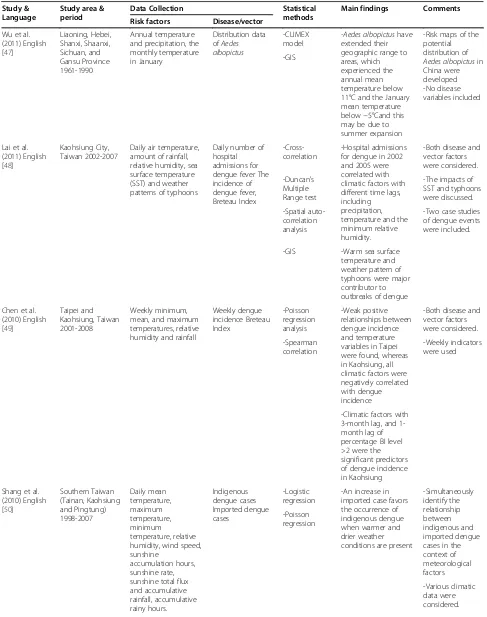
Table 3 Characteristics of studies on the association between climatic variables and dengue transmission
Study & Language
Study area & period
Data Collection Statistical methods
Main findings Comments
Risk factors Disease/vector
Wu et al. (2011) English [47]
Liaoning, Hebei, Shanxi, Shaanxi, Sichuan, and Gansu Province 1961-1990
Annual temperature and precipitation, the monthly temperature in January
Distribution data ofAedes albopictus
-CLIMEX model
-Aedes albopictushave extended their geographic range to areas, which experienced the annual mean temperature below 11°C and the January mean temperature below−5°Cand this may be due to summer expansion
-Risk maps of the potential distribution of
Aedes albopictusin China were developed -No disease variables included -GIS
Lai et al. (2011) English [48]
Kaohsiung City, Taiwan 2002-2007
Daily air temperature, amount of rainfall, relative humidity, sea surface temperature (SST) and weather patterns of typhoons
Daily number of hospital admissions for dengue fever The incidence of dengue fever, Breteau Index
-Cross-correlation
-Hospital admissions for dengue in 2002 and 2005 were correlated with climatic factors with different time lags, including precipitation, temperature and the minimum relative humidity.
-Both disease and vector factors were considered.
-Duncan's Multiple Range test
-The impacts of SST and typhoons were discussed.
-Two case studies of dengue events were included. -Spatial
auto-correlation analysis
-Warm sea surface temperature and weather pattern of typhoons were major contributor to outbreaks of dengue -GIS
Chen et al. (2010) English [49]
Taipei and Kaohsiung, Taiwan 2001-2008
Weekly minimum, mean, and maximum temperatures, relative humidity and rainfall
Weekly dengue incidence Breteau Index
-Poisson regression analysis
-Weak positive relationships between dengue incidence and temperature variables in Taipei were found, whereas in Kaohsiung, all climatic factors were negatively correlated with dengue incidence
-Both disease and vector factors were considered.
-Weekly indicators were used -Spearman
correlation
-Climatic factors with 3-month lag, and 1-month lag of percentage BI level >2 were the significant predictors of dengue incidence in Kaohsiung
Shang et al. (2010) English [50]
Southern Taiwan (Tainan, Kaohsiung and Pingtung) 1998-2007
Daily mean temperature, maximum temperature, minimum
temperature, relative humidity, wind speed, sunshine
accumulation hours, sunshine rate, sunshine total flux and accumulative rainfall, accumulative rainy hours.
Indigenous dengue cases Imported dengue cases
-Logistic regression
-An increase in imported case favors the occurrence of indigenous dengue when warmer and drier weather conditions are present
-Simultaneously identify the relationship between indigenous and imported dengue cases in the context of meteorological factors -Poisson
regression
Table 3 Characteristics of studies on the association between climatic variables and dengue transmission(Continued)
Lu et al. (2009) English [51]
Guangzhou City, Guangdong Province 2001-2006 Monthly minimum temperature, maximum temperature, total rainfall, minimum relative humidity,wind velocity Monthly dengue fever cases and incidences -Spearman correlation -Dengue incidence was positively associated with minimum temperature and negatively with wind velocity.
-A relative short 5-years study period.
-Other environmental and host factors were ignored. -Poisson
regression
Hsieh et al. (2009) English [52]
Taiwan 2007 Typhoons, weekly temperature and total precipitation
Weekly dengue incidence Initial reproduction numbers for the multi-wave outbreaks -Correlation analysis -A two-wave outbreaks with multiple turning points in 2007 were appeared to be led by the drastic drop in temperature and unusually large rainfall caused by the two consecutive typhoons.
-The important role of climatological events in dengue outbreaks was evaluated. -Multi-phase
Richards model
Yang et al. (2009) English [53]
Cixi area, Zhejiang Province (July-October, 2004)
Daily average temperature, rainfall, relative humidity
Case counts -Descriptive analysis
-No relationship between the incidence of dengue and meteorological factors was observed during the outbreak in 2007
-A short 6-months study period.
- No statistical methods
Wu et al. (2009) English [54]
Taiwan 1998-2002 Monthly temperature and rainfall Urbanization level Monthly incidence BI -Principle components analysis
-Numbers of months with average temperature higher than 18°C and high degree of urbanization were identified as significant indicators for dengue fever infections -Both climatic variables and socioeconomic factors were considered. -Logistic regression -GIS
Wu et al. (2007) English [55]
Kaohsiung city, Taiwan 1998-2003 Monthly average temperature, maximum temperature, minimum temperature, relative humidity, and amount of rainfall Monthly incidence Vector density -Cross-correlation -Increased incidence of dengue fever was associated with decreased temperature and relative humidity.
-Vector density was analyzed with dengue incidence Only one city was conducted
-Auto-correlation
-Vector density did not found to be a good contributor of disease occurrences. -ARIMA
models
Lu et al. 2010 Chinese [56]
The P.R. China 1970–2000 Guangzhou City and Fujian Province and Ningbo City 2004-2006 Weekly average temperature, maximum temperature, minimum temperature, relative humidity, rainfall and duration of sunshine
Case counts -Correlation analysis -GIS
-DF outbreaks were significantly correlated with climatic variables with 8–10 weeks lags.
-A risk map of DF outbreaks for China with suitable weather conditions was developed
Yu et al. (2005) Chinese [57]
Hainan Province (before1986, 1986–2001)
Monthly temperature of January Predicted temperature of winter in 2020, 2030 and 2050
Infectious life span of infected mosquito -Descriptive analysis -Based on assumptions that temperatures in winter will increase by 1°C and 2°C in 2030 and 2050 respectively, half of or more areas in Hainan Province may be potentially favorable for dengue transmission all the year around by 2030 and 2050.
-Long-term temperature data were collected
-GIS -Only considered
the temperature -Calculation of infectious life span of mosquito in different time periods
incidence in the cool months in the rain forest area of Mengla County, Yunnan province, indicating increased risk of transmission as a result of warmer winters [27]. Al-though global warning could make more areas climato-logically suitable for malarial transmission; because higher temperature promotes mosquito development, virus repli-cation and feeding frequency of mosquitoes, extreme high temperature can also restrict the growth of mosquitoes and reduce the spread of malaria. Typically, temperatures lower than 16°C or higher than 30°C have a negative im-pact on the development and activities of mosquitoes [30]. High relative humidity is expected to prolong the life of the mosquito enabling it to transmit the infection to several persons. Correlations between relative humidity and malarial transmission were also detected in some re-gions in China [19,20,23-25,30,32,39,40,46]. According to results from regression models based on 15 years of data, Yang et al. (2010) found that relative humidity was more important than rainfall and temperature in addressing
the climate-malaria relationship in China [23]. In Motou County of Tibet, Huang et al. (2011) found that relative humidity, which was greatest relative to malaria inci-dence among meteorological variables as it is a result of temperature, rainfall and other climatic indicators and influenced the activity of mosquito directly such as biting rate and breeding rate [20]. The distribution of mosquitoes, which also is also dependent on relative hu-midity, determines the extent of malarial spread. Thus, no malaria transmission occurs where the monthly aver-age relative humidity is lower than 60% [23]. Con-versely, it was reported that relative humidity is not a restricting factor in areas where it is higher than 60%, but temperature then becomes the major driver [23]. For example, no association of relative humidity and malaria transmission was detected in Hainan province [24,42] and the tropical rain forest regions of Yunnan provinces [27], where the relative humidity throughout the years is much higher than 60%. This indicates that it Table 3 Characteristics of studies on the association between climatic variables and dengue transmission(Continued)
Chen et al. (2003) Chinese [58]
Nine cities of Guangdong Province (Dec 2000- Nov 2001)
Monthly mean temperature, relative humidity, rainfall and rainy days
Case counts Breteau index
-Descriptive analysis
-The dengue fever intensity was highly related to increased temperature (>26°C), rainfall and consecutive rainy days (>10 days).
-Study period was short
-No statistical methods
Yi et al. (2003) Chinese [59]
Chaozhou City, Guangdong Province 1995-2001
Monthly mean temperature, maximum temperature, minimum
temperature, relative humidity, rainfall, rainy days, duration of sunshine
Case counts Breteau index
-Pearson correlation
-Aedesdensity was positively correlated with temperature, rainfall, number of rainy days, duration of sunshine and negatively linked to relative humidity. -Minimum temperature, rainfall and relative humidity are good predictors ofAdedsdensity and dengue transmission.
-Various meteorological variables were used -Lag times of climatic factors were not analysed -Both climatic variables and vector factors considered. -Stepwise
regression
-Logistic regression
Chen et al. (2002) Chinese [60]
Hainan Province 1987-1996
Monthly temperature Infectious life span of infected mosquito
-Descriptive analysis
-If temperature increase by 1-2°C in winter, Hainan Province will be suitable for dengue transmission all the year around in future due to prolonged infectious life of mosquito.
-Only considered the role of temperature
-No statistical methods -Calculation of
infectious life span of mosquito under different temperature
Zheng et al. (2001) Chinese [61]
Fuzhou City, Fujian Province (2000–2001)
Monthly mean temperature, relative humidity, rainfall
Larva Density, House Index, Container Index, Breteau index, case counts
-Descriptive analysis
-The temperature and rainfall played a considerable role in vector density and dengue transmission, whereas relative humidity showed a little relationship.
Table 4 Characteristics of studies on the association between climatic variables and JE transmission
Study & Language
Study area & period
Data Collection Statistical Methods
Main findings Comments
Risk factors Disease/vector
Lin et al. (2010) English [62]
Linyi city, Shangdong Province 1956-2004
Monthly average temperature, relative humidity, total rainfall. Vaccination
Monthly incidence -Cross-correlation -Monthly average temperature and relative humidity with no lag were positively associated with the JE incidence after adjusting for the effect of vaccination.
-Vaccination effect was adjusted, but only treated as a simple binary variable. -ARIMA model
Bi et al. (2007) English [63]
Jinan city, Shangdong Province 1959-1979
Monthly mean maximum temperature, minimum
temperature, relative humidity, rainfall and air pressure.
Case counts -Spearman correlation
-The JE incidence was positively associated with two temperature variables, rainfall and relative humidity, and negatively correlated with air pressure. Lag times were from one to two months
-A potential threshold of the effect of temperature was detected. -Poisson
regression
-The effect of the vaccination was very limited during the study period of this study.
-The Hockey Stick model
-Thresholds of 25.2°C for maximum temperature and 21.0°C were indentified.
-Non-climatic factors were neglected
HSU et al. (2008) English [64]
Taiwan 1991-2005 Monthly temperature and precipitation Pig density Vaccination
Case counts -Poisson regression
-The monthly temperature and precipitation with two months lags and the pig density were significantly associated with JE cases.
-Adjustment for vaccination, pig density and seasonal factors.
-No significant relationship between vaccination rate and counts of JE cases was found.
Bi et al. (2003) English [65]
Jieshou County, Anhui Province 1980-1996
Monthly mean maximum temperature, minimum temperature and rainfall
Monthly incidence -Spearman correlation
-The monthly minimum temperature and precipitation had a significant relationship with JE incidence, with a one-month lag
-Vaccination and other non-climatic factors were neglected -Multiple linear
regression
Huo et al. (2011) Chinese [66]
Hebei Province Tianjin City Beijing City Inner Mongolia Shanxi Province 1994-2000
Annual mean temperature, maximum
temperature, relative humidity, minimum humidity, rainfall and duration of sunshine
Annual incidence –Poisson regression
-The annual incidence of JE was found to be positively correlated with annual mean relative humidity and negatively associated with duration of sunshine
-Yearly variables were use
-Non-climatic factors were neglected
Xu et al. (2009) Chinese [67]
Tongren area, Guizhou Province 1983-2003
Monthly mean temperature, air pressure, relative humidity, rainfall, wind velocity, duration of sunshine
Case counts -Multiple regression analysis.
-Among various climatic variables, the transmission of JE was only correlated with duration of sunshine.
-Non-climatic factors such as vaccination were not adjusted
-Only one area were analyzed
Gao et al. (2009) Chinese [68]
Guiyang City, Guizhou Province 1956-2005
Annual mean temperature and precipitation Monthly mean temperature
Annual incidence -Descriptive analysis
-Temperature and precipitation were correlated with the incidence of JE, especially in July.
-Fifty years long-term data were collected
Table 4 Characteristics of studies on the association between climatic variables and JE transmission(Continued)
and precipitation of June, July and August.
Liu et al. (2008) Chinese [69]
Kaijiang County, Sichuan Province 1975-1993
Mean temperature, relative humidity, rainfall, duration of sunshine during November and December, July and August, January and June respectively.
Annual incidence -Correlation analysis
-Duration of sunshine and temperature were most closely associated with JE incidence.
-Only one county was analyzed
-Annual indicators were used -Grey correlation
analysis
-Non-climatic factors such as vaccination were ignored.
Qu et al. (2006) Chinese [70]
Chaoyang City, Liaoning Province 1981-1994
Annual mean air pressure, precipitation, air temperature, ground temperature, maximum air temperature, minimum ground temperature, evaporation and extreme maximum and minimum temperature
Annual incidence -Correlation analysis
-The JE incidence was negatively correlated with air pressure, and positively correlated with evaporation, maximum temperature and extreme maximum temperature.
-Various
meteorological factors were applied
-Back propagation artificial neural network
-The predictive ability of the BP neural network model is not very strong.
Zhang et al. (2004) Chinese [71]
Dali, Yunnan Province 1992-2001
Mean temperature in May, rainfall in September, annual mean temperature, rainfall estimated vaccination coverage, paddy field areas
Annual incidence -Correlation analysis
-The annual JE incidence was found to be correlated with temperature and rainfall. No
relationships between the JE incidence and estimated vaccination, as well as paddy field areas were found.
-Use of approximate estimated vaccination data
-Multiple regression
-Data of paddy field areas were collected.
Liu et al. (2003) Chinese [72]
Chaoyang City, Liaoning Province 1983-2002
Mean temperature and rainfall during June and August, annual mean rainfall
Annual incidence -Correlation analysis
-The annual JE incidence was just correlated to the rainfall in July among climatic factors selected.
-Non-climatic factors such as vaccination were ignored. -Multiple
regression -Annual incidence
was used
Shen et al. (2002) Chinese [73]
Shanghai 1952-1997
Monthly temperature of June, July and August respectively, total rainfall of June and July Areas of rice field, pig rising, mosquito density, vaccination rate
Annual incidence -Descriptive analysis
-No obvious relationships between JE incidence and climatic factors and areas of rice field as well as pig rising were observed, implying that the decrease of JE incidence during study period may be due to massive vaccination conducted in Shanghai.
-Both climatic and non-climatic data were collected
-Climatic variables only in three months were analysis
Zhang et al. (1997) Chinese [74]
Henan Province Not specific
Temperature, rainfall Elevation
Case count JE incidence
-Correlation analysis
-The JE incidence was positively correlated with temperature and rainfall, but decreased with increased elevation.
-The impact of vaccination was ignored
-Data collection was not described clearly
Feng et al. (1996) Chinese [75]
Fengyi of Eyuan County, Dali, Yunnan Province 1991
Monthly mean temperature and rainfall
Monthly incidence -Descriptive analysis
-The monthly incidence was found to be related to monthly temperature and rainfall
is not necessary to consider humidity when making malaria epidemic predictions in areas of consistently high humidity.
The impact of precipitation on malaria transmission is inconsistent across geographical locations in China. Some studies indicated that rainfall was closely corre-lated to malaria incidence [19-21,23-26,30-35,37,39,40], whereas some failed to detect such an association [22,27,36]. Rainfall not only provides the medium for the mosquito life cycle, but is also related to high humidity, thereby enhancing mosquito survival. Using Bayesian hierarchical models, Huang et al. (2011) showed that the way rainfall influenced malaria incidence in central China was different from other climatic factors. This im-plies that malaria incidence is more sensitive to rainfall compared to other meteorlogic variables [20]. However, the association between mosquito abundance and rain-fall is non-linear. Excessive rainrain-fall often leads to small puddles serving as mosquito breeding sites and therefore increases malaria transmission. But heavy rain may des-troy existing breeding places and flush the eggs or larvae out leading to reduced transmission [25,30]. A negative effect of rainfall on malaria spread was detected by Wang et al. in Anhui province, which identified that every 1 mm annual rainfall increase corresponds to 27% decrease of malaria cases [35]. Fog precipitation, as an-other important source of water in many mountainous and coastal regions, was first found to be a predictor of malaria in the tropical rain forest area of Mengla County, southwest China by Tian et al. [27].
In some studies ecological proxy indicators such as Normalized Difference Vegetation Index (NDVI) [29,35, 37,39,43] and South Oscillation Index (SOI) [28] were also analyzed for the detection of the climate-malaria relation-ship. For example, in southeastern Yunnan Province, remote sensing NDVI was found to be a sensitive evalu-ation index of Anopheles density and malaria incidence rate by using grey correlation analysis [29]. The EI Nino-Southern Oscillation (ENSO) represents a peri-odic variation in the atmospheric conditions and ocean surface temperatures of the tropical Pacific and was de-termined to have a positive influence on malaria inci-dence in Anhui province, China [28].
The effect of climatic factors on mosquito-borne dis-eases including malaria is not immediate and usually re-sults in a lag-time due to the life cycle of the vector and the parasite [20]. Lag times of different climate indica-tors were analyzed in some studies on different geo-graphical and temporal scales. For example, Zhou et al. (2010) reported a 75.3% change in monthly malaria incidence was correlated with the average monthly temperature, the average temperature of last two months and the average rainfall of current month in central China [21]. In Yunnan Province, obvious associations
between bothP. vivaxandP. falciparummalaria and cli-matic factors with a clear one-month lagged effect were found [25]. It is essential to take lag effect into account in addressing the impact of climate change at a local level because it provides important information for early detection and warning for mosquito-borne diseases.
Dengue fever
Dengue fever is the most common arboviral disease in the tropics and subtropics, and about 2.5 billion people live in regions at risk for dengue transmission [77]. Since the first recorded outbreak of dengue fever in Foshang City in 1978, dengue occurs frequently in southern China, including Guangdong, Guangxi, Hainan, Taiwan, Fujian, Zhejiang and Yunnan [78]. In China, Aedes albopictus is the most important mosquito in dengue transmission in China. Due to its wider geographic dis-tribution it could be responsible for recent dengue out-breaks in Guangzhou and Zhejiang Province [79]. As another major vector of dengue virus, distribution of Aedes aegypti which was previously considered only in the coastal areas of the tropical zone below 22° N lati-tude has already extended into regions of 25° N latilati-tude, such as Yunnan Province [80].
Recently, the impacts of climate change on dengue transmission and dengue vector distribution in China have been evaluated and identified in limited studies [47-61]. Although meteorology alone does not initiate dengue epidemics and it is reported that there appears to be a smaller climatic effect on this disease than occurs with other arboviruses [81]. Temperature, rainfall and relative humidity were considered major meteorological determinants in most of studies, whereas one study from Cixi, Zhejian Province reported no correlation between dengue outbreaks and climatic factors [53]. This is per-haps due to the non-endemic nature of dengue in Cixi and a short (4-month) study period.
areas which experienced an annual mean temperature below 11°C and a January mean temperature below -5°C. This finding highlights that most provinces and cities in China now support survival and development of Ae. albopictusand risk the occurrence of dengue fever or the establishment of dengue virus in the mosquito population [47]. In subtropical Taiwan, it was found that every 1°C in-crease of monthly average temperature could lead to 1.96 times increase of the total population at risk for dengue fever transmission, indicating that a slight increase in temperature could result in epidemics of this disease [55]. Therefore, climate change, particularly a warming trend, increases the land area suitable for disease vectors,altering or increasing dengue fever distribution. Furthermore, other climatic indicators such as rainfall, relative humidity and wind velocity together with temperature can be sig-nificant predictors of dengue incidence. For example, Lu et al. (2009) showed that in Guangzhou City minimum temperature and minimum humidity, at a lag of one month, were positively associated with dengue incidence, whereas an obvious negative effect of wind velocity on dengue cases was observed in the same month [51].
Unfortunately, less work was conducted to relate den-gue outbreaks and climatological events in mainland China. Several studies in Taiwan reported that typhoons remain an important factor affecting vector population and dengue fever [48,52]. Lai (2011) found that two out-breaks of dengue and increasing vector population in Kaohsiung, Taiwan in 2002 and 2005 were exacerbated by hot and wet climate conditions caused by warm sea surface temperatures and typhoon weather patterns [48]. Typhoons could result in massive rainfall, high humidity and water pooling resulting in mosquito breeding sites [48]. Conversely, a sharp drop in temperature and sub-stantial rainfall caused by frequent typhoons may con-tribute to a temporary reduction in dengue infections [52]. More research on the impact of extreme climatic conditions such as floods, droughts, typhoons and storms on mosquito-borne diseases are needed in China. Along with climatic drivers, many site-specific varia-tions in some factors affecting dengue transmission, such as mosquito density, imported cases and other en-vironmental factors were also identified and highlighted in a few studies in China [48-50,53,55,59]. Indices such as the Breteau Index (BI), Housing Index (HI) and Con-tainer Index (CI) were traditionally employed to deter-mine mosquito density. In Kaohsiung city, Taiwan, the BI, which indicates the number of positive containers per 100 houses, in addition to local climatic factors were found to be good predictors of dengue incidence [49]. Similarly, Lai et al. (2011) demonstrated that the number of dengue fever admissions in Kaohsiung city was significantly correlated with BI with a time lag of 32 and 22 -days during both summer and autumn in 2002 and
2005, respectively [48]. From a spatial standpoint, one study examined the relationships among weather profiles, environmental factors of interest, socioeconomic factors and geographical distributions of dengue fever and showed the number of months with average temperature higher than 18°C and the level of urbanization were sig-nificantly associated with dengue fever risk at the town-ship level in Taiwan [54]. Using logistic and Poisson regression models, Shang et al. (2010) emphasized the importance of imported case and favorable climate condi-tions in the initiation of dengue epidemics, also highlight-ing that the development of an early warnhighlight-ing surveillance system, utilizing relevant meteorological information, will be an invaluable tool for prevention and control of dengue fever [50]. Other environmental and host factors, such as intervention measures and human risk behaviors, also in-fluence mosquito populations and the extent of dengue spread. Thus, more work should be conducted in the future for a better understanding of these complex interactions.
Japanese Encephalitis
Japanese encephalitis (JE), a mosquito-borne viral dis-ease, is mostly transmitted byCulex tritaeniorhynchusin China, with pigs as a reservoir host and source of infec-tion [87]. Due to mass vaccinainfec-tion the 1980s and im-proved economic circumstances in China, the morbidity and mortality due to JE has declined gradually each year [88]. Over a 6-year period between 2000 and 2005, the an-nual incidence decreased from 0.9489/100,000 to 0.3898/ 100,000 [88]. Similar findings were also observed in Taiwan. Since mass vaccination was implemented in 1968, the incidence of JE has declined from 2.05/10000 to 0.03/ 10000 in ten years from 1967 to1997 in Taiwan [89]. How-ever, JE is still one of an acute epidemic disease posing a threat to public health, and it has recently spread to new territories [88]. In 2009, JE virus was isolated from Cu. tritaeniorhynchus mosquitoes collected in Tibet, indicat-ing that JE virus has extended its geographical range to a region that was previously non-endemic due to high ele-vation [90]. Such trends in geographical spread of JE were also recently reported in other countries such as Australia [91-93]. Highly endemic areas of JE in China in-clude Sichuan Province, Guizhou Province, Chongqing Municipality, Yunnan Province and Shaanxi Province, which are mainly located in southwest and central China. The five provinces account for 50% of the total cases nationwide [88].
humidity [96]. Studies in different areas of Asia have also shown the likely influence of climate on the incidence of JE [97-99]. However, little research has been conducted to examine the effect of climatic variables, along with mass vaccination and other non-climatic drivers in China. Bi et al. (2007) have identified positive relationships be-tween climatic variables (monthly maximum temperature, minimum temperature and total rainfall) and JE transmis-sion in a rural region of Anhui Province [65] and a metro-politan area of Shangdong Province [63] where no rice was grown and the role of pigs in disease transmission was not fully understood [63]. Unfortunately, the effects of vaccination on JE control in the two areas were very limited during the study periods. In the metropolitan area of Jinan city, a potential threshold of the effect of temperature on JE was also detected by the Hockey Stick model which is based on the assumption that temperature has no effect on JE cases until a threshold value. When the monthly mean maximum temperature was higher 25.2°C or the minimum temperature was over 21.0°C, an obvious increase in JE cases occurred [63]. These findings are consistent with the threshold temperature detection in previous Chinese studies [87]. Using ARIMA models, Lin et al. (2011) suggested that monthly average temperature and relative humidity at 0-month lag were positively associated with JE incidence in Linyi, another city of Shangdong Province after adjusting for mass vaccination in this area [62]. Time lag-0 of climate variables was per-haps because the behaviour of pig breeding in Linyi, along with the high density of mosquitoes help to shorten the transmission cycle [62]. With adjustment of more inter-actional factors including seasonal pattern, time trend, pig density, 23 geographic areas representing location of farm and paddy cultivation, and vaccination coverage, HSU et al. (2008) identified the significant effects of monthly temperature and rainfall with two months lag on the monthly occurrence of JE in Taiwan [64]. Similarly, temperature and rainfall were two significant determi-nants of JE spread with control of vaccination coverage and paddy field areas [71].
Few analyses, without controlling for non-climatic fac-tors that potentially affect JE transmission, also reported associations between different climatic variables such as temperature, rainfall and JE annual incidence by correl-ation and regression analyses [66-69,72,74]. Using mul-tiple stepwise regression, Xu et al. (2009) found that among various meteorological indicators the transmis-sion of JE was only correlated with duration of sunshine in Tongren area, Guizhou Province [67]. Similarly, a close relationship between sunshine and annual incidence of JE was also reported by Huo et al. [66] and Liu et al. [69] in north China and Kaijiang county of Sichuan Province in Southwestern China, respectively. Applying correlation analysis and back propagation artificial neural
work, the annual JE incidence was found to be negatively correlated with mean air pressure, and positively corre-lated with mean evaporation, maximum temperature and extreme maximum temperature [70]. In future research investigating the influence of climate change on JE trans-mission, important factors should be measured and con-trolled for, such as social- economic status, population immunity (including vaccination), mosquito control mea-sures, pig rising, areas of rice field and the virulence of the virus. Moreover, research is also needed in sporadic- and meso- endemic areas, such as Jiangxi Province, Hunan Province, Fujian Province and Guangdong Province.
Implications for adaptation in China
The potential effects of climate change on the spatial and temporal distribution of mosquito-borne diseases and vec-tors in China have been summarized in this review. Fur-thermore, the synthesis of the literature shows an urgent need for improving current control policies and developing targeted adaptive strategies in China to address mosquito-borne disease. Although some health benefits have also been achieved through mitigation policies in China, adap-tation, preparing to manage some of the unavoidable ef-fects of climate change on human health, is another important response strategy [100]. Based in part on recom-mendations and established approaches in recent studies of adaptation to climate change [81,101-105], as well as on the status of mosquito-borne diseases in China, we high-light five principles to guide timely development of adapta-tion mechanism to reduce the adverse impacts of climate change on the control of mosquito-borne diseases. These guidelines may also be applicable in addressing the threat to other health outcomes from climate change.
Improving current surveillance and monitoring systems integrated with climate-sensitive conditions
For example, onset dates rather than notification dates are not available, which may lead to considerable information bias. According to a national report in 2005, it was also es-timated that only 1/18 (5.6%) malaria cases in China are reported [107]. Furthermore, lack of routine data collec-tion of vectorial indicators has restricted our understand-ing of real geographic and temporal distributions of mosquito vectors.
Under the circumstance of the changing climate, truly effective surveillance systems and monitoring systems can be used to identify changes in the range and inci-dence of diseases; determine whether these changes are to be the result of climate change; assist the develop-ment of response measures and develop hypotheses about the climate-health relationship [108]. We believe that there are also many gaps for improving current sur-veillance and monitoring of infectious diseases in China in response to climate variation. Surveillance for early detection of epidemics of mosquito-borne diseases based on readily climatic data, such as daily temperature re-cords, in combination with other interactional factors are of paramount importance [108]. For example, an ef-fective early warning system for outbreaks of mosquito-borne diseases based on predicted extreme weather conditions, such as extreme temperature or rainfall, can be considered as an immediate opportunity for adapta-tion by strengthening the preparedness of emergency re-sponse before periods of high-risk [100]. Careful tracking of imported cases, in conjunction with relevant meteoro-logical data, is also of assistance in providing earlier warn-ing signals for emergwarn-ing indigenous epidemics [109,110]. In short, coherent surveillance systems integrated with climate-sensitive conditions are urgently needed to im-prove scientific knowledge about the health risks of cli-mate change, and to prioritize needs for intervention and adaptation options.
Focusing adaptation strategies and policies on vulnerable communities
Some populations and geographical regions will be par-ticularly vulnerable to climate change. Although climate change is a global threat to public health, it is well ac-knowledged that poorer nations and communities who have contributed least to greenhouse gas emissions are most vulnerable to the effects [111]. Higher malaria risk in China has also been associated with poverty, poor quality housing, unhygienic surroundings and agricultural activities in rural and remote areas. Chinese farmers in rural regions who usually work in fields and sleep in the open are at higher risk of mosquito biting especially in summer and autumn, when the peak times of malaria oc-curred due to favorable climate conditions and active propagation of mosquitoes. However, urban populations may also share some increased vulnerabilities in the
context of climate change. For example, populations living in cities located on the coast or on small islands may be particularly vulnerable to frequent rainfall and storms and are also exposed to changes in the spread of mosquito-borne diseases, such as Taiwan. Additionally, metropolitan regions may be experiencing two types of warming trends; warmer temperatures caused by the urban heat island ef-fect as well as global climate change, which could make more urban areas suitable for the transmission of mosquito-borne diseases by reducing development times, increasing survival probabilities and biting frequency for the mosquitoes [102,112].
Due to limited funding, resources, and time, effective adaptive action is required to protect the most vulner-able individuals and communities, due to geographic locations and low adaptive capacity, from inevitable ef-fects of climate change on mosquito-borne diseases. Firstly, better identification of real vulnerable groups needs to be based on more comprehensive factors, such as political rigidity, population growth, poverty, culture, dependency, geographic isolation, population immunity and human perceptions, behaviours and activities etc. This requires both qualitative and quantitative assessing methods in future adaptation research. The next step is the development and implementation of timely and effi-cient adaptive strategies in those targeted communities by collective coordination of all relevant sectors. Adap-tive options may include expanding mosquito control, improving vaccination coverage, enhancing existing elim-ination programs and conducting health education pro-grams in a relative short term, and the establishing an early warning system, improving housing quality, strength-ening preparedness and response of extreme weather events (e.g. better and adequate urban drainage systems) in a long run.
Strengthening the capacity of public health system to adapt climate change
The climate change will have local impacts, and a sig-nificant share of dealing with the adverse impacts of the change will fall on local public health arena. Making cli-mate change adaptation a priority for local public health sectors, however, is challenged in current China due to a chronic lack of resources and limited awareness and knowledge about health impacts of climate change. Dis-appointedly, health implications of climate change have largely neglected in not only developing countries but developed ones, compared with its energy, economic and environmental implications. For example, shortage of public health professionals and small part of research funding of climate change for public health were reported among public health department directors in the U.S., which are also a major challenge for China in adapting the changing climate [114]. Moreover, inaccess-ible information and training on health influences of cli-mate change may restrict awareness, knowledge, attitude and decisions of local public health departments. In brief, adaptation to climate change will require the pub-lic health system has a key leadership role to take in health adaptation strategy making and implementation in China. Stable funding, additional staff and better in-formation access will be needed to best prepare the pub-lic health sectors to manage the health risks associated with climate change.
Developing multidisciplinary approaches sustained by a new mechanism of intersectoral coordination and collaboration
What makes addressing the range and magnitude of health impacts of climate change even more difficult is unavoidable complexities and uncertainties in multi-factorial causal webs. We can not deal with climatic variables or health outcomes or any other potential interacting drivers in isolation and need to integrate scien-tific knowledge from various disciplines to tackle these in-teractions by developing a better collaborated mechanism across all relevant governmental and non-governmental sectors and institutions which are responsible for the pre-vention and control of climate-sensitive disease [101,112]. Although the existing national plans and policies about climate change clearly indicate that adaptation to health burdens from climate-sensitive diseases is a multiple-sector responsibility, mechanisms of intermultiple-sectoral decision making and coordination do not yet operated to guarantee free and open exchange of information, adequate compli-ance and participation, ongoing financial and techno-logical support.
For the control and prevention mosquito-borne dis-eases under condition of climate change, it is even more urgent to produce multidisciplinary insights from diverse public and private sectors. Although some health risks can be reduced largely by health sector interventions
such as surveillance, mosquito control, spraying, vaccin-ation, sanitation activities and health educvaccin-ation, many adverse impacts require concerted adaptive options with other relevant sectors such as meteorology, environmen-tal, urban designing and planning, water, agriculture and housing [101]. Unfortunately, health sectors in China which invest greater financial and resources support, are often the only ones responsible for disease preven-tion and control. Therefore, there is a particular need for a multidisciplinary approach sustained by ongoing intersectoral coordination and collaboration, which not only allow us to have a bettering understanding of the complex climate-health relationship, but will provide in-tegrated and practical adaptive strategies to minimize climate-sensitive disease impairments, and further influ-ence policy-formulation and decision-making [115,116].
Promoting awareness and mobilization of the public and individuals
An important step in the development and promotion of successful local adaptation options is raising public and professional awareness. Governments, institutions, and organizations play indispensable roles in those adaptive actions but so do the public and individuals if they are receptive to behavior change to adapt to a world altered by climate change [101]. It is well acknowledged that the perceived risk of climate change in the population is the strongest motivator of health behaviour change, that is, it is only when individuals feel vulnerable and threatened to the impacts of climate change that they will take au-tonomous adaptation seriously [117]. In China, climate change has traditionally been treated as an environmen-tal threat rather than a public health issue. We highlight that awareness programs about the health aspects of climate change are urgently needed, coupled with high-quality baseline investigations to examine public percep-tion of adverse health effects from climate change in China.