R E S E A R C H
Open Access
Total average diastolic longitudinal
displacement by colour tissue doppler
imaging as an assessment of diastolic
function
Martina Chantal de Knegt
1*, Tor Biering-Sørensen
1, Peter Søgaard
2, Jacob Sivertsen
1, Jan Skov Jensen
1and Rasmus Møgelvang
3Abstract
Background:The current method for a non-invasive assessment of diastolic dysfunction is complex with the use of algorithms of many different echocardiographic parameters. Total average diastolic longitudinal displacement (LD), determined by colour tissue Doppler imaging (TDI) via the measurement of LD during early diastole and atrial contraction, can potentially be used as a simple and reliable alternative.
Methods:In 206 patients, using GE Healthcare Vivid E7 and 9 and Echopac BT11 software, we determined both diastolic LD, measured in the septal and lateral walls in the apical 4-chamber view by TDI, and the degree of diastolic dysfunction, based on current guidelines. Of these 206 patients, 157 had cardiac anomalies that could potentially affect diastolic LD such as severe systolic heart failure (n= 45), LV hypertrophy (n= 49), left ventricular (LV) dilation (n= 30), and mitral regurgitation (n= 33). Intra and interobserver variability of diastolic LD measures was tested in 125 patients.
Results:A linear relationship between total average diastolic LD and the degree of diastolic dysfunction was found. A total average diastolic LD of 10 mm was found to be a consistent threshold for the general discrimination of patients with or without diastolic dysfunction. Using linear regression, total average diastolic LD was estimated to fall by 2.4 mm for every increase in graded severity of diastolic dysfunction (β=−0.61,p-value<0.001). Patients with LV hypertrophy had preserved total average diastolic LD despite being classified as having diastolic dysfunction. Reproducibility of LD measures was acceptable.
Conclusions:There is strong evidence suggesting that patients with a total average diastolic LD under 10 mm have diastolic dysfunction.
Keywords:Echocardiography, Colour tissue Doppler imaging, Diastolic function, Diastolic longitudinal displacement
Background
There is no simple means of reliably diagnosing left ven-tricular (LV) diastolic dysfunction: The current method for a non-invasive assessment of diastolic function re-quires the use of algorithms primarily based on a pulsed Doppler measurement of early mitral inflow velocity (E) and a colour tissue Doppler imaging (TDI) assessment
of early mitral annular velocity (e’), thereby giving an indirect assessment of LV filling pressures (E/e’), as determined by the Bernouili principle and Laplace law [1]. Other parameters include an assessment of early and atrial mitral inflow patterns (E/A), deceleration time (DT), and left atrial (LA) volume [2]. Using these param-eters, LV diastolic dysfunction is traditionally classified as grade 1: abnormal relaxation; grade 2: pseudonormal relaxation, or grade 3: restrictive filling pattern.
* Correspondence:martinadeknegt@gmail.com 1
Herlev and Gentofte Hospital, Department of Cardiology, Faculty of Health Sciences, University of Copenhagen, Copenhagen, Denmark
Full list of author information is available at the end of the article
Even though it is agreed that no single current echocardiographic measure is sufficient for a diagnosis of LV diastolic dysfunction, the use of algorithms of many different echocardiographic parameters is also problematic as a situation of “one size fits all” arises. Additionally, the fundamental use of velocity based parameters in these algorithms is deficient as the use of velocities as a determinant of diastolic function only takes one snapshot of imaging into consideration, thereby making an accurate depiction of severity difficult to obtain, especially in patients with atrial fibrillation. Lastly, the echocardiographic parameters used in these algorithms are only estimates of LV filling pressures and are subject to limitations of the imaging technique, such as angle dependency, sample volume, and tethering arti-facts as well as to shortcomings inherent to derivation of pressures from inflow or re-extension signals [1].
Furthermore, the reliability, feasibility, and practical util-ity of the individual markers of diastolic dysfunction have been questioned and concordance has been shown to be poor [3, 4]. With regards to e’, septal and lateral measure-ments differ and it has, therefore, been recommended that averages be used [5]. e’can also be reduced inaccurately by mitral annular calcification, surgical rings, or prosthetic valves [1]. With regards to E/e’, pulsed Doppler velocities have been shown to overestimate colour TDI velocities, thereby, potentially leading to error in the assessment of LV diastolic function [6]. The use of E/e’ has also been questioned in patients with hypertrophic and dilated car-diomyopathy and in decompensated patients with
resyn-chronization therapy [7, 8]. Moreover, E/e’ >15 is
associated with an elevated LV filling pressure and E/e’<8 is evidence of normal filling pressure - there is, therefore, a big gap (between E/e' 8-15) for which additional invgations are required to obtain a LV filling pressure esti-mate [1]. The use of E/A and DT is also problematic as both measures are bimodal and a situation with pseudo-normalisation occurs, making it difficult to discern be-tween a patient with normal diastolic function and a patient with a relatively severe grade of diastolic dysfunction.
Our group has previously shown that a combined assessment of both early and late diastolic velocities by colour TDI is a strong prognostic marker of acute myo-cardial infarction, heart failure, and cardiovascular death in the general population [9]. This indicates that an as-sessment of both early and late diastole is important for a meaningful assessment of true LV diastolic function. Total diastolic longitudinal displacement (LD) calculated via the integration of the early (E) and atrial (A) velocity waves, obtained by colour TDI, is a potentially new measurement of diastolic function that avoids the major drawbacks associated with the current velocity based assessment, namely an independent measurement that
has a linear relationship with the degree of diastolic dysfunction, i.e. non-biphasic, and a measurement that takes the whole diastolic process into consideration, i.e. not just a snapshot of imaging.
The aims of this study are to investigate: 1) The poten-tial of colour TDI determined total diastolic LD in the determination of diastolic function in the healthy and dysfunctional heart, 2) The ability of total diastolic LD to predict adverse outcomes, 3) To assess reproducibility of total diastolic LD.
Methods Data source
The Department of Cardiology, Herlev and Gentofte Hospital, University of Copenhagen performs routine echocardiograms according to a standardised protocol and these echocardiograms are stored on a local server.
Study population
A total of 486 consecutive patients were retrieved from the echocardiogram database. To obtain a representation of structural heart disease (no cardiac abnormalities; severe systolic heart failure; LV hypertrophy; LV dilation; and mitral regurgitation), the echocardiograms were analysed in accordance with the following criteria:
Inclusion criteria:
– No cardiac abnormalities: Eyeball LVEF >50 % and
normal cardiac dimensions.
– Severe systolic heart failure: Eyeball LVEF <30 %.
– LV hypertrophy: LV mass/body surface area≥113 g/
m2for women and≥131 g/m2for men.
– LV dilation: LV internal dimension at end-diastole/
body surface area≥3.8 cm/m2for women and
≥3.7 cm/m2for men.
– Mitral regurgitation:≥grade 2.
Exclusion criteria:
– Overlapping diseases of the above mentioned, for
example, mitral regurgitation in a patient with LV hypertrophy. Exceptions: patients with a dilated LV, hypertrophic LV, or mitral regurgitation may have had a LVEF under 30 %.
– Incomplete examinations.
– Bundle branch block.
– Atrial fibrillation.
– Unsuitability for colour TDI, i.e. indistinguishable
E-and A-wave.
criteria for “LV dilation”; and 67 patients fulfilled criteria for “mitral regurgitation”. After application of exclusion criteria, the final study population consisted of 206 pa-tients, 49 of whom were classified as having normal cardiac dimensions and function. The 157 remaining patients all had heart anomalies that could potentially affect diastolic
LD such as severe systolic heart failure (n= 45), LV
hypertrophy (n= 49), LV dilation (n= 30), and mitral
regurgitation (n= 33). Diastolic function was assessed and participants were graded as having a normal relaxation
(n= 76), abnormal relaxation (n= 75), pseudonormal
relaxation (n= 44), or restrictive filling pattern (n= 11).
Echocardiographic analyses
All echocardiograms were obtained using Vivid E7 and Vivid 9 ultrasound systems (GE Healthcare, Horten Norway) and all images were stored digitally on a central server. All participants were examined with conventional two-dimensional echocardiography, m-mode, pulsed-wave TDI, colour TDI and two-dimensional strain imaging. All the echocardiographic analyses in the present study were performed de novo and offline (blinded to other clinical data) using Echopac BT11 software (GE Healthcare, Horten Norway).
Conventional echocardiography
LV end-diastolic dimensions (interventricular septum wall thickness (IVS), LV internal dimension (LVID), and LV posterior wall thickness (PWT)) and LA diameter were obtained from the parasternal long-axis view at the mitral valve leaflet tips. Pulsed wave Doppler was used to record mitral inflow between the tips of the mitral leaflets. LVEF was obtained using modified Simpson’s biplane method in the 4-chamber and 2-chamber view [10]. LA volume was estimated by the area-length method [10]. LV mass index was calculated as the anatomic mass (LV mass = 0.8x(1.04[(IVSd + LVIDd +
PWTd)3−LVIDd3]) + 0.6 g) [11], divided with body
surface area. All measurements were acquired from the parasternal approach and measured at the level of the mitral valve at end-diastole. Relative wall thickness was calculated as (2 × LV PWT)/(LVID) and the subgroup of patients with LV hypertrophy was sub-categorized with regards to concentric or eccentric hypertrophy in ac-cordance with current American Society of Echocardiog-raphy Committee recommendations [10]. Severity of
mitral regurgitation was determined according to
current guidelines [12]. All chamber quantifications are in accordance with the American Society of Echocardi-ography Committee recommendations [10].
Tissue Doppler Imaging (TDI)
Colour TDI loops were obtained in the apical 4-chamber view. Peak longitudinal systolic velocities (s’) as well as
early diastolic (e’) and late diastolic (a’) velocities were measured in the septal and lateral wall using a 5 mm circular sample volume placed in the left ventricular myocardial just proximal to the mitral annular level. Total average systolic and diastolic LD was determined by calculating the area under the curve, using tissue tracking software, of the systolic, early and late diastolic waves, respectively, and averaging septal and lateral findings (Fig. 1). Potential L-waves between the early and late diastolic waves were not included in the assess-ment of total average diastolic displaceassess-ment. Systolic displacement was measured as the maximal displace-ment between aortic valve opening and aortic valve closure and post-systolic contraction was not included in systolic displacement measurements.
Pulsed wave TDI tracings, used to measure peak myocardial velocities, were obtained with the range gate placed at the septal and lateral mitral annular segments in the 4-chamber view. The average of septal and lateral e’by pulsed wave TDI was used to calculate E/e’.
M-mode
Mitral annular plane systolic excursion (MAPSE) was determined in the septal and lateral walls in the apical four-chamber view in all participants. This was done by placing the M-mode cursor in the septal and lateral bor-ders in the mitral annular plane. In doing so, an image of either septal or lateral mitral annular displacement was obtained. MAPSE was measured from the lowest to the highest point of contraction, excluding post-systolic contractions, i.e. measurements were obtained between aortic valve opening and aortic valve closure.
Two-dimensional Strain Imaging (2DSI)
Using 2-dimensional speckle tracking derived strain imaging, the left ventricular myocardial wall was traced in the 4-chamber view with the basal septal and lateral segments starting at the mitral annular level. By the tracking of speckles from frame-to-frame, myocardial deformation was assessed. The average of regional measurements in a 6-segment model from the apical 4-chamber view was used as an estimate of longitudinal displacement (LD), longitudinal strain (LS) and longitu-dinal strain rate (LSR). Regional basal longitulongitu-dinal displacement, strain, and strain rate was calculated as the average of the basal septal and lateral segments in the apical 4-chamber view.
TDI and strain measurements are reported as absolute values.
Determination of degree of diastolic dysfunction
Prognostics study
Data on mortality (primary endpoint) was obtained using the unique personal identification number in the Central Office of Civil Registration and the Danish Na-tional Board of Health’s NaNa-tional Patient Registry.
Statistical analysis
All statistical analyses were done using SPSS version 20 (SPSS, Inc, Chicago, IL). In Table 1, continuous Gaussian distributed variables and proportions were compared using Student’s t-test and χ2-test, respectively. Pearsons correlation was used to determine any associations be-tween the degree of diastolic dysfunction and total average diastolic LD as well as between total average diastolic LD and individual parameters used in the assessment of diastolic and systolic function. Using logistic regressions, odds ratios for unadjusted and adjusted models were calculated to establish the association between peak vel-ocities and diastolic LD and the primary endpoint (death). Interactions with the subgroup type were tested for. Bland-Altman analysis was used to evaluate intraobserver and interobserver variability and was expressed as mean difference ± 1.96 standard deviation (SD) and as coeffi-cient of variation (CV) [13].P-values <0.05 in two-sided tests were considered statistically significant.
Results
Patient characteristics
Main characteristics of the study population are presented in Table 1. Parameters of advanced echocardiography are
presented in Table 2. Compared to controls, patients with structural heart disease had both reduced early and active diastolic function as assessed by various echocardio-graphic techniques such as TDI and speckle tracking. Of the 49 patients with LV hypertrophy, 32 (65 %) had con-centric hypertrophy; 17 (35 %) had eccon-centric hypertrophy.
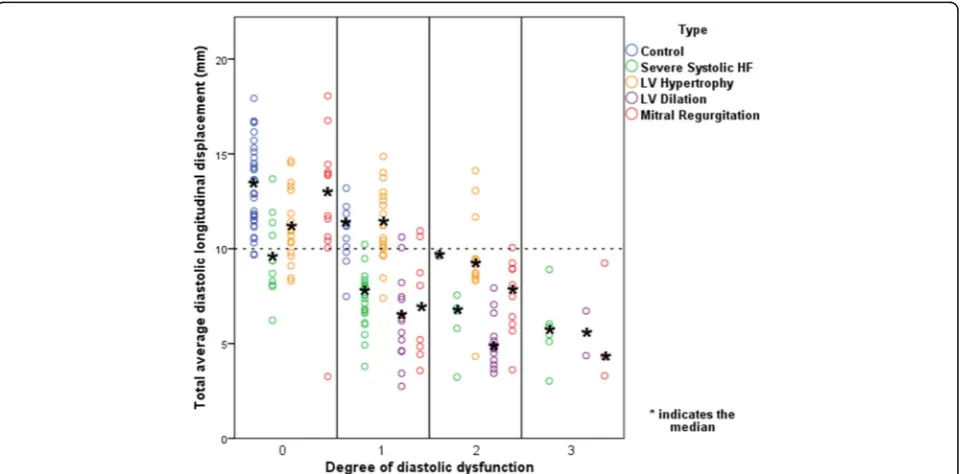
Total average diastolic longitudinal displacement and degree of diastolic dysfunction
A linear relationship, also after adjustment for age and gender, between total average diastolic LD and the degree of diastolic dysfunction was found (Fig. 2). This linear relationship is due to a fall in TT-e’in the mild stages of
diastolic dysfunction and TT-a’ which only starts to
diminish at more severe degrees of diastolic dysfunction (Additional file 1: Figure S1 and S2). This linear relation-ship indicates the value of total average diastolic LD as an indicator of LV diastolic function and a total average diastolic LD of 10 mm was found to be a consistent thresh-old for the general discrimination of patients with or without diastolic dysfunction. This threshold was chosen on the basis of findings in Fig. 3 where the vast majority of controls with normal diastolic function had a total average diastolic LD above 10 mm. Pearson correlation was calculated to be−0.61 with ap-value <0.001. Using linear regression, total average diastolic LD was estimated to fall by 2.4 mm for every increase in graded severity of diastolic dysfunction (β=−0.61,p-value<0.001). A similar relation-ship was found when investigating total average diastolic velocity (e’+ a’) and degree of diastolic function (Pearson
Fig. 1Image of colour tissue Doppler imaging with septal longitudinal displacement measurements depicted as area under the curve in early
correlation 0.63, p-value <0.001), although a cutoff of 12 cm/s is appropriate here (Additional file 1: Figure S3).
Total average diastolic longitudinal displacement in various heart conditions
Figure 3 illustrates findings of total average diastolic LD in various heart conditions in comparison to the degree of diastolic dysfunction. Median values of all participants classified as having normal diastolic function had a total average diastolic LD above 10 mm, except for patients with severe systolic heart failure. A closer examination of the patients with severe systolic heart failure with normal diastolic function as determined by current guidelines [2]
revealed that patients with a diastolic LD ≥10 mm had
reduced markers of systolic function (mean LS =−11.5 ± 7.1 %; mean LSR =−0.85 ± 0.2 s−1; and mean systolic LD by TDI (TT-s’) = 10.7 ± 1.5 mm). Systolic function of indi-viduals with severe systolic heart failure, normal diastolic function, and a diastolic LD <10 mm was also reduced, but to a greater degree (LS =−9.9 ± 5.7 %, LSR =−0.68 ± 0.32 s−1, TT-s’= 7.0 ± 1.7 mm).
Generally, median values of mean diastolic LD fell with increasing severity of diastolic dysfunction for all
subgroups except for the control group and patients with LV hypertrophy, who both had a preserved total
average diastolic LD ≥10 mm despite being categorised
as having an abnormal relaxation pattern. Median values of all participants classified as having either a pseudo-normal or restrictive filling pattern had a total average diastolic LD <10 mm. Table 3 shows the configuration of the E- and A-waves in controls and in patients with LV hypertrophy and an abnormal relaxation pattern. In both groups, peak velocities for the A-wave were greater than for the E-wave but displacement in the E- and A-waves for each was roughly equal, indicating that these two groups had low, broad E-waves and tall, narrow A-waves.
A further analysis of controls with grade 1 diastolic
dysfunction and a diastolic LD ≥10 mm revealed that
the sole reason for these individuals being classified as
having grade 1 diastolic dysfunction was a lateral e’
<10 cm/s or septal e’<8 cm/s and not enlarged atriums (LA volume <34 ml/m2).
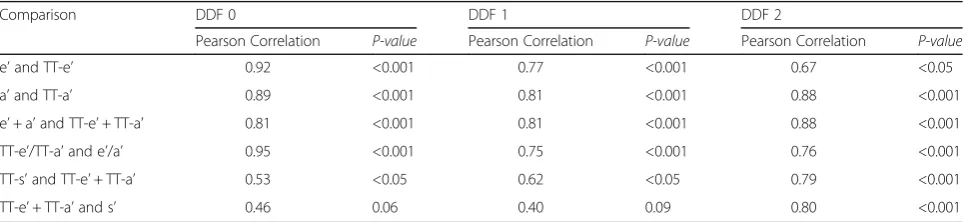
Table 4 shows the correlation of average diastolic and systolic LD measures with peak average diastolic and systolic velocities for subjects with LV hypertrophy and Table 1Characteristics of the patients studied
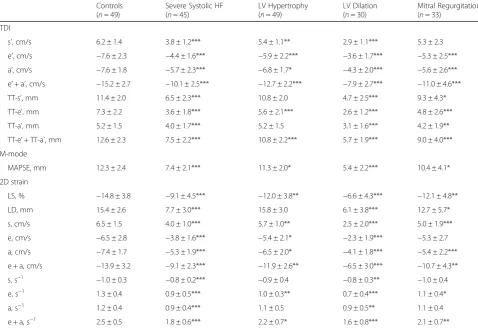
Controls (n= 49) Severe Systolic HF (n= 45) LV Hypertrophy (n= 49) LV Dilation (n= 30) Mitral Regurgitation (n= 33)
Age, y 58 ± 15 65 ± 15* 69 ± 15*** 76 ± 9*** 71 ± 11***
Male sex, % (n) 43 (21) 93 (42) 47 (23) 57 (17) 55 (18)
Height, cm 173 ± 9 177 ± 9* 171 ± 10 167 ± 7** 171 ± 9
Weight, kg 76 ± 16 82 ± 15 73 ± 14 65 ± 14** 72 ± 15
LVIDd, cm 4.7 ± 0.6 5.6 ± 0.7*** 5.2 ± 0.7** 6.8 ± 0.8*** 5.0 ± 0.9
BSA, m2 1.9 ± 0.2 2.0 ± 0.2* 1.8 ± 0.2 1.7 ± 0.2*** 1.8 ± 0.2
LVIDd/BSA, cm/m2 2.5 ± 0.3 2.9 ± 0.4*** 2.8 ± 0.4*** 4.0 ± 0.2*** 2.7 ± 0.5*
LVEF, % 64 ± 7 30 ± 9*** 60 ± 7* 25 ± 12*** 53 ± 16***
IVS, cm 0.9 ± 0.2 0.9 ± 0.2 1.2 ± 0.2*** 1.0 ± 0.2 1.0 ± 0.3
LVPWd, cm 0.9 ± 0.2 0.9 ± 0.2 1.2 ± 0.2*** 1.0 ± 0.1 1.0 ± 0.3
LVM/BSA, g/m2 70 ± 16 102 ± 19*** 130 ± 23*** 171 ± 42*** 103 ± 37**
DDF 0, % (n) 74 (36) 24 (11) 35 (17) 0 (0) 36 (12)
DDF 1, % (n) 22 (11) 51 (23) 39 (19) 47 (14) 24 (8)
DDF 2, % (n) 4 (2) 11 (5) 27 (13) 47 (14) 30 (10)
DDF 3, % (n) 0 (0) 13 (6) 0 (0) 7 (2) 9 (3)
E/A 1.2 ± 0.5 1.2 ± 0.8 1.1 ± 0.5 1.4 ± 1.0 1.5 ± 0.6**
DT, ms 221 ± 57 191 ± 98 236 ± 59 218 ± 66 223 ± 93
LAV, ml/m2
24.5 ± 9.0 33.8 ± 10.5*** 39.6 ± 13.7*** 45.5 ± 18.2*** 46.5 ± 16.5***
E/e’ 8.6 ± 3.6 12.3 ± 6.4** 12.4 ± 5.4*** 17.0 ± 7.9*** 19.3 ± 14.9***
Known IHD, % (n) 18 (9) 69 (31) 4 (2) 17 (5) 21 (7)
HFheart failure,LVLeft ventricular,LVIDdLV internal dimension in diastole,BSAbody surface area,LVEFLV ejection fraction,IVSinterventricular septum,LVPWdLV posterior wall in diastole,LVMLV mass,DDFdegree of diastolic dysfunction,E/Aearly inflow velocity/atrial inflow velocity,DTdeceleration time,LAVleft atrial volume,E/e’early inflow velocity/early diastolic tissue velocity,IHDischemic heart disease
varying degrees of diastolic dysfunction. A moderate correlation was found between total average systolic LD and total average diastolic LD as well as between peak longitudinal systolic velocity by TDI (s’) and total aver-age diastolic LD, especially in patients with normal dia-stolic function and in patients with abnormal relaxation. An examination of parameters of systolic function in patients with LV hypertrophy indicates preserved systolic function (LVEF = 60 ± 7 %, LSR =−0.92 ± 0.35 s−1, LS = 12.0 ± 3.8, TT-s’= 10.8 ± 2.0 mm, s’= 5.38 ± 1.14 cm/s).
Left ventricular ejection fraction and total average diastolic longitudinal displacement
Figure 4 illustrates the relationship of total average diastolic LD with LVEF. Participants are clustered into two main groups: a group with a total average diastolic LD <10 mm and a LVEF <50 % and a group with a total average diastolic LD >10 mm and a LVEF >50 %, and
two smaller groups: a group with total average diastolic LD <10 mm and an LVEF >50 % and a group with a total average diastolic LD >10 mm and an LVEF <50 %.
By examining the colour combinations of subjects in Fig. 4, it can be seen that the vast majority of subjects with no diastolic dysfunction have a LVEF >50 % and a diastolic LD >10 mm while the vast majority of subjects with grade 3 diastolic dysfunction have a LVEF <50 % and a diastolic LD <10 mm.
Regarding subjects with a LVEF >50 % and a diastolic LD <10 mm, it can be seen that almost all subjects have some degree of diastolic dysfunction. A comparison of longitudinal systolic function of these subjects, i.e. patients with LVEF >50 % and diastolic LD <10 mm (n = 32), compared to subjects with LVEF >50 % and diastolic LD >10 mm (n = 88) revealed that systolic function was reduced in this group: LS =−12.3 ± 4.1 %, LSR =−0.86 ± 0.33 s−1, TT-s’= 9.2 ± 1.8 mm and s’= 4.8 ± 1.0 cm/s
Table 2Advanced echocardiographic parameters within subgroups
Controls (n= 49)
Severe Systolic HF (n= 45)
LV Hypertrophy (n= 49)
LV Dilation (n= 30)
Mitral Regurgitation (n= 33)
TDI
s’, cm/s 6.2 ± 1.4 3.8 ± 1.2*** 5.4 ± 1.1** 2.9 ± 1.1*** 5.3 ± 2.3
e’, cm/s −7.6 ± 2.3 −4.4 ± 1.6*** −5.9 ± 2.2*** −3.6 ± 1.7*** −5.3 ± 2.5***
a’, cm/s −7.6 ± 1.8 −5.7 ± 2.3*** −6.8 ± 1.7* −4.3 ± 2.0*** −5.6 ± 2.6***
e’+ a’, cm/s −15.2 ± 2.7 −10.1 ± 2.5*** −12.7 ± 2.2*** −7.9 ± 2.7*** −11.0 ± 4.6***
TT-s’, mm 11.4 ± 2.0 6.5 ± 2.3*** 10.8 ± 2.0 4.7 ± 2.5*** 9.3 ± 4.3*
TT-e’, mm 7.3 ± 2.2 3.6 ± 1.8*** 5.6 ± 2.1*** 2.6 ± 1.2*** 4.8 ± 2.6***
TT-a’, mm 5.2 ± 1.5 4.0 ± 1.7*** 5.2 ± 1.5 3.1 ± 1.6*** 4.2 ± 1.9**
TT-e’+ TT-a’, mm 12.6 ± 2.3 7.5 ± 2.2*** 10.8 ± 2.2*** 5.7 ± 1.9*** 9.0 ± 4.0***
M-mode
MAPSE, mm 12.3 ± 2.4 7.4 ± 2.1*** 11.3 ± 2.0* 5.4 ± 2.2*** 10.4 ± 4.1*
2D strain
LS, % −14.8 ± 3.8 −9.1 ± 4.5*** −12.0 ± 3.8** −6.6 ± 4.3*** −12.1 ± 4.8**
LD, mm 15.4 ± 2.6 7.7 ± 3.0*** 15.8 ± 3.0 6.1 ± 3.8*** 12.7 ± 5.7*
s, cm/s 6.5 ± 1.5 4.0 ± 1.0*** 5.7 ± 1.0** 2.5 ± 2.0*** 5.0 ± 1.9***
e, cm/s −6.5 ± 2.8 −3.8 ± 1.6*** −5.4 ± 2.1* −2.3 ± 1.9*** −5.3 ± 2.7
a, cm/s −7.4 ± 1.7 −5.3 ± 1.9*** −6.5 ± 2.0* −4.1 ± 1.8*** −5.4 ± 2.2***
e + a, cm/s −13.9 ± 3.2 −9.1 ± 2.3*** −11.9 ± 2.6** −6.5 ± 3.0*** −10.7 ± 4.3**
s, s−1 −1.0 ± 0.3 −0.8 ± 0.2*** −0.9 ± 0.4 −0.8 ± 0.3** −1.0 ± 0.4
e, s−1 1.3 ± 0.4 0.9 ± 0.5*** 1.0 ± 0.3** 0.7 ± 0.4*** 1.1 ± 0.4*
a, s−1 1.2 ± 0.4 0.9 ± 0.4*** 1.1 ± 0.5 0.9 ± 0.5** 1.1 ± 0.4
e + a, s−1 2.5 ± 0.5 1.8 ± 0.6*** 2.2 ± 0.7* 1.6 ± 0.8*** 2.1 ± 0.7**
TDItissue Doppler Imaging,s’systolic tissue velocity by TDI measured at the mitral annulus,e’early diastolic tissue velocity by TDI measured at the mitral annulus, a’late diastolic tissue velocity by TDI measured at the mitral annulus,TT-s’systolic displacement measured at the mitral annulus,TT-e’early diastolic displacement measured at the mitral annulus,TT-a’late diastolic displacement measured at the mitral annulus,MAPSEM-mode derived mitral annular plane systolic excursion, LSlongitudinal strain by 2D strain imaging,LDlongitudinal displacement by 2D strain imaging,ssystolic tissue velocity/strain rate by 2D strain imaging measured at the basal septal and lateral segments,eearly diastolic tissue velocity/strain rate by 2D strain imaging measured at the basal septal and lateral segments,alate diastolic tissue velocity/strain rate by 2D strain imaging measured at the basal septal and lateral segments
compared to LS =−13.9 ± 3.9 %, LSR =−1.05 ± 0.32 s−1, TT-s’= 11.9 ± 2.2 mm and s’= 6.3 ± 1.4 cm/s.
An examination of systolic function of the 4 individ-uals with a LVEF <50 % and a diastolic LD >10 mm revealed a LS of −11.5 ± 7.1 %, LSR =−0.78 ± 0.17 s−1, TT-s’= 10.8 ± 1.5 mm and s’= 5.3 ± 1.2 cm/s. An analysis of the comorbidities of these patients revealed that they all suffered from ischemic heart disease.
Correlations
Pearsons correlation was used to determine the associ-ation of average diastolic LD with a variety of other echocardiographic parameters (Table 5). With regards to the entire population, strong associations were found when comparing LD in early diastole (TT-e’) with early mitral annular velocity (e’), LD in late diastole (TT-a’) with late mitral annular velocity (a’), total average
Fig. 2Total average diastolic longitudinal displacement and the degree of diastolic dysfunction.HF, heart failure
diastolic LD (TT-e’+ TT-a’) with e’+ a’, and the ratio of diastolic LD between the early and atrial wave (TT-e’/ TT-a’) with peak velocities for the early and atrial wave (e’/a’). When considering systolic displacement mea-sured by TDI, M-mode, and 2D strain imaging and TDI derived total average diastolic LD, strong correlations were found. Weaker correlations were found when comparing total average diastolic LD to other systolic measures, such as LVEF, LS and LSR. A comparison of associations between groups (Table 5) reveals that the strongest associations were seen when comparing dia-stolic LD measurements with diadia-stolic velocity measure-ments. A weaker association was seen when comparing average diastolic LD with systolic LD and velocity, and was weakest for patients with LV hypertrophy. The biggest fluctuations and weakest correlations between groups were seen when determining the association of average diastolic LD with markers of systolic func-tion such as LVEF, LS and LSR.
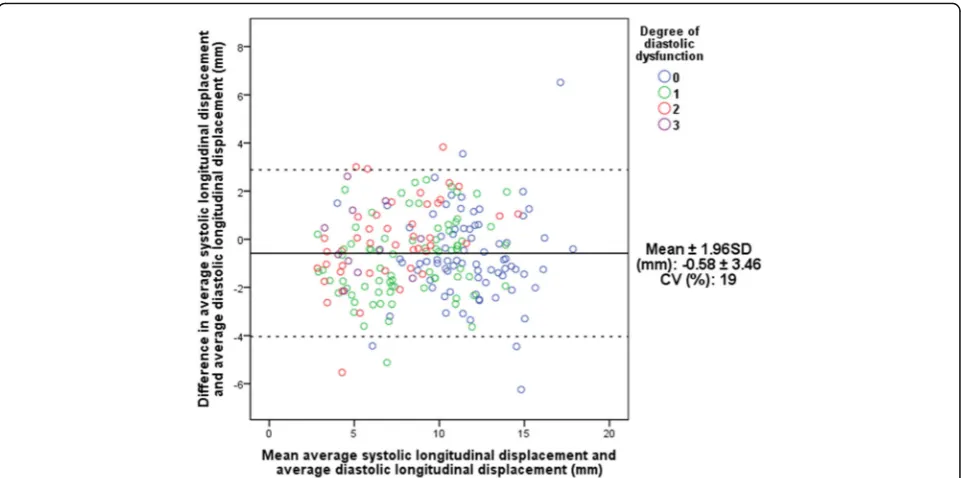
Agreement with echocardiographic parameters
Figure 5 depicts the mean differences (bias) of total average systolic and diastolic measurements plotted against the mean of the two average LD measurements,
(Bland-Altman plot). The mean difference was
calcu-lated to −0.58 mm indicating that average systolic LD
underestimates total average diastolic LD. The limits of agreement were calculated to ±3.46 mm and a coeffi-cient of variation (CV) of 19 % was found.
Total average diastolic longitudinal displacement as a predictor of adverse cardiac outcomes
There were 33 events (death) during 2.6 ± 1.2 years follow-up. Odds ratios were calculated to determine the predictive capabilities of total diastolic LD in compari-son to diastolic colour TDI velocities with regards to all-cause mortality: per unit decrease, risk of death
increased in a similar pattern for e’+ a’ and TT-e’+
TT-a’ (Table 6). Following adjustment for covariates
(first multivariate analysis adjusted for age and gender and second multivariate analysis adjusted for age, gender, LVEF, LV internal dimension in diastole/body surface area, LV mass index, and LS), e’+ a’and TT-e’+
TT-a’ remained significant predictors of death. LA
volume was also shown to be a significant predictor of death, also after adjustment in multivariate analyses. The calculation of area under the curve in ROC curves (Fig. 6) showed similar results.
Reproducibility
Intraobserver variability for septal and lateral LD measurements of the E-wave and A-wave was relatively low, as is shown by the mean difference being close to zero (Additional file 1: Figure S4). Limits of agreement are, however, fairly wide and the largest variability, as indicated by CV, was seen in lateral A-wave LD measurements.
Interobserver variability findings were found to be similar to intraobserver variability. All mean differences were close to zero. The greatest variability was seen in E-wave LD measurements in comparison to A-wave LD Table 3The configuration of the early and atrial waves in
controls and in subjects with left ventricular hypertrophy and an abnormal relaxation pattern
Configuration Controls Mean ± SD
LV hypertrophy Mean ± SD
e’(cm/s) 5.44 ± 1.46 5.11 ± 1.56
a’(cm/s) 7.27 ± 2.41 7.86 ± 1.22
TT-e’(mm) 5.44 ± 1.20 5.02 ± 1.51
TT-a’(mm) 5.31 ± 1.71 6.24 ± 0.91
e’early diastolic tissue velocity by TDI measured at the mitral annulus,a’late diastolic tissue velocity by TDI measured at the mitral annulus,TT-e’early diastolic displacement measured at the mitral annulus,TT-a’late diastolic displacement measured at the mitral annulus
Table 4Correlations of total average diastolic longitudinal displacement with peak average diastolic velocities and average systolic longitudinal displacement for subjects with LV hypertrophy and no diastolic dysfunction and a first and second degree of diastolic dysfunction
Comparison DDF 0 DDF 1 DDF 2
Pearson Correlation P-value Pearson Correlation P-value Pearson Correlation P-value
e’and TT-e’ 0.92 <0.001 0.77 <0.001 0.67 <0.05
a’and TT-a’ 0.89 <0.001 0.81 <0.001 0.88 <0.001
e’+ a’and TT-e’+ TT-a’ 0.81 <0.001 0.81 <0.001 0.88 <0.001
TT-e’/TT-a’and e’/a’ 0.95 <0.001 0.75 <0.001 0.76 <0.001
TT-s’and TT-e’+ TT-a’ 0.53 <0.05 0.62 <0.05 0.79 <0.001
TT-e’+ TT-a’and s’ 0.46 0.06 0.40 0.09 0.80 <0.001
measurements, as is indicated by the larger limits of agreement and larger CV.
Discussion
This is the first study, to our knowledge, to investigate total average diastolic LD determined by colour TDI as a potential new parameter for the determination of LV
diastolic dysfunction. Our findings on the predictive capabilities and reproducibility of this parameter are im-portant with regards to its utilisation in clinical practice.
Tissue Doppler Imaging
TDI is a useful echocardiographic technique to evaluate global and regional systolic and diastolic function in a
Fig. 4Total average diastolic longitudinal displacement as a function of left ventricular ejection fraction
Table 5Correlations of average diastolic longitudinal displacement with peak average diastolic velocities, average systolic longitudinal displacement and other measures of systolic function for all subjects and between subgroups
Comparison All subjects Control Severe systolic HF LV hypertrophy LV dilation Mitral regurgitation
r p-value r p-value r p-value r p-value r p-value r p-value
e’and TT-e’ 0.93 <0.001 0.90 <0.001 0.89 <0.001 0.88 <0.001 0.91 <0.001 0.95 <0.001
a’and TT-a’ 0.92 <0.001 0.87 <0.001 0.94 <0.001 0.89 <0.001 0.90 <0.001 0.92 <0.001
e’+ a’and TT-e’+ TT-a’ 0.94 <0.001 0.84 <0.001 0.89 <0.001 0.85 <0.001 0.88 <0.001 0.96 <0.001
TT-e’/TT-a’and e’/a’ 0.90 <0.001 0.92 <0.001 0.87 <0.001 0.94 <0.001 0.94 <0.001 0.86 <0.001
TT-e’/TT-a’and E/A 0.67 <0.001 0.83 <0.001 0.79 <0.001 0.87 <0.001 0.52 <0.001 0.62 <0.001
TT-s’and TT-e’+ TT-a’ 0.88 <0.001 0.82 <0.001 0.73 <0.001 0.66 <0.001 0.76 <0.001 0.88 <0.001
s’and TT-e’+ TT-a’ 0.85 <0.001 0.73 <0.001 0.70 <0.001 0.56 <0.001 0.78 <0.001 0.89 <0.001
e’+ a’and s’ 0.82 <0.001 0.74 <0.001 0.74 <0.001 0.43 <0.001 0.75 <0.001 0.87 <0.001
LVEF and TT-e’+ TT-a’ 0.71 <0.001 −0.03 0.83 0.52 <0.001 0.01 0.94 0.81 <0.001 0.58 <0.001
LS and TT-e’+ TT-a’ −0.60 <0.001 −0.06 0.67 −0.50 <0.001 −0.18 0.21 −0.57 <0.001 −0.64 <0.001
LSR and TT-e’+ TT-a’ −0.41 <0.001 0.05 0.73 −0.29 0.05 −0.31 <0.05 −0.40 <0.05 −0.52 <0.001
LD and TT-e’+ TT-a’ 0.76 <0.001 0.52 <0.001 0.31 <0.05 0.33 <0.05 0.75 <0.001 0.78 <0.001
MAPSE and TT-e’+ TT-a’ 0.82 <0.001 0.63 <0.001 0.54 <0.001 0.37 <0.01 0.83 <0.001 0.84 <0.001
variety of different cardiac conditions [14]. Even though it is reproducible, widespread, and allows for extensive off-line analysis [15], it is underutilised in clinical prac-tice. Limitations of TDI include angle dependency with possible underestimations of tissue velocities if the angle of interrogation exceeds 20° [14] and overestimations when using excessive gain [16]. Furthermore, difficulties in estimating diastolic tissue velocities and displacement arise in patients with non-discernible E and A waves, i.e. patients with atrial fibrillation.
Total average diastolic longitudinal displacement and degree of diastolic dysfunction
One of the major drawbacks of current diastolic parame-ters is that there often is a biphasic element involved, as is seen with E/A and DT. This results in difficulty in dis-cerning between a patient with normal diastolic function and a patient with a relatively severe grade of diastolic dysfunction. As depicted in Fig. 2, total average diastolic LD has a linear relationship with the degree of diastolic dysfunction, thereby eliminating this risk of misinter-pretation. This linear relationship is due to a fall in
TT-e’ in the mild stages of diastolic dysfunction and
TT-a’ which only starts to diminish at more severe
degrees of diastolic dysfunction (Additional file 1: Figure S1 and S2). A total average diastolic LD of 10 mm was found to be a consistent threshold for the general discrimination of patients with or without diastolic dysfunction and this can potentially be used in a clinical situation as an independent marker for the general
evaluation of a patient’s overall diastolic function.
Furthermore, total average diastolic LD considers the shape of the E- and A-wave and not just peak velocity values. Theoretically, this must provide a more reliable measurement in comparison to single snapshot based parameters, see below.
Total average diastolic longitudinal displacement in various heart conditions
Total average diastolic LD is a potentially superior par-ameter for the true evaluation of diastolic dysfunction in comparison to current velocity based echocardiographic parameters: total average diastolic LD looks at the entire diastolic process as it takes the shape of the E and A diastolic waves, and not just peak values, into consider-ation. This is illustrated in Fig. 3 where controls and patients with LV hypertrophy have a preserved total average diastolic dysfunction despite being classified as having abnormal relaxation. A compensatory mechanism that is not measured by current diastolic evaluation methods could, potentially, be at work. An analysis of the configuration of the E- and A-waves in controls and in patients with LV hypertrophy and an abnormal relax-ation pattern (Table 3) reveals that preserved diastolic LD is not due to a compensatory increase in overall A-wave size, as one might anticipate, but is due to E-waves being low and broad in shape and A-E-waves being high and narrow in shape, a situation that is not taken into consideration when just looking at peak velocities.
Fig. 5Interchangeability of average systolic displacement and total average diastolic longitudinal displacement.CV, coefficient of variation; SD,
An analysis of the various heart conditions of the patients included in this study reveals that total average diastolic LD is a potential indicator of diastolic dysfunc-tion irrespective of the primary heart condidysfunc-tion, as discussed below:
With regards to the control group, as expected, the majority of patients are categorised as having either normal diastolic function or grade 1 diastolic dysfunc-tion. An unexpected finding, however, is that the major-ity of control patients with grade 1 diastolic dysfunction have a diastolic LD >10 mm. On further analysis, these individuals did not have enlarged left atriums and the sole reason for these individuals being classified as having grade 1 diastolic dysfunction was a LA volume <34 ml/m2. The majority of these patients also had an E/A ratio <0.8.
With regard to patients with severe systolic heart failure, it is questionable how a patient with severely reduced systolic function (eyeball LVEF <30 %) can have
a preserved diastolic function as, with regards to conventional understanding, a reduced systolic function should result in a reduced diastolic function and vice versa. A closer inspection of these patients revealed that the individuals with a diastolic LD >10 mm had reduced markers of systolic function, though greater than indi-viduals with a diastolic LD <10 mm.
With regards to patients with LV hypertrophy, a pre-served total average diastolic LD is seen despite patients being categorised as having an abnormal relaxation pattern, indicating that total average diastolic LD may not be optimal for the discernment of diastolic dysfunc-tion in this patient group. As described above, an analysis of the E- and A-waves of these patients (Table 3) reveals broad E-waves and tall, narrow A-waves. For subjects with LV hypertrophy and grade 1 and 2 diastolic dysfunction (Table 4), a moderate correlation was found between total average systolic LD and total average
diastolic LD as well as between s’ and total average
Table 6Unadjusted and adjusted univariable and multivariable odds ratios
Unadjusted model: Multivariable model adjusted for age and gender:
Multivariable model adjusted for age, gender, LVEF, LVIDd/BSA, LVMI, LS:
Odds ratio (95 % CI) P-value Odds ratio (95 % CI) P-value Odds ratio (95 % CI) P-value
TT-e’+ TT-a’per 1 mm decrease 1.47 (1.26–1.71) <0.001 1.33 (1.13–1.57) <0.01 1.35 (1.04–1.74) <0.05
TT-e’per 1 mm decrease 1.63 (1.30–2.04) <0.001 1.39 (1.07–1.80) <0.05 1.18 (0.82–1.69) 0.374
TT-a’per 1 mm decreasea 1.59 (1.26–2.03) <0.001 1.51 (1.16–1.95) <0.01 1.38 (1.01–1.88) <0.05
TT-s’per 1 mm decrease 1.31 (1.16–1.48) <0.001 1.18 (1.03–1.36) <0.05 1.05 (0.83–1.33) 0.703
-e’per 1 cm/s decrease 1.70 (1.34–2.15) <0.001 1.41 (1.07–1.85) <0.05 1.24 (0.90–1.72) 0.192
-a’per 1 cm/s decreasea 1.45 (1.20–1.73) <0.001 1.35 (1.10–1.65) <0.01 1.25 (0.99–1.58) 0.066
-e’+ a’per 1 cm/s decrease 1.42 (1.24–1.62) <0.001 1.30 (1.12–1.51) <0.01 1.27 (1.04–1.55) <0.05
Per degree of DDF:
• No DDF - - -
-• DDF 1 2.26 (0.80–6.38) 0.124 0.76 (0.22–2.58) 0.658 0.39 (0.10–1.50) 0.171
• DDF 2 5.44 (1.91–15.52) <0.01 1.59 (0.48–5.26) 0.451 0.80 (0.21–3.02) 0.744
• DDF 3 1.17 (0.13–10.72) 0.892 0.59 (0.06–5.94) 0.652 0.21 (0.02–2.51) 0.216 E/e’per 1 unit decrease 1.09 (1.04–1.14) <0.001 1.05 (1.01–1.09) <0.05 1.04 (1.00–1.09) 0.058
E/A per 1 unit decrease 1.04 (0.61–1.79) 0.881 1.43 (0.78–2.60) 0.248 1.28 (0.69–2.37) 0.432
DT per 1 ms decrease 1.00 (1.00–1.01) 0.921 1.00 (0.99–1.00) 0.535 1.00 (1.00–1.01) 0.997
LAD per 1 cm decrease 1.56 (0.53–4.63) 0.420 1.85 (0.42–8.19) 0.420 -
-LA volume per 1 ml/m2decrease 1.05 (1.02–1.08) <0.001 1.04 (1.01–1.07) <0.05 1.05 (1.01–1.09) <0.05
Per change in patient subgroup:
• Control - - -
-• Cardiac dysfunction 9.08 (1.07–77.08) <0.05 3.75 (0.39–36.30) 0.253 1.01 (0.07–15.01) 0.993
• LV hypertrophy 5.46 (0.61–48.53) 0.128 1.89 (0.19–18.79) 0.586 1.06 (0.09–12.34) 0.966
• LV dilation 27.79 (3.35–230.35) <0.01 7.49 (0.83–67.96) 0.073 0.75 (0.03–18.18) 0.859
• Mitral regurgitation 18 (2.15–150.46) <0.01 7.19 (0.79–65.87) 0.081 3.88 (0.39–38.60) 0.248 DDFDegree of diastolic dysfunction,e’early mitral annular diastolic velocity,TT-e’displacement in early diastole,a’late mitral annular diastolic velocity,TT-a’ displacement in late diastole,TT-e’+ TT-a’total average diastolic displacement,s’mitral annular systolic velocity,TT-s’total average systolic displacement,DT deceleration time,LADleft atrial diameter,LAleft atrial
a
diastolic LD indicating a potentially preserved systolic function and reduced diastolic function, as would be ex-pected in patients with LV hypertrophy. An examination of parameters of systolic function indicates slightly reduced systolic function.
With regards to patients with LV dilation and mitral regurgitation, the expected pattern of falling diastolic LD with increasing grades of diastolic dysfunction is seen. No patients with LV dilation have normal diastolic func-tion, as is to be expected.
Systolic and diastolic function
LV systolic dysfunction is commonly differentiated from LV diastolic dysfunction by the presence of a reduced LVEF [17, 18]. This differentiation is potentially erroneous as abnormalities of contractile function and diastolic function have been shown to coexist, and diastolic dys-function often has its genesis in systole [19]. The idea of isolated diastolic function can, therefore, be questioned and it can be suggested that heart failure should be viewed as an individual disease where systolic and diastolic dys-function are the extremes on a spectrum of different phe-notypes of the same disease [19, 20]. In this study, systolic and diastolic function are shown to go hand-in-hand, i.e. a patient with poor systolic function is also shown to have poor diastolic function. This relationship is clearly depicted when using total average diastolic LD as a marker of diastolic dysfunction (Fig. 4), indicating that LD is a potentially valid substitute for present velocity-based determinations of diastolic dysfunction.
Likewise, it is relevant to test the correlation between average systolic LD and total average diastolic LD as, intuitively, heart LD in systole must equal heart LD in diastole if the heart is to remain the same overall size. Good associations were found with regards to total average diastolic LD and measurements of systolic heart function such as peak systolic velocity (s’), systolic LD
(TT-s’), M-mode derived MAPSE and 2D strain derived
LD (Table 5). This finding, as well as the relationship seen between LVEF and total average diastolic dysfunc-tion in Fig. 4, also challenges the concept of isolated diastolic dysfunction. It would be correct to classify patients with reduced diastolic function and preserved LVEF as patients with heart failure with preserved ejection fraction (HFPEF) but incorrect to assume that these patients have isolated diastolic dysfunction as we found that systolic function, determined by longitudinal
deformation measurements such as s’ and LS, was
reduced in these patients despite a preserved LVEF. This indicates that diastolic LD may additionally be a marker of systolic function that is more sensitive than LVEF.
Despite acceptable correlations between total average diastolic LD and measurements of systolic heart function (Table 5), it can be seen that echocardiographic systolic measurements are not identical to diastolic measure-ments. This may be partially due to the presence of L-waves which were not included in the assessment of diastolic LD as only E- and A-waves were evaluated. L-waves are often observed in mid-diastole and indicate continued pulmonary vein flow through the left atrium
Fig. 6Roc curves illustrating a parameter’s predictive value of death.e’, early diastolic tissue velocity by TDI measured at the mitral annulus; a’, late
into the left ventricle after the E-wave [21]. Furthermore, the discrepancy between total average diastolic LD and systolic heart function may indicate that the relationship between early and late diastole may reveal aspects of heart pump function that cannot be revealed by an assessment of systolic function alone.
Interchangeability and reproducibility of displacement measurements
Average systolic LD was found to slightly underestimate total average diastolic LD by approximately 0.6 mm (Fig. 5). Even though limits of agreement are wide (±3.46 mm), a CV of 19 % suggests that these two parameters are potentially interchangeable.
Furthermore, as is shown in Table 5, the correlation between average diastolic peak velocity measurements and total average diastolic LD was very good and a similar relationship of e’+ a’with the degree of diastolic
dysfunction compared to TT-e’+ TT-a’ and the degree
of diastolic function was found, albeit a cut-off of 12 cm/s is more appropriate here instead of 10 mm (Additional file 1: Figure S3). Furthermore, area under
the curve illustrating the predictive value of TT-e’+
TT-a’ and e’+ a’ was very similar. As total average
diastolic LD is a little tricky and time consuming to measure, average diastolic peak velocity measurements seems to be a valid substitute.
Reproducibility of displacement measurements of E-and A-waves was reasonable, taking into consideration that this is the first time that diastolic LD by colour TDI has been validated, and was fairly equal in the determin-ation of both intra and interobserver variability. Limits of agreement were fairly wide and the largest variability was seen in the determination of displacement of the lateral A-wave.
Prediction of adverse cardiac outcomes
An analysis of death as an endpoint, using odds ratios and ROC curve analyses, showed that risk of death per
unit decrease in both average diastolic LD (TT-e’+
TT-a’) and average peak diastolic velocities (e’+ a’) was similar, even after adjustment for covariates.
Clinical implications
Total average diastolic LD has the potential to revolu-tionise the way in which we look at diastolic function. It looks at the entire diastolic process, therefore, making it a promising and sensitive marker of diastolic function. Furthermore, it has the potential to be used in a clinical setting as a quick and effective determinant of patients with and without diastolic dysfunction.
Study limitations
A variety of limitations in this study have to be addressed:
Firstly, the validity of total average diastolic LD was measured against determinants from current guidelines for the non-invasive determination of diastolic dysfunc-tion as the golden standard. Future research with the use of invasive diastolic measurements is, therefore, required.
Secondly, only the septal and lateral wall in the 4-chamber view was assessed. A truer (but also much more time-consuming) depiction of global longitudinal diastolic performance would be obtained if the anterior, inferior, posterior and anteroseptal mitral annular sites were included.
Thirdly, all-cause mortality was the only primary endpoint evaluated in this study. An assessment of more endpoints, including cardiovascular death, may show the prognostic value of total average diastolic LD to be even higher.
Conclusions
Total average diastolic LD is a promising alternative to current algorithm-based evaluations. It has a linear rela-tionship with the degree of diastolic dysfunction assessed by current guidelines and a 10 mm threshold in total average diastolic LD can potentially be used independ-ently to evaluate patients with and without diastolic dysfunction in a variety of different heart conditions with reasonable intra and interobserver reproducibility.
Additional file
Additional file 1: Figure S1.Mean early diastolic longitudinal
diaplacement velocity and degree of diastolic dysfunction.Figure S2.
Mean atrial diastolic longitudinal diaplacement velocity and degree of diastolic dysfunction.Figure S3.Total average diastolic velocity and degree of diastolic dysfunction. Dotted line at 12 cm/s represents cutoff to discern normal diastolic function from diastolic dysfunction.Figure S4.Reproducibility of early and late diastolic displacement
measurements. (DOCX 313 kb)
Abbreviations
2DSI:Two-dimensional strain imaging; A: Atrial mitral inflow velocity; a’: Atrial mitral annular diastolic velocity; A-wave: Atrial mitral annular diastolic velocity wave; CV: Coefficient of variation; DT: Deceleration time; E: Early mitral inflow velocity; e’: Early mitral annular diastolic velocity; E-wave: Early mitral annular diastolic velocity wave; LA: Left atrial; LD: Longitudinal displacement; LS: Longitudinal strain; LSR: Longitudinal strain rate; LV: Left ventricle; LVEF: Left ventricular ejection fraction; TDI: Tissue Doppler imaging; TT-a’: Mean atrial diastolic longitudinal displacement; TT-e’: Mean early diastolic longitudinal displacement; TT-e’+ TT-a’: Total average diastolic longitudinal displacement; TT-s’: Mean systolic longitudinal displacement
Funding
The Division of Clinical Cardiovascular Research, Department of Cardiology, Herlev and Gentofte Hospital.
Authors’contributions
part of the work are appropriately investigated and resolved. RM and JSJ made substantial contributions to the conception, acquisition, and interpretation of data, revising it critically for important intellectual content, performed final approval of the version to be published, and agree to be accountable for all aspects of the work in ensuring that questions related to the accuracy or integrity of any part of the work are appropriately investigated and resolved. TBS, JS and PS made substantial contributions to acquisition, and interpretation of data, revising it critically for important intellectual content, performed final approval of the version to be published, and agree to be accountable for all aspects of the work in ensuring that questions related to the accuracy or integrity of any part of the work are appropriately investigated and resolved. All authors read and approved the final manuscript.
Competing interests
All authors report no support from any organisation for the submitted work; no financial relationships with any organisations that might have an interest in the submitted work; no other relationships or activities that could appear to have influenced the submitted work.
Ethics approval and consent to participate
This study was approved by The Danish Data Protection Agency and complies with the 2nd Declaration of Helsinki.
Author details
1
Herlev and Gentofte Hospital, Department of Cardiology, Faculty of Health Sciences, University of Copenhagen, Copenhagen, Denmark.2Department of Cardiology, Centre for Cardiovascular Research, Aalborg University Hospital, Aalborg, Denmark.3Rigshospitalet, Department of Cardiology, Faculty of Health Sciences, University of Copenhagen, Copenhagen, Denmark.
Received: 19 August 2016 Accepted: 9 September 2016
References
1. Tschöpe C, Paulus WJ. Is echocardiographic evaluation of diastolic function useful in determining clinical care? Doppler echocardiography yields dubious estimates of left ventricular diastolic pressures. Circulation. 2009;120(9):810–20. discussion 820.
2. Nagueh SF, Smiseth OA, Appleton CP, Byrd BF, Dokainish H, Edvardsen T, et al. Recommendations for the evaluation of left ventricular diastolic function by echocardiography: an update from the American society of
echocardiography and the European association of cardiovascular imaging. J Am Soc Echocardiogr. 2016;29(4):277–314.
3. Little WC, Oh JK. Echocardiographic evaluation of diastolic function can be used to guide clinical care. Circulation. 2009;120(9):802–9.
4. Petrie MC, Hogg K, Caruana L, McMurray JJV. Poor concordance of commonly used echocardiographic measures of left ventricular diastolic function in patients with suspected heart failure but preserved systolic function: is there a reliable echocardiographic measure of diastolic dysfunction? Heart. 2004;90(5):511–7.
5. Paulus WJ, Tschöpe C, Sanderson JE, Rusconi C, Flachskampf FA, Rademakers FE, et al. How to diagnose diastolic heart failure: a consensus statement on the diagnosis of heart failure with normal left ventricular ejection fraction by the Heart Failure and Echocardiography Associations of the European Society of Cardiology. Eur Heart J. 2007;28(20):2539–50. 6. McCulloch M, Zoghbi WA, Davis R, Thomas C, Dokainish H. Color tissue
Doppler myocardial velocities consistently underestimate spectral tissue Doppler velocities: impact on calculation peak transmitral pulsed Doppler velocity/early diastolic tissue Doppler velocity (E/Ea). J Am Soc Echocardiogr. 2006;19(6):744–8.
7. Geske JB, Sorajja P, Nishimura RA, Ommen SR. Evaluation of left ventricular filling pressures by Doppler echocardiography in patients with hypertrophic cardiomyopathy: correlation with direct left atrial pressure measurement at cardiac catheterization. Circulation. 2007;116(23):2702–8.
8. Mullens W, Borowski AG, Curtin RJ, Thomas JD, Tang WH. Tissue Doppler imaging in the estimation of intracardiac filling pressure in decompensated patients with advanced systolic heart failure. Circulation. 2009;119(1):62–70. 9. Mogelvang R, Biering-Sørensen T, Jensen JS. Tissue Doppler
echocardiography predicts acute myocardial infarction, heart failure, and
cardiovascular death in the general population. Eur Heart J Cardiovasc Imaging. 2015;16(12):1331–7.
10. Lang RM, Badano LP, Mor-Avi V, Afilalo J, Armstrong A, Ernande L, et al. Recommendations for cardiac chamber quantification by echocardiography in adults: an update from the American Society of Echocardiography and the European Association of Cardiovascular Imaging. Eur Heart J Cardiovasc Imaging. 2015;16(3):233–70.
11. Devereux RB, Alonso DR, Lutas EM, Gottlieb GJ, Campo E, Sachs I, et al. Echocardiographic assessment of left ventricular hypertrophy: comparison to necropsy findings. Am J Cardiol. 1986;57(6):450–8.
12. Zoghbi WA, Enriquez-Sarano M, Foster E, Grayburn PA, Kraft CD, Levine RA, et al. Recommendations for evaluation of the severity of native valvular regurgitation with two-dimensional and Doppler echocardiography. J Am Soc Echocardiogr. 2003;16(7):777–802.
13. Hanneman SK. Design, analysis and interpretation of method-comparison studies. AACN Adv Crit Care. 2008;19(2):223–34.
14. Kadappu KK, Thomas L. Tissue Doppler imaging in echocardiography: value and limitations. Heart Lung Circ. 2015;24(3):224–33.
15. de Knegt MC, Biering-Sorensen T, Sogaard P, Sivertsen J, Jensen JS, Mogelvang R. Concordance and reproducibility between M-mode, tissue Doppler imaging, and two-dimensional strain imaging in the assessment of mitral annular displacement and velocity in patients with various heart conditions. Eur Heart J Cardiovasc Imaging. 2014;15(1):62–9. 16. Marwick TH. Clinical applications of tissue Doppler imaging: a promise
fulfilled. Heart. 2003;89(12):1377–8.
17. De Keulenaer GW, Brutsaert DL. Diastolic heart failure: a separate disease or selection bias? Prog Cardiovasc Dis. 2007;49(4):275–83.
18. Yu C-M, Lin H, Yang H, Kong S-L, Zhang Q, Lee SW-L. Progression of systolic abnormalities in patients with“isolated”diastolic heart failure and diastolic dysfunction. Circulation. 2002;105(10):1195–201.
19. Brutsaert DL, De Keulenaer GW. Diastolic heart failure: a myth. Curr Opin Cardiol. 2006;21(3):240–8.
20. Shah AM, Solomon SD. Phenotypic and pathophysiological heterogeneity in heart failure with preserved ejection fraction. Eur Heart J. 2012;33(14):1716–7. 21. Kerut EK. The Mitral L-Wave: a relatively common but ignored useful
finding. Echocardiography. 2008;25(5):548–50.
• We accept pre-submission inquiries
• Our selector tool helps you to find the most relevant journal • We provide round the clock customer support
• Convenient online submission • Thorough peer review
• Inclusion in PubMed and all major indexing services • Maximum visibility for your research
Submit your manuscript at www.biomedcentral.com/submit