R E S E A R C H
Open Access
Perceived environment and public open space
use: a study with adults from Curitiba, Brazil
Rogério César Fermino
1,2*, Rodrigo Siqueira Reis
1,2, Pedro Curi Hallal
3and José Cazuza de Farias Júnior
4Abstract
Background:The aim of this study was to investigate the association between the perceived environment and the use of public open spaces (POS).
Methods:A cross-sectional study with household surveys was conducted in 1,461 adults from Curitiba, Brazil interviewed in person. The perceived environment was evaluated with the Neighborhood Environment Walkability Scale, and the POS use was evaluated using the ordinal scale (increased use).
Results:The presence of interesting objects, heavy traffic, and the number of positive attributes of the environment was positively associated with POS use among men, and the presence of trees was associated with the use among women.
Conclusions:Managers should invest in the architectural attractiveness of neighborhoods and should plant and conserve trees to encourage POS use.
Keywords:Built environment, Physical environment, Green areas, Public parks, Recreational facilities
Introduction
Public open spaces (POS) such as parks, green areas and recreational facilities can help promote healthy liv-ing for people in urban areas by providliv-ing opportun-ities for physical activity practices and leisure activopportun-ities. POS use can also promote physical and psychological well-being and facilitate the social integration of users [1-3]. Recent reviews have documented an association between proximity and access to POS with higher levels of physical activity in youths and adults [4,5]. However, these findings were reported in high-income countries such as North America, Europe and Oceania [1,2,6], which limits the applicability of the results to other so-cial and economic contexts such as low- and middle-income countries.
In Latin American countries, there is little evidence that the presence and use of POS can provide benefits to public health. In Bogota, Colombia, the density of parks and the use of bike lanes are associated with better quality of life in adults [7]. In Curitiba, Brazil, the
accessibility, presence and use of POS are associated with high levels of physical activity [8-10]. These results suggest that the availability of POS and easy community access can encourage greater participation in physical activity within a population.
Several characteristics of the physical and social envir-onment may influence the choice and use of POS in high-income countries [1]. For example, the quality of the structures, access, maintenance, aesthetics and safety of a given area are positively associated with POS use [1,11]. Kaczynski et al. [12] found that the number of physical activity facilities is positively associated with physical activity practices in parks. Moreover, because most people bike or walk to their destinations in Brazil [10], it is possible that the characteristics of the neigh-borhood environment may favor the use of POS [1].
For example, the land use mix near the POS would stimulate residents to walk through the neighborhood to use shops and services in the neighborhood, which could facilitate park use. However, evidence shows an inverse association between the land use mix and park use [13]. In fact, the perception of aesthetics, street quality, traffic safety, crime and lighting of the neighborhood were as-sociated with POS use among Australian and American
* Correspondence:[email protected]
1Pontifícia Universidade Católica do Paraná, School of Health and Biosciences, Curitiba, Brazil
2Universidade Federal do Paraná, Curitiba, Brazil
Full list of author information is available at the end of the article
adults [3,14,15]. However, there have been no similar studies in other countries. It is believed that people liv-ing in better quality neighborhoods would utilize the POS more frequently. The Brazilian population in Sao Paulo city represents one of the worst perceived indexes of safety and access to POS when compared with coun-tries in North America, Europe, Asia and Oceania [16]. Another city in Brazil, Curitiba, is adopting strategies of urban planning that prioritize the construction and ac-cess to POS [17]. To date, there are 1,052 POS distrib-uted in parks, plazas (small central parks), green areas and other places in Curitiba, which are constantly used by adults for physical activity [10,18].
According to a review conducted using several data-bases (Lilacs, SciELO, PubMed and Web of Science), the only study that examined the relationship between the perceived environment and POS use in countries with low and middle income was conducted by Reis et al. [19] and focused on adolescents from Curitiba. The au-thors found that decreased accessibility was inversely as-sociated with physical activity practices in parks [19]. Additional information regarding this relationship in adults can help managers improve the neighborhood characteristics near a POS to increase its use by commu-nity members and benefit public health. The aim of this study was to investigate the association between the per-ceived neighborhood environment and POS use by adults in Curitiba, Brazil.
Methods
Design and place of study
In 2009, a cross-sectional household survey was conducted to evaluate the health characteristics, lifestyle, leisure habits and physical activity practices of adults living around parks and plazas in Curitiba.
Curitiba is the capital of Parana State (Southern Brazil) with a population of 1,746,896 inhabitants (100% urban, 52.3% women). It is the 8th largest city in the country, with a Human Development Index of 0.856 (high) [20], and to date, there are 17 green areas, 21 parks, 454 squares, 16 “eixos de animação” (recreational facilities) and 31 preservation areas dispersed in 75 neighborhoods. In addition, 29 sports and recreational centers offer orga-nized activities for children, adolescents, adults and older adults. The recreational centers promote environmental preservation, and the city offers 64.5 m2of green area per inhabitant, which is greater than the index of 15 m2 /in-habitant recommended to promote good quality of life in Brazil [21]. The Municipal Secretary of Sports, Leisure and Youth and the Municipal Secretary of Health offer intervention programs for physical activity and the pro-motion of healthy habits in the population, which are conducted at recreational facilities [17].
Public open space (POS) selection
Despite the high quantity of POS, some are not intended for physical activity practices. The locations were selected according to their potential for physical activity practices and were located in neighborhoods with different eco-nomic and environmental conditions to represent the char-acteristics of the adult population of the city. To select the study locations (POS), in the first phase, all 75 neighbor-hoods of the city were classified into nine strata based on a built and social environment (ENV) index for physical ac-tivity and income levels. The built environment informa-tion included park density (km2/inhabitants), plaza density (km2/inhabitants), bike lane density (km/inhabitants) and sports and leisure department units (# units/inhabitants) [20]. Crime rate (# crimes/inhabitants) and traffic accident data (# deaths/inhabitants) were used as social environ-mental indicators. Socioeconomic status (SES) was deter-mined based on the average family income [17].
The ENV index was calculated by the sum of stan-dardized built and social environment indicators to cre-ate a common scale (0–100) in which the product indicates the ENV score for each neighborhood. Higher values for this score indicate a better quality environ-ment. The ENV index and SES in each neighborhood were categorized into tertiles and compared in a 3×3 matrix: high, medium, and low quality of ENV for phys-ical activity practices and high, medium, and low SES. Using this matrix, the 75 neighborhoods were classified into nine strata.
The four neighborhoods located in the extreme clusters (high ENV and high SES, high ENV and low SES, low ENV and high SES, or low ENV and low SES) were se-lected to maximize environmental variability. The POS (parks and plazas) were selected using a mixed-methods approach. First, all the POS within each selected neigh-borhood were listed. The list was sent to coordinators from the Secretary of Health and Secretary of Sports and Leisure, who identified the locations in which interven-tions were delivered by their secretaries. After three rounds of consulting, four parks and four plazas were se-lected for evaluation through the consensus obtained in the consultation [22]. The evaluated plazas are considered to be “small parks” and differ from parks in total area, number and diversity of areas for physical activity. The details regarding the place selection and place characteris-tics are available in previous publications [17,22,23].
Selection of residences
identified were ordered using ArcGis software. Finally, to establish geographic representation, one residence was randomly selected in each of the 1,538 eligible segments.
Participant selection
Eligible participants were defined as adults (≥18 yr) liv-ing in a given neighborhood for at least one year. All the selected households were visited in person, and the number of eligible residents was listed at the time of the visit. Study participants were randomly selected from the total eligible residents of the house [24]. A total of three attempts were made on different days and times to contact the subject. Individuals who did not live in the household (e.g., maids and visitors), individuals with physical impairments that limit physical activity practice and individuals with cognitive limitations in understand-ing the questions were excluded.
Number of participants and data collection
Face-to-face interviews were conducted in 95% of the eligible segments, which resulted in a total sample of 1,461 participants. In the statistical analysis, a posteriori [25] showed that the sample (530 men and 931 women) had a power of≥82% (β= 20%) and a confidence level of 95% (α= 5%) to detect odds ratio (OR), which was iden-tified as significant in this study.
The overall refusal rate was 7.9% (n = 121). Quality con-trol of the data collection was performed by field supervi-sors who reinterviewed 74 participants (12.5% of the sample). Eight trained interviewers, all women with high school degrees, conducted the interviews after completing 30 training hours. Data collection occurred between April and July of 2009. The study was approved by the Internal Review Board at the Federal University of Pelotas (005/ 2008) and written informed consent was obtained from the participants for publication of this report.
Outcome variable
The use of a specific POS near a residence was deter-mined by asking the following question:“In the last 12 -months, did you use the park/plaza?” (yes/no). The frequency of POS use was quantified based on a ques-tion with nine response opques-tions (“a few times a year”,“a few times a month”and“one”to“seven times per wk”).
For analytical purposes, POS use was classified on an ordinal scale with four levels: “no use” (0), “use a few times a year/month”(1),“use between 1–3 times/wk”(2) and “use ≥4 times/wk” (3). The test-retest reliability of the POS use measurement was adequate (82 – 92% agreement, kappa 0.65–0.77, p < 0.001).
Independent variables
The perceived environment was assessed with a modi-fied and culturally adapted version of the Neighborhood
Environment Walkability Scale (NEWS) [26] with di-chotomous response options (yes/no). The scale was translated, adapted and validated for the Brazilian con-text [27] and is frequently used in research concerning the association between the perceived environment and physical activity practices [9,28,29]. The pilot study and previous research conducted in Brazil showed that people have difficulty understanding questions when re-sponse options are presented on a Likert scale [30].
Based on the literature review [1,3,14], twelve ques-tions about percepques-tions of neighborhood characteristics that are potentially associated with POS use were se-lected and divided into three categories with four items each: (i) aesthetics, (ii) traffic safety and (iii) crimes safety. The study participants reported the perception of (i) the presence of trees (“There are trees along the streets in my neighborhood”), attractiveness (“There are many interesting things to look at while walking in my neighborhood”), beautiful landscapes and buildings in the neighborhood (“There are many attractive natural sights in my neighborhood”and“There are attractive buildings/ homes in my neighborhood”); (ii) traffic conditions such as flow and speed of vehicles (“There is so much traffic along nearby streets that it makes it difficult or unpleas-ant to walk in my neighborhood” and“The speed of traf-fic on most nearby streets is usually slow”), disregard for speed limits (“Most drivers exceed the posted speed limits while driving in my neighborhood”) and the presence of facilities for crossing streets (“There are crosswalks and pedestrian signals to help walkers cross busy streets in my neighborhood”);and (iii) the presence of people walk-ing/cycling (“Walkers and bikers on the streets in my neighborhood can be easily seen by people in their homes”), crime (“There is a high crime rate in my neigh-borhood”) and safety for walking during the day (“The crime rate in my neighborhood makes it unsafe to go on walks during the day”)and night (“The crime rate in my neighborhood makes it unsafe to go on walks at night”) through the streets of the neighborhood. The test-retest reliability of these variables was adequate in a subsample of participants (70.2 – 88.6% agreement, kappa 0.39 – 0.68, p < 0.05).
The association between each environmental variable and park/plaza use was tested. Additionally, based on the evidence that a combination of perceived environ-mental attributes are associated with physical activity in different countries [16], a variable was created by the sum of the 12 available items to represent the number of positive attributes within each neighborhood (environ-mental score). For this evaluation, the variables“traffic”,
positive attributes of the environment” varied between 0 and 12 points (indicating low and high quality, respect-ively) and was subsequently classified into three categor-ies: 0–5 items (lower quality), 6–7 items and≥8 items (higher quality).
Covariates
Participants were grouped into two age groups (18–39.9 and≥40 years). The methodology proposed by“Associação Brasileira das Empresas de Pesquisa”[31] was used to de-termine SES based on the number of appliances within the household (e.g., television, washing machine), the presence of maids and education level. Based on their household score, the participants were classified into two levels:“low” and“high”. The perceived health was evaluated on a four-point Likert-type scale (“poor”, “regular”,“good” and“very good”) with the following question:“How do you consider your health?” [32]. The response options“good”and“very good”were combined to characterize the variable“positive perceived health”.
Data analysis
The chi-squared (χ2) test for linear trends and hetero-geneity was used to compare the proportions of POS use among the categories of independent variables (each en-vironment variable separately and the enen-vironment score). Ordinal logistic regression with proportional odds model [33] was used to analyze the association be-tween the perceived environment and POS use with the ordinal outcome categorized into four levels:“no use = 0;
“use a few times a year/month = 1”; “use between 1–3 times/wk = 2”and“use≥4 times/wk = 3”. Initially, a vari-ance inflation factor test (VIF) was performed, which rejected the hypothesis of multicollinearity (1/VIF≥ 0.62). All the variables were considered for inclusion in the multiple regression model; however, only the vari-ables with p < 0.20 remained in the final model. The var-iables were inserted at the same level of analysis using the method of forced entry. The following confounding factors were considered: age, SES and perceived health. Under the premise of proportional odds, the Brant test confirmed the explanatory variables individually for men and women with p values ≥0.18 and 0.38, respectively. Analyses were performed using Stata 11, and the proced-ure adopted in the selection of the sample into consider-ation with the command “svy” was used to correct the estimates of variability of POS use. Because the analysis was designed to verify a significant interaction between sex and POS use, study participants were stratified by sex, and the level of significance was maintained at 5%.
Results
Most participants were≥40 years old (58.5%) with high SES (62.1%) and positive perceived health (71.3%). There
was a difference between sexes (p < 0.05) where men presented higher SES and perceived health (Table 1). The perception of safety while walking in the neighbor-hood was higher in men (p < 0.05). Approximately eight out of ten participants reported that it is safe to walk during the day, but the same proportion of people felt unsafe walking at night. The proportion of participants who perceived eight or more positive items in the neigh-borhood environment was higher among men (p = 0.004). Approximately six out of ten participants reported using the POS near the residence, and approximately one out of ten participants reported using the POS at least four times a week. The proportions of men and women in each category of parks/plazas were similar (p = 0.101).
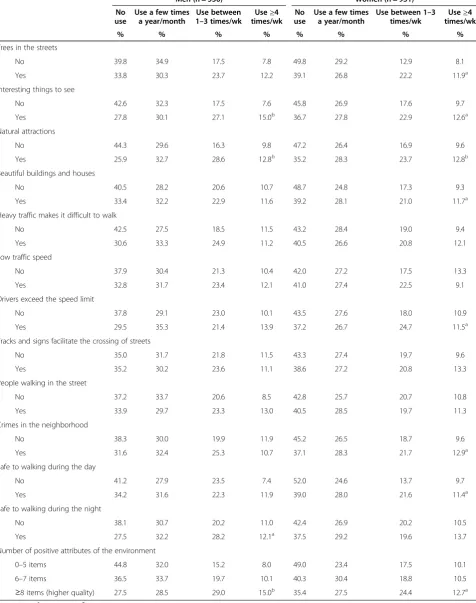
In the bivariate analysis for men (Table 2), the frequency of POS use was higher among participants who reported the presence of interesting things, natural attractions, safety of walking during the night and a higher number of positive attributes of the environment (p < 0.05). Among women, the frequency of POS use was higher among those who reported the presence of trees, interesting things to see, natural attractions, beautiful buildings/homes, disres-pect for speed limits, crime, more safety for walking during the day and a higher number of positive attributes of the environment (p < 0.05).
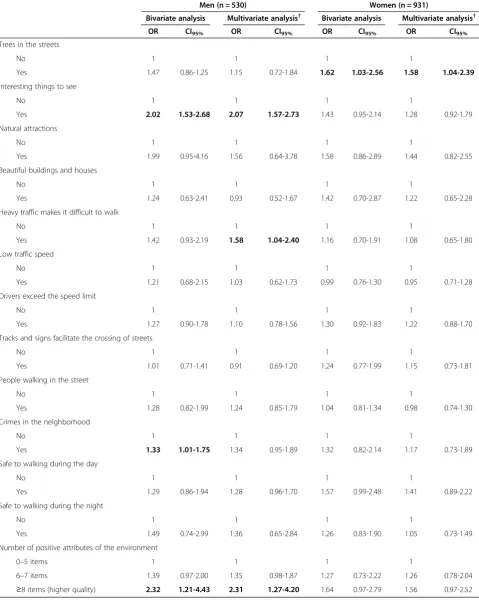
In the bivariate ordinal logistic regression (Table 3), positive associations were found between the perception of interesting things in the neighborhood (OR: 2.02, CI95%: 1.53-2.68), the crime rate (OR: 1.33, CI95%:
1.01-1.75) and the number of positive attributes of the envir-onment (OR: 2.32, CI95%: 1.21-4.43) with POS use by
men. For women, only the presence of trees was associ-ated with the use of POS (OR: 1.62, CI95%: 1.03-2.56).
In the multiple regression analyses (Table 3), the pres-ence of interesting things to see in the neighborhood and the number of positive environmental attributes remained associated with the frequency of POS use by men. The per-ception of heavy traffic gained significance in the multivari-ate analysis, while the perception of crime decreased in the magnitude of the measure of association. Among women, the presence of trees remained associated with the fre-quency of POS use (OR: 1.58, CI95%: 1.04-2.39).
Another important result of this study was to identify a linear association between the number of positive attri-butes of the environment and the frequency of POS use (p < 0.001) (Figure 1); results were maintained when the data were stratified by sex (data not shown).
Discussion
attributes. The selection of neighborhoods allowed the clusion of parks and plazas from areas with different in-come and built environment characteristics. Additionally the selection of parks and plazas followed a comprehen-sive approach allowing the identification of places that were more likely to be used by the population as indi-cated by the secretariats coordinators.
Significant differences were found between men and women. For men, the perception of interesting things, heavy traffic and the number of positive attributes of the environment were associated with frequent POS use. For women, only the presence of trees in the neighborhood streets increased the likelihood of using the spaces. These findings indicate that favorable environments can stimu-late POS use. The results should guide interventions and policies to increase the use of POS in similar contexts.
Evidence shows that the perceived environmental attri-butes of neighborhoods such as aesthetics, safety from crime and traffic are associated with the practice of walking for leisure [9,15,34]. This finding is relevant be-cause 70% of people walk in neighborhood streets [35]. In Pelotas (South Brazil), 73% of adults walk at least one day a week and 41% walk more than 150 min/wk, and walking for leisure is the most frequent physical activity practiced by adults [36,37]. Leslie et al. [3] found a posi-tive association between park use and walking for leisure among Australian adults. Additionally, Koohsari et al. [15] found that the perception of neighborhood aesthet-ics increased the odds of adults walking to and in the neighborhood parks by 117%. In the present study, the Table 1 Sociodemographic characteristics, perceived
environment and public open space use by adults from Curitiba, Brazil, 2009 (n = 1,461)
All (n = 1,461)
Men (n = 530)
Women (n = 931)
p
n % n % n %
Age (yrs)
18–39.9 604 41.5 238 44.9 366 39.5
0.045a
≥40 852 58.5 292 55.1 560 60.5
Economic level
Low 551 37.9 174 33.0 377 40.7
0.004a
High 902 62.1 353 67.0 549 59.3
Perceived health
Negative 420 28.7 126 23.8 294 31.6
0.002a
Positive 1041 71.3 404 76.2 637 68.4
Neighborhood aesthetics
Trees in the streets
No 312 21.4 103 19.5 209 22.5
0.179a
Yes 1147 78.6 426 80.5 721 77.5
Interesting things to see
No 757 51.9 263 49.7 494 53.1
0.211a
Yes 702 48.1 266 50.3 436 46.9
Natural attractions
No 756 51.8 264 49.8 492 52.9
0.256a
Yes 704 48.2 266 50.2 438 47.1
Beautiful buildings and houses
No 357 24.5 131 24.8 226 24.3
0.843a
Yes 1102 75.5 398 75.2 704 75.7
Traffic safety
Heavy traffic makes it difficult to walk
No 552 37.8 200 37.7 352 37.8 0.966a
Yes 908 62.2 330 62.3 578 62.2
Low traffic speed
No 685 46.9 240 45.3 445 47.8 0.345a
Yes 775 53.1 290 54.7 485 52.2
Drivers exceed the speed limit
No 991 67.9 357 67.4 634 68.2 0.749a
Yes 469 32.1 173 32.6 296 31.8
Tracks and signs facilitate the crossing of streets
No 901 61.7 331 62.5 570 61.3 0.660a
Yes 559 38.3 199 37.5 360 38.7
Crimes safety
People walking in the street
No 596 40.8 199 37.6 397 42.7 0.058a
Yes 863 59.2 330 62.4 533 57.3
Crimes in the neighborhood
No 779 53.4 277 52.3 502 54.0 0.528a
Yes 681 46.6 253 47.7 428 46.0
Table 1 Sociodemographic characteristics, perceived environment and public open space use by adults from Curitiba, Brazil, 2009 (n = 1,461)(Continued)
Safe to walking during the day
No 243 16.7 68 12.8 175 18.8 0.003a
Yes 1216 83.3 462 87.2 754 81.2
Safe to walking during the night
No 1143 78.3 381 71.9 762 81.9 <0.001a
Yes 317 21.7 149 28.1 168 18.1
Number of positive attributes of the environment 0–5 items 411 28.2 125 23.8 286 30.8
6-7 items 560 38.5 208 39.5 352 37.9 0.004b
≥8 items (higher quality)
484 33.3 193 36.7 291 31.3
Public open space use
No use 572 39.2 186 35.1 386 41.5 0.101b
Use a few times a year/month
419 28.7 165 31.1 254 27.3
Use between 1–3 times/wk
307 21.0 119 22.5 188 20.2
Use≥4 times/wk 163 11.2 60 11.3 103 11.1
a:χ2
to heterogeneity; b:χ2
Table 2 Distribution of public open space use frequency according with the characteristics of the perceived environment by adults from Curitiba, Brazil, 2009 (n = 1,461)
Men (n = 530) Women (n = 931)
No use
Use a few times a year/month
Use between 1–3 times/wk
Use≥4 times/wk
No use
Use a few times a year/month
Use between 1–3 times/wk
Use≥4 times/wk
% % % % % % % %
Trees in the streets
No 39.8 34.9 17.5 7.8 49.8 29.2 12.9 8.1
Yes 33.8 30.3 23.7 12.2 39.1 26.8 22.2 11.9a
Interesting things to see
No 42.6 32.3 17.5 7.6 45.8 26.9 17.6 9.7
Yes 27.8 30.1 27.1 15.0b 36.7 27.8 22.9 12.6a
Natural attractions
No 44.3 29.6 16.3 9.8 47.2 26.4 16.9 9.6
Yes 25.9 32.7 28.6 12.8b 35.2 28.3 23.7 12.8b
Beautiful buildings and houses
No 40.5 28.2 20.6 10.7 48.7 24.8 17.3 9.3
Yes 33.4 32.2 22.9 11.6 39.2 28.1 21.0 11.7a
Heavy traffic makes it difficult to walk
No 42.5 27.5 18.5 11.5 43.2 28.4 19.0 9.4
Yes 30.6 33.3 24.9 11.2 40.5 26.6 20.8 12.1
Low traffic speed
No 37.9 30.4 21.3 10.4 42.0 27.2 17.5 13.3
Yes 32.8 31.7 23.4 12.1 41.0 27.4 22.5 9.1
Drivers exceed the speed limit
No 37.8 29.1 23.0 10.1 43.5 27.6 18.0 10.9
Yes 29.5 35.3 21.4 13.9 37.2 26.7 24.7 11.5a
Tracks and signs facilitate the crossing of streets
No 35.0 31.7 21.8 11.5 43.3 27.4 19.7 9.6
Yes 35.2 30.2 23.6 11.1 38.6 27.2 20.8 13.3
People walking in the street
No 37.2 33.7 20.6 8.5 42.8 25.7 20.7 10.8
Yes 33.9 29.7 23.3 13.0 40.5 28.5 19.7 11.3
Crimes in the neighborhood
No 38.3 30.0 19.9 11.9 45.2 26.5 18.7 9.6
Yes 31.6 32.4 25.3 10.7 37.1 28.3 21.7 12.9a
Safe to walking during the day
No 41.2 27.9 23.5 7.4 52.0 24.6 13.7 9.7
Yes 34.2 31.6 22.3 11.9 39.0 28.0 21.6 11.4a
Safe to walking during the night
No 38.1 30.7 20.2 11.0 42.4 26.9 20.2 10.5
Yes 27.5 32.2 28.2 12.1a 37.5 29.2 19.6 13.7
Number of positive attributes of the environment
0–5 items 44.8 32.0 15.2 8.0 49.0 23.4 17.5 10.1
6–7 items 36.5 33.7 19.7 10.1 40.3 30.4 18.8 10.5
≥8 items (higher quality) 27.5 28.5 29.0 15.0b 35.4 27.5 24.4 12.7a
a
p < 0.05 andb
p < 0.001 onχ2
Table 3 Ordinal logistic regression for the association between perceived environment and public open space use* by adults from Curitiba, Brazil, 2009 (n = 1,461)
Men (n = 530) Women (n = 931)
Bivariate analysis Multivariate analysis† Bivariate analysis Multivariate analysis†
OR CI95% OR CI95% OR CI95% OR CI95%
Trees in the streets
No 1 1 1 1
Yes 1.47 0.86-1.25 1.15 0.72-1.84 1.62 1.03-2.56 1.58 1.04-2.39
Interesting things to see
No 1 1 1 1
Yes 2.02 1.53-2.68 2.07 1.57-2.73 1.43 0.95-2.14 1.28 0.92-1.79
Natural attractions
No 1 1 1 1
Yes 1.99 0.95-4.16 1.56 0.64-3.78 1.58 0.86-2.89 1.44 0.82-2.55
Beautiful buildings and houses
No 1 1 1 1
Yes 1.24 0.63-2.41 0.93 0.52-1.67 1.42 0.70-2.87 1.22 0.65-2.28
Heavy traffic makes it difficult to walk
No 1 1 1 1
Yes 1.42 0.93-2.19 1.58 1.04-2.40 1.16 0.70-1.91 1.08 0.65-1.80
Low traffic speed
No 1 1 1 1
Yes 1.21 0.68-2.15 1.03 0.62-1.73 0.99 0.76-1.30 0.95 0.71-1.28
Drivers exceed the speed limit
No 1 1 1 1
Yes 1.27 0.90-1.78 1.10 0.78-1.56 1.30 0.92-1.83 1.22 0.88-1.70
Tracks and signs facilitate the crossing of streets
No 1 1 1 1
Yes 1.01 0.71-1.41 0.91 0.69-1.20 1.24 0.77-1.99 1.15 0.73-1.81
People walking in the street
No 1 1 1 1
Yes 1.28 0.82-1.99 1.24 0.85-1.79 1.04 0.81-1.34 0.98 0.74-1.30
Crimes in the neighborhood
No 1 1 1 1
Yes 1.33 1.01-1.75 1.34 0.95-1.89 1.32 0.82-2.14 1.17 0.73-1.89
Safe to walking during the day
No 1 1 1 1
Yes 1.29 0.86-1.94 1.28 0.96-1.70 1.57 0.99-2.48 1.41 0.89-2.22
Safe to walking during the night
No 1 1 1 1
Yes 1.49 0.74-2.99 1.36 0.65-2.84 1.26 0.83-1.90 1.05 0.73-1.49
Number of positive attributes of the environment
0–5 items 1 1 1 1
6–7 items 1.39 0.97-2.00 1.35 0.98-1.87 1.27 0.73-2.22 1.26 0.78-2.04
≥8 items (higher quality) 2.32 1.21-4.43 2.31 1.27-4.20 1.64 0.97-2.79 1.56 0.97-2.52
perception of neighborhood attractiveness increased the odds of POS use among men. This association may be explained by the scenery observed during the commute to a POS, which encourages the practice of walking in neighborhood streets [38] and in the POS near the home. Eyler et al. [35] found that 36% of people walk in parks regularly. The neighborhood aesthetics were po-tentially associated with the practice of walking among men but not among women [38]. Leslie et al. [3] found no association between perceived aesthetics and monthly use of the parks; however, their analysis was not strati-fied by sex as in the present study.
Men who perceived traffic were more likely to use POS. However, others studies found a positive associ-ation between perceptions of low vehicle speed, light traffic volume, higher safety from traffic and the use of POS such as parks and bike lanes [3,14,15]. The associ-ation found in the present study can be attributed to men being more physically active in commuting to the POS. Men are more likely to be exposed to heavy traffic in the neighborhood and on city streets because Curitiba has the highest ratio of vehicles per capita in the country (1:2) [9]. Despite the lack of association between the traffic safety perception and the practice of walking for leisure in Curitiba adults [9], excess vehicles and heavy traffic can pollute the streets and make walking unpleas-ant. Brownson et al. [39] found a positive association be-tween the perception of traffic and physical activity. It is possible that the proximity, the green areas and the trails available in the POS favor its use [11,22,34,38]. In fact, the POS use in Curitiba is associated with walking for leisure [10], and the activity was reported more fre-quently by respondents (52%, data not shown).
For women, the presence of trees in the neighborhood street increased the likelihood of POS use. Curitiba has
one of the highest levels of green area per inhabitant in Brazil (64.5 m2/inhabitant), and most of these areas are located in parks, plazas and green areas within the city. We believe that the home proximity to POS may have favored the observed association [11]. The physical characteristics of parks and the presence of green areas can attract individuals, especially women, to leisure activities [1,11]. The association for women alone can be explained by the characteristics of the occupation of the POS because many women use green areas for walking [2]. In Brazil, walking is a common physical activity for leisure among women (61%) [37], and it occurs at a high frequency in parks and plazas in Curitiba. Among POS users, 57% of women and 44% of men reported the use of the POS for walking (data not shown).
The association between the number of positive at-tributes of the environment and POS use (Figure 1) reinforces the idea that the full set of attributes of a neighborhood (aesthetics, traffic and crimes safety) encourages park use rather than any feature alone. The lack of association among women (Table 3) sug-gests an interaction effect between the variables. In the analysis of all the participants, the highest envir-onmental quality (≥8 items) was associated with POS use (OR: 1.81, CI95%: 1.11-2.93). These results can be
partly explained by inequalities related to leisure op-portunities between sexes. In Brazil, women spend three times more time performing house work than men [40]. This accumulation of tasks can reduce the availability of time for leisure and negatively influence the perception of opportunities for the use of parks independently of the quality of the environment. In general, POS use was higher among men (65% vs. 59%, p = 0.018).
trend = 23.8; p<0.001 X2
Limitations
Some limitations should be considered when interpreting the results. The sample was not representative of the city because it was restricted to adults living around the POS with potential for physical activity. Thus, the results can-not be extrapolated to the whole community. A high quantity of POS in Curitiba is responsible for 77% of the population reporting the existence of places close to the home for physical activity practices [41]. This character-istic may explain the lack of association between most of the environmental attributes and POS use. Since 1998, the city council invested in an intervention program to promote physical activity (CuritibAtiva) with structured activities for the community [17]. Much of the program’s actions occur in parks, plazas, and other POS, which can stimulate POS use independently of the environmental quality of the neighborhood. Additionally, the quality of features present within the selected POS (e.g., green areas, recreational facilities and tree coverage) was not analyzed. Therefore, the study did not account for the relative importance of such attributes in POS use. While the study provides data on POS use, it does not indicate how the parks and plazas were used. It also does not pro-vide data on the physical activities (frequency, intensity, type or time) performed within the POS.
Conclusions
The presence of attractions, heavy traffic, trees and the number of positive attributes of the neighborhood envir-onment were all associated with increased POS use. Managers should invest in improving and maintaining these environmental characteristics in neighborhoods close to parks to facilitate and/or encourage POS use. Investing in architectural projects to improve the aesthet-ics of buildings and public works and planting and con-servation of trees and green areas should be encouraged to make the neighborhood more pleasant and attractive and increase POS use. The use of POS can promote physical activity and, consequently, the physical and psy-chological well-being of a given population. Because the quality of facilities for physical activity practices are im-portant factors to POS use, future studies should con-sider the role of the features, conditions, accessibility, aesthetics, safety and social environment in the POS use patterns in low- and medium-income countries.
Competing interests
The authors declare that they have no conflict of interests.
Authors’contributions
RC Fermino and RS Reis conceived and designed the study, prepared the data, conducted the analysis and data interpretation, and wrote the manuscript. PC Hallal contributed to the study design and reviewed the manuscript for important intellectual content. JC Farias Júnior reviewed the manuscript for important intellectual content. All the authors read and approved the final version.
Acknowledgments
The first author received a scholarship from CAPES (Coordenação de Aperfeiçoamento de Pessoal de Nível Superior), and this study was funded through CNPq (Conselho Nacional de Desenvolvimento Científico e Tecnológico) (Edital Universal MCT/CNPq 014/2008).
Author details 1
Pontifícia Universidade Católica do Paraná, School of Health and Biosciences, Curitiba, Brazil.2Universidade Federal do Paraná, Curitiba, Brazil. 3
Universidade Federal de Pelotas, Pelotas, Brazil.4Universidade Federal da Paraíba, João Pessoa, Brazil.
Received: 28 March 2012 Accepted: 7 March 2013 Published: 15 March 2013
References
1. Bedimo-Rung AL, Mowen AJ, Cohen DA:The significance of parks to physical activity and public health: a conceptual model.Am J Prev Med
2005,28:159–168.
2. Lee AC, Maheswaran R:The health benefits of urban green spaces: a review of the evidence.J Public Health (Oxf )2010,33:212–222. 3. Leslie E, Cerin E, Kremer P:Perceived neighborhood environment and
park use as mediators of the effect of area socio-economic status on walking behaviors.J Phys Act Health2010,7:802–810.
4. Ding D, Sallis JF, Kerr J, Lee S, Rosenberg DE:Neighborhood environment and physical activity among youth: a review.Am J Prev Med2011,41:442–455. 5. Durand CP, Andalib M, Dunton GF, Wolch J, Pentz MA:A systematic review
of built environment factors related to physical activity and obesity risk: implications for smart growth urban planning.Obes Rev2011,12:e173–e182. 6. Kaczynski AT, Henderson KA:Parks and recreation settings and active
living: a review of associations with physical activity function and intensity.J Phys Act Health2008,5:619–632.
7. Sarmiento OL, Schmid TL, Parra DC, Diaz-del-Castillo A, Gomez LF, Pratt M, Jacoby E, Pinzon JD, Duperly J:Quality of life, physical activity, and built environment characteristics among colombian adults.J Phys Act Health
2010,7:S181–S195.
8. Hino AAF, Reis RS, Sarmiento OL, Parra DC, Brownson RC:The built environment and recreational physical activity among adults in Curitiba, Brazil.Prev Med2011,52:419–422.
9. Parra DC, Hoehner CM, Hallal PC, Ribeiro IC, Reis RS, Brownson RC, Pratt M, Simoes EJ:Perceived environmental correlates of physical activity for leisure and transportation in Curitiba, Brazil.Prev Med2011,52:234–238. 10. Fermino RC, Reis RS, Cassou AC:Individual and environmental factors
associated with park and plaza use in adults from Curitiba, Brazil.Rev
Bras Cineantropom Desempenho Hum2012,14:377–389.
11. McCormack GR, Rock M, Toohey AM, Hignell D:Characteristics of urban parks associated with park use and physical activity: A review of qualitative research.Health Place2010,16:712–726.
12. Kaczynski AT, Potwarka LR, Saelens BE:Association of park size, distance, and features with physical activity in neighborhood parks.Am J Public
Health2008,98:1451–1456.
13. Kaczynski AT, Johnson AJ, Saelens BE:Neighborhood land use diversity and physical activity in adjacent parks.Health Place2010,16:413–415. 14. Troped PJ, Saunders RP, Pate RR, Reininger B, Ureda JR, Thompson SJ:
Associations between self-reported and objective physical
environmental factors and use of a community rail-trail.Prev Med2001,
32:191–200.
15. Koohsari MJ, Karakiewicz JA, Kaczynski AT:Public open space and walking: the role of proximity, perceptual qualities of the surrounding built environment, and street configuration.Enviroment Bevaviour2012:1–31. 16. Sallis JF, Bowles HR, Bauman A, Ainsworth BE, Bull FC, Craig CL, Sjöström M,
De Bourdeaudhuij I, Lefevre J, Matsudo V,et al:Neighborhood environments and physical activity among adults in 11 countries.Am J
Prev Med2009,36:484–490.
17. Reis RS, Hallal PC, Parra DC, Ribeiro IC, Brownson RC, Pratt M, Hoehner CM, Ramos L:Promoting physical activity through community-wide policies and planning: findings from Curitiba, Brazil.J Phys Act Health2010,
7:S137–S145.
19. Reis RS, Hino AAF, Florindo AA, Rodriguez Anez CR, Domingues MR:
Association between physical activity in parks and perceived environment: A study with adolescents.J Phys Act Health2009,
19:503–509.
20. Instituto de Pesquisa e Planejamento Urbano de Curitiba. Curitiba em dados.
2009. http://www.ippuc.org.br/default.php.
21. Harder ICF, Ribeiro RCS, Tavares AR:Green area and vegetation cover indexes for commons in the city of Vinhedo, SP.R Árvore2006,30:277–282. 22. Hino AAF, Reis RS, Parra D, Ribeiro IC, Brownson RC, Fermino RC:Using
observational methods to evaluate public open spaces and physical activity in Brazil.J Phys Act Health2010,7:S146–S154.
23. Pucci G, Reis RS, Rech CR, Hallal PC:Quality of life and physical activity among adults: population-based study in Brazilian adults.Qual Life Res
2012,21:1–7.
24. Kish L:Sampling organizations and groups of unequal sizes.Am Sociol Rev1965,30:564–572.
25. Campbell MJ, Julious SA, Altman DG:Estimating sample sizes for binary, ordered categorical, and continuous outcomes in two group comparisons.BMJ1995,311:1145–1148.
26. Cerin E, Saelens BE, Sallis JF, Frank LD:Neighborhood environment walkability scale: validity and development of a short form.Med Sci
Sports Exerc2006,38:1682–1691.
27. Malavasi LM, Duarte MFS, Both J, Reis RS:Neighborhood walkability scale (NEWS - BRAZIL): Back translation and reliability.Rev Bras Cineantropom
Desempenho Hum2007,9:339–350.
28. Amorim TC, Hallal PC, Azevedo M Jr:Physical activity levels according to physical and social environmental factors in a sample of adults living in south Brazil.J Phys Act Health2010,7:S204–S212.
29. Salvador EP, Reis RS, Florindo AA:Practice of walking and its association with perceived environment among elderly Brazilians living in a region of low socioeconomic level.Int J Bev Nutrit Phys Activity2010,7:67. 30. Gomes GAO, Reis RS, Parra DC, Ribeiro IC, Hino AAF, Hallal PC, Malta DC,
Brownson RC:Walking for leisure among adults from three Brazilian cities and its association with perceived environment attributes and personal factors.Int J Behav Nutr Phys Act2011,8:111.
31. Associação Brasileira de Empresas de Pesquisa. Critério de Classificação
Econômica do Brasil.2009. http://www.abep.org/novo/index.htm.
32. VIGITEL BRASIL:Vigilância de fatores de risco e proteção para doenças
crônicas por inquérito telefônico.2010. http://portal.saude.gov.br/portal/
arquivos/pdf/vigitel_2010_preliminar_web.pdf.
33. Abreu MNS, Siqueira AL, Caiaffa WT:Ordinal logistic regression in epidemiological studies.Rev Saude Publica2009,43:183–194.
34. Saelens BE, Handy SL:Built environment correlates of walking: a review.
Med Sci Sports Exerc2008,40:S550–S566.
35. Eyler AA, Brownson RC, Bacak SJ, Housemann RA:The epidemiology of walking for physical activity in the United States.Med Sci Sports Exerc
2003,35:1529–1536.
36. Hallal PC, Azevedo MR, Reichert FF, Siqueira FV, Araújo CLP, Victora CG:
Who, when, and how much? Epidemiology of walking in a middle-income country.Am J Prev Med2005,28:156–161.
37. Malta DC, Moura EC, Castro AM, Cruz DKA, Neto OLM, Monteiro CA:
Physical activities pattern among brazilian adults: Results of phone survey, 2006.Epidemiol Serv Saúde2009,18:7–16.
38. Wendel-Vos W, Droomers M, Kremers S, Brug J, van Lenthe F:Potential environmental determinants of physical activity in adults: a systematic review.Obes Rev2007,8:425–440.
39. Brownson RC, Baker EA, Housemann RA, Brennan LK, Bacak SJ:
Environmental and policy determinants of physical activity in the United States.Am J Public Health2001,91:1995–2003.
40. Pinheiro L, Fontoura NO, Querino AC, Bonetti A, Rosa W:Retrato das
desigualdades de gênero e raça.2009. http://www.ipea.gov.br/portal/.
41. Prefeitura Municipal de Curitiba:Perfil das doenças e agravos não
transmissíveis e fatores de risco.Secretaria Municipal da Saúde. Centro de
Epidemiologia. Coordenação de Diagnóstico em Saúde; 2008:17.
doi:10.1186/1479-5868-10-35
Cite this article as:Ferminoet al.:Perceived environment and public open space use: a study with adults from Curitiba, Brazil.International Journal of Behavioral Nutrition and Physical Activity201310:35.
Submit your next manuscript to BioMed Central and take full advantage of:
• Convenient online submission
• Thorough peer review
• No space constraints or color figure charges
• Immediate publication on acceptance
• Inclusion in PubMed, CAS, Scopus and Google Scholar
• Research which is freely available for redistribution