R E S E A R C H A R T I C L E
Open Access
An in situ experimental study of Zr
4+
transport capacity of water-rich fluids in
the temperature and pressure range of the
deep crust and upper mantle
Bjorn Mysen
Abstract
Throughout the Earth’s history, mass transport involved fluids. In order to address the circumstances under which Zr4+may have been transported in this manner, its solubility behavior in aqueous fluid with and without NaOH and SiO2in equilibrium with crystalline ZrO2was determined from 550 to 950 °C and 60 to 1200 MPa. The measurements were carried out in situ while the samples were at the temperatures and pressures of interest. In ZrO2-H2O and ZrO2-SiO2-H2O fluids, the Zr
4+
concentration ranges from ≤10 to ~70 ppm with increasing temperature and pressure. Addition of SiO2 to the ZrO2-H2O system does not affect these values appreciably. In these two environments, Zr4+ forms simple oxide complexes in the H2O fluid with ΔH ~ 40 kJ/mol for the solution equilibrium, ZrO2(solid) = ZrO2(fluid). The Zr
4+
concentration in aqueous fluid increases about an order of magnitude upon addition of 1 M NaOH, which reflects the formation of zirconate complexes. The principal solution mechanism is ZrO2+ 4NaOH = Na4ZrO4+ 2H2O withΔH ~ 200 kJ/mol. Addition of both SiO2and NaOH to ZrO2-H2O enhances the Zr
4+
by an additional factor of about 5 with the formation of partially protonated alkali zircon silicate complexes in the fluid. The principal solution mechanism is 2ZrO2+ 2NaOH + 2SiO2= Na2Zr2Si2O9+ H2O with ΔH ~ 40 kJ/mol. These results, in combination with other published experimental data, imply that fluid released during high-temperature/high-pressure dehydration of hydrous mineral assemblages in the Earth’s interior under some circumstances may carry significant concentrations of Zr and probably other high field strength elements (HFSEs). This suggestion is consistent with the occurrence of Zr-rich veins in high-grade metamorphic eclogite and granulite terranes. Moreover, aqueous fluids transported from dehydrating oceanic crust into overlying mantle source rocks of partial melting also may carry high-abundance HFSE of fluids released from dehydrating slabs and transported to the source rock of partial melting in the overlying mantle wedge. These processes may have been operational in the Earth’s history within which subduction resembling that observed today was operational.
Keywords:Mass transfer, Aqueous fluid, High pressure, Structure, Solubility, Spectroscopy
Background
Mass transfer in the deep crustal and upper mantle in-volves fluids, supercritical fluids, and melts. In the young Earth’s mantle and crust, stable isotope evidence is con-sistent with liquid water interacting with zircon-bearing rocks (e.g., Compston and Pidgeon 1986, Mojzsis et al. 2001, Valley et al. 2005). Early mass transfer processes
were not, however, necessarily similar to more recent activities (Kröner and Layer 1992, Hamilton 2007). For example, subduction zone processes, an area of major mass transfer in more recent terrestrial environments, may not have begun until some 1–2 billion years later (Hamilton, 2007). From this time in the Earth’s history until the present day, fluid was transferred from dehy-drating hydrous minerals in subduction zone materials to the overlying mantle wedge where partial melting may occur (e.g., Bebout 2007). These magmatic liquids would carry element signatures of the source of those Correspondence:[email protected]
Submission to SPEPS: High-Pressure Earth and Planetary Science in the last and next Decade
Geophysical Laboratory, Carnegie Instn. Washington, Washington, DC, USA
fluids (Gill 1981, Wyllie and Sekine 1982, Tatsumi and Eggins 1995, Hermann et al. 2006).
It is often found, however, that the solubility of high field strength elements (HFSEs) such as Ti, Hf, Zr, Nb, and Ta in pure H2O fluids is in the ppm range (Brenan et al. 1994, Audetat and Keppler 2005, Antignano and Manning 2008, Newton et al. 2010, Bernini et al. 2013), which would suggest that H2O alone is not an efficient HFSE transport medium at least in the temperature/ pressure range of the crust and upper mantle. There is, however, evidence from veins in high-grade meta-morphic terranes that Zr and other HFSEs can be sig-nificantly mobile (Giere 1986, Philippot and Selverstone 1991, Möller et al. 2002). The latter observations have led to suggestions that complexing of HFSEs with major-element solutes in aqueous fluids would greatly enhance the HFSE solubility. Scattered solubility data of some HFSEs in water-rich multi-component fluids at high temperature and pressure are consistent with such ideas (Ayers and Watson 1993, Antignano and Manning 2008, Mysen 2012, Ayers et al. 2012, Louvel et al. 2013). Effects of major element composition on HFSE solubility in silicate melts have also been reported (Watson 1976, 1979, Ellison and Hess 1986, Linnen and Keppler 2002).
The majority of experimental studies have focused on zircon (ZrSiO4) solubility in fluids and typically on its solubility in pure H2O or in aqueous solution as a function of additional solutes (SiO2, NaOH, Na-silicates, etc.). That approach limits the interpretation of the solution mechan-ism of Zr4+in fluids because the presence of SiO2in those experiments restricts identification of effects of individual components on Zr4+ solution mechanisms. Moreover, most, although not all, characterizations of experimental charges were carried out on fluids after returning the sam-ple to ambient temperature and pressure. This process often leads to compositional and structural changes of the fluid because solubility in aqueous fluid typically is temperature- and pressure-dependent (Pascal and Anderson 1989, Manning 1994) and, thus, changes along the pressure-temperature path of the quenching path.
In the present study, experiments were carried out in order to address some of the unanswered questions regard-ing the solubility and solution mechanism(s) of Zr4+ in aqueous solutions. Experimental complexities resulting from compositional and structural changes during quenching of the aqueous fluid to ambient conditions after an experiment were avoided by examination of the Zr-saturated fluids in situ while these were at the temperatures and pressures of interest. The effects of specific solutes on Zr4+solubility and solution mechanisms in aqueous solution were addressed.
Methods
Aqueous fluids (double-distilled, deionized H2O and 1 M NaOH aqueous solutions) together with crystalline
spectroscopically pure ZrO2(Alfa Aesar™) and SiO2(Alfa Aesar™) were used as starting materials. The grain size of the oxides was less than 5 μm. Crystalline Na2ZrO3was synthesized from spectroscopically pure Na2CO3+ SiO2 mixtures at ambient pressure by using the method of multiple heat cycles (to ~1000 °C at ambient pressure) described by Ampian (1968). Results from X-ray diffrac-tometry indicated the complete reaction of Na2CO3+ SiO2 to crystalline Na2ZrO3.
In situ, high-temperature/high-pressure experiments were carried out in externally heated, hydrothermal dia-mond anvil cells (HDAC) (Bassett et al. 1996). Iridium was used as gasket material in order to avoid chemical reaction between the gasket and aqueous solutions dur-ing the experiments. Gasket thickness was 125μm with a 500 μm diameter sample hole. Temperatures were measured with two K-type thermocouples touching the upper and lower diamonds at a distance of about 1 mm from the sample. The temperature variations within the cell, as indicated by NaCl melting at ambient pressure, are 2–3 °C.
In the hydrothermal diamond cell experiments, pressure was generated by increasing the temperature of the aque-ous solution + solid sample contained in the sample hole of the Ir gasket. Pressure is, therefore, a temperature-dependent variable. This temperature-temperature-dependent pressure is governed by the PVT properties of the fluid (e.g., Bassett et al. 1996). The hydrothermal diamond cell experimental protocol does not, therefore, allow for independent control of pressure. Pressure was determined with the one-phonon shift in the Raman spectra by using a 10–20μm chip of synthetic carbon-13 diamond located within the sample region itself (Schiferl et al. 1997, Mysen and Yamashita 2010). Synthetic carbon-13 diamond was used for this purpose to avoid interference of the Raman signal from the natural diamond anvils in the diamond anvil cell. The frequency difference between the one-phonon Raman shifts from carbon-12 and carbon-13 is about 80 cm−1(Hanfland et al. 1985).
A confocal JASCO™ Model NRS-3100 microRaman
translates to a ±40 MPa precision of pressure measure-ments. The overall pressure uncertainty, which also in-cludes the uncertainty in the calibration of the one-phonon Raman shift of the carbon-13 diamond from Mysen and Yamashita (2010), is ±110 MPa. This uncertainty (and precision) was the same in all experiments.
Raman spectra of the samples (fluids and crystalline materials) were recorded with 1200 grooves/mm grating density, which in the frequency range of interest in the present study yields a spectral range of ~1900 cm−1per CCD window (decreasing slightly with distance from the excitation line) and a frequency uncertainty of ~±3 cm−1. This uncertainty is not an issue given the large width of the Raman bands of fluids and crystals at the high temper-atures of the experiments (full width at half height (FWHH)≥30 cm−1).
Experiments were conducted in several temperature/ pressure series. The proportion of fluid and solid phases in the various experimental series differs. The pressure-temperature trajectories, therefore, also differ between individual experimental series.
In each experimental series, the sample was initially brought to the highest planned temperature and pres-sure, left there for about an hour followed by recording the spectra of fluid and coexisting solid materials. The spectra of carbon-13 diamond for pressure determin-ation also were recorded at each temperature to deter-mine the pressure. The temperature was then lowered at 1 °C/s to the next temperature/pressure condition where the same spectroscopic acquisition protocol was used. A 60-minute dwell time at each temperature and pressure prior to analysis is considered sufficient to reach equilib-rium given that similar experimental duration has been shown sufficient to establish isotopic equilibrium be-tween fluid and condensed phases at similar tempera-tures (Horita 1988, Mysen 2015). Moreover, Wilke et al. (2012), using a similar experimental protocol, found a constant Zr concentration in fluid coexisting with crystal-line ZrO2after a 15–30-minute experimental duration. Results
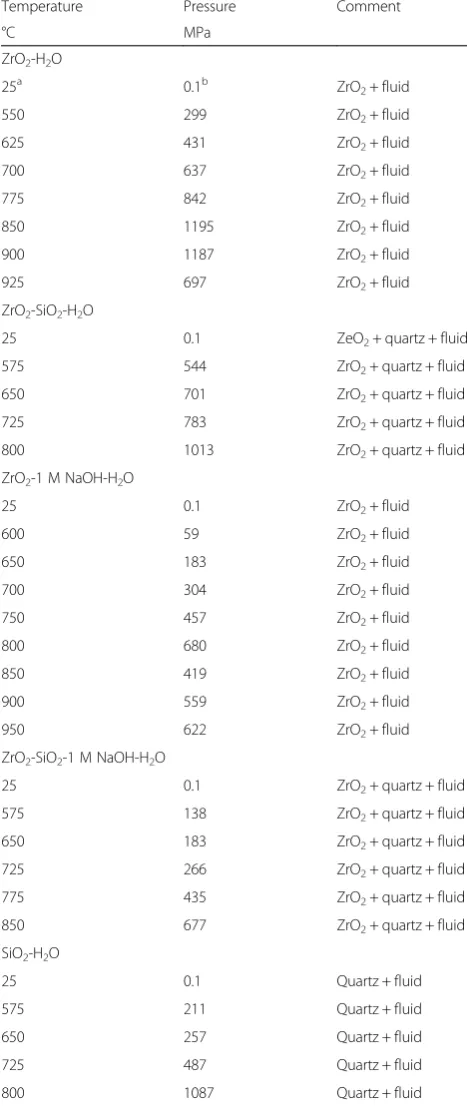
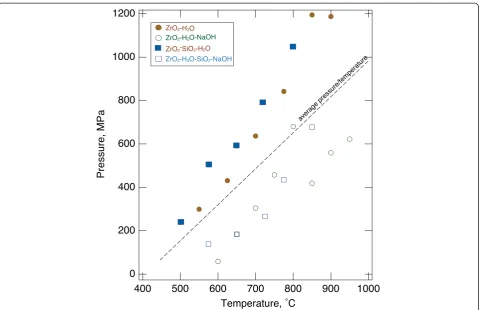
In the HDAC experiments, there is a general increase in pressure with increasing temperature (Table 1; see also Fig. 1). The“average pressure”shown in the subsequent figures is that corresponding to the intersection of the temperature with a single straight line fitted to all the data points (Fig. 1; see Tables 2 and 3 for regression pa-rameters). The exact pressure for each data point can be extracted from the data in Table 1.
Raman spectroscopy
Raman spectra were collected in the ~300–2000 cm−1 and ~3000–4100 cm−1frequency ranges. The higher fre-quency range comprises signals from fundamental OH
vibrations. In the low-frequency range, Raman signals from vibrations in Zr-O and Si-O bonding environments can be detected.
Table 1Experimental conditions
Temperature Pressure Comment
°C MPa
ZrO2-H2O
25a 0.1b ZrO
2+ fluid
550 299 ZrO2+ fluid
625 431 ZrO2+ fluid
700 637 ZrO2+ fluid
775 842 ZrO2+ fluid
850 1195 ZrO2+ fluid
900 1187 ZrO2+ fluid
925 697 ZrO2+ fluid
ZrO2-SiO2-H2O
25 0.1 ZeO2+ quartz + fluid
575 544 ZrO2+ quartz + fluid
650 701 ZrO2+ quartz + fluid
725 783 ZrO2+ quartz + fluid
800 1013 ZrO2+ quartz + fluid
ZrO2-1 M NaOH-H2O
25 0.1 ZrO2+ fluid
600 59 ZrO2+ fluid
650 183 ZrO2+ fluid
700 304 ZrO2+ fluid
750 457 ZrO2+ fluid
800 680 ZrO2+ fluid
850 419 ZrO2+ fluid
900 559 ZrO2+ fluid
950 622 ZrO2+ fluid
ZrO2-SiO2-1 M NaOH-H2O
25 0.1 ZrO2+ quartz + fluid
575 138 ZrO2+ quartz + fluid
650 183 ZrO2+ quartz + fluid
725 266 ZrO2+ quartz + fluid
775 435 ZrO2+ quartz + fluid
850 677 ZrO2+ quartz + fluid
SiO2-H2O
25 0.1 Quartz + fluid
575 211 Quartz + fluid
650 257 Quartz + fluid
725 487 Quartz + fluid
800 1087 Quartz + fluid
a
Temperature uncertainty: 2–3 °C (see text)
b
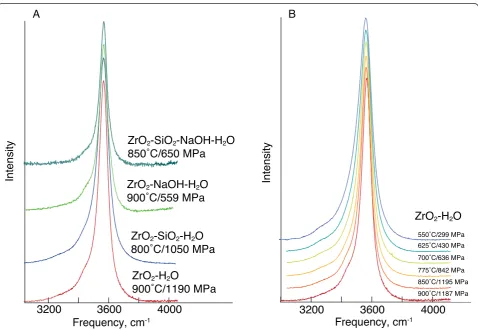
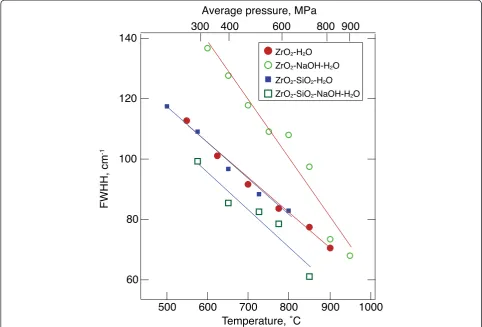
The spectra in the high-frequency range characteristic-ally show a sharp maximum near 3600 cm−1 with an asymmetry toward lower frequency, in particular at the lower temperatures (Fig. 2). For all compositions, the FWHH of this peak decreases with increasing temperature and pressure (Fig. 3). These features are qualitatively similar to the changes in the same fre-quency region of the Raman spectra of other aque-ous fluids systems (Walrafen et al. 1986, 1999, Frantz et al. 1993).
The FWHH vs. temperature relations in the spec-tra of fluids in the ZrO2-H2O and ZrO2-SiO2-H2O systems are identical within the error of the mea-surements (Fig. 3). The FWHH is more sensitive to temperature with NaOH added to the H2O fluid (Tables 2 and 3). Addition of SiO2 (ZrO2-SiO2-NaOH-H2O) re-sults in FWHH that may be slightly narrower than without SiO2 and up to >40 cm−1 narrower than in fluid spectra from the SiO2-free ZrO2-NaOH-H2O system (Fig. 3).
Fig. 1Summary of temperature/pressure conditions of all experiments. Thedashed linerepresents a simple linear fit to all the data points (see Tables 2 and 3 for regression coefficients). See also text for additional discussion of this fit
Table 2Regression coefficients for figures,y=a+bx
Comment a b r2
Figure 1: pressure (MPa) =a+b•temperature (°C) −677 ± 308 1.7 ± 0.4 0.42
Figure 3: FWHH(cm−1) =
a+b•temperature (°C)
ZrO2-H2O 175 ± 4 0.116 ± 0.006 0.995
ZrO2-NaOH-H2O 255 ± 14 −0.19 ± 0.02 0.95
ZrO2-SiO2-H2O 176 ± 6 −0.120 ± 0.008 0.993
ZrO2-SiO2-NaOH-H2O 170 ± 15 −0.12 ± 0.02 0.96
Note that data from the system ZrO2-SiO2-H2O are not shown because only two compositions at nearby temperatures were determined, and for those, there was
no discernible temperature effect (see also Fig.3)
The vibrations in this high-frequency range (Fig. 2) are assigned to fundamental O-H stretching possibly in sev-eral locally different environments (Scholze 1960, Mysen and Virgo 1986, Walrafen et al. 1986, Le Losq et al. 2011). Their frequencies reflect which cation or cations form bonds with OH groups. Here, these cations could be H+, Na+, Si4+, and Zr4+. In addition, hydrogen
bonding may play a role, in particular at temperatures below about 600 °C (Walrafen et al. 1999, Foustoukos and Mysen 2012). Linkage of OH groups to Na+ lowers the OH fundamental frequency compared with the spectrum of pure H2O (Mysen and Virgo 1986). This could appear as an asymmetry toward lower frequency as observed in the spectra of the ZrO2-NaOH-H2O and
Table 3Regression coefficients for figures,y=a+bx
Comment a b r2 ΔH (kJ/mol)
Figure 6: lnK=a+b/T(K−1)
ZrO2-H2O (ZH) −2.4 ± 1.9 −5121 ± 1940 0.78 43 ± 16
ZrO2-NaOH-H2O (low-dens) (ZHN-lo) 32 ± 3 −23,436 ± 2910 0.98 195 ± 24
ZrO2-NaOH-H2O (high-dens) (ZHN-hi) 39 ± 4 −27,866 ± 3540 0.95 232 ± 29
ZrO2-NaOH-H2O (ZHNS) 19 ± 1 −11,467 ± 1350 0.98 94 ± 11
ZrO2-NaOH-H2O (ZHN-Wilke et al.2012) 44 ± 1 −33,845 ± 175 0.999 282 ± 15
ZrO2-SiO2-NaOH-H2O (ZHNS) 5.7 ± 0.5 −3655 ± 473 0.95 30 ± 4
Abbreviations:ZH: ZrO2-H2O;ZHN (-lo, -hi, -Wilke et al.2012, and ZHNS): ZrO2-NaOH-H2O with low- and high-density (pressure) trajectories, interpolation from
Wilke et al. (2012), and the ZHN equilibrium in the more complete system ZrO2SiO2-NaOH-H2O;ZHNS: ZrO2SiO2-NaOH-H2O
Note that data from the system ZrO2-SiO2-H2O are not shown because only two compositions at nearby temperatures were determined, and for those, there was
no discernible temperature effect (see also Fig.3)
See also text for detailed description and discussion of these equilibria
ZrO2-SiO2-NaOH-H2O fluid (Fig. 2a). The difference in
FWHH in the spectra of NaOH+ SiO2-bearing and
SiO2-absent but NaOH-bearing compositions likely re-flects the formation of Si-OH linkages in systems with SiO2. This is because Si-OH linkage tends to shift the Raman bands assigned to the fundamental OH vibra-tions to a higher frequency than that of OH in pure H2O.
The Raman spectra of fluids and crystals in the low-frequency regime characteristically comprise one or more intensity envelopes between 300 and 800 cm−1 (Fig. 4). From the similar Raman spectra of fluid in the ZrO2-H2O and ZrO2-SiO2-H2O systems with two bands between 550 and 650 cm−1, it appears that the structure of dissolved Zr-containing complexes in those fluids re-sembles one another. These two bands also are at nearly the same frequency as the dominant bands of crystalline ZrO2at the same temperature and pressure. These latter spectral features resemble those of tetragonal ZrO2 in which the oxygen coordination number is 7 (Keramidas and White 1974, Smith and Newkirk 1965). However, Wilke et al. (2012) interpreted their Zr X-ray near-edge spectra (XANES) to be consistent with eightfold
coordinated Zr4+ in ZrO2-H2O solutions. The present Raman spectra of ZrO2-H2O and ZrO2-SiO2-H2O fluids cannot be used to distinguish between Zr4+in seven- or eightfold coordination with oxygen with more precision than to state that the short-range structure of Zr4+ dis-solved in H2O resembles that of coexisting crystalline ZrO2. Fluids in the ZrO2-SiO2-H2O system also contain dissolved silicate. This is in the form of Qo, as evidenced by the strong band near 770 cm−1(Fig. 4; see also Zotov and Keppler 2002, Mibe et al. 2008).
assigned to vibrations in silicate tetrahedra in the struc-ture (e.g., the absence of the Qospecies with its diagnos-tic 770 cm−1band seen in the spectra of SiO2-H2O and ZrO2-SiO2-H2O fluids; see Fig. 4). In comparison with the Raman spectra of crystalline Zr-compounds, the spectrum of Na-zirconate Na2ZrO3characteristically has two strong bands near 500 cm−1 and a single strong
NaOH-H2O fluids coexisting with crystalline ZrO2likely forms zirconate complexes possibly with local structural similarity to crystalline zirconate. This structural inter-pretation also is consistent with published XANES and EXAFS (Extended X-ray Absorption Fine Structure) spectra of Zr-bearing Na-silicate aqueous fluids, where structures resembling zirconosilicates were proposed (Wilke et al. 2012, Louvel et al. 2013). Alkali zirconosilicate complexing also has been suggested for hydrous, peralka-line aluminosilicate melts (Watson 1979).
The composition control of how Zr4+ can form com-plexes with other solutes in an aqueous solution in aque-ous fluids shows some similarities with the behavior of Ti4+in aqueous fluids at similar temperatures and pres-sures. In the TiO2-H2O system, for example, the solubil-ity is in the ppm range under similar temperature and pressure conditions (e.g., Audetat and Keppler 2005), and the local structural environment resembles that of TiO2 with Ti4+ in sixfold coordination with oxygen (Mysen 2012). In Na-silicate-bearing solutions, on the other hand, the Ti4+solubility is several orders of magnitude greater (Antignano and Manning 2008), and Ti4+ is dissolved in aqueous fluid as TiO4- or TiO3-type complexes with Ti4+ attaining a coordination number near 4 (Mysen 2012).
Solubility
The zirconium concentration in a fluid in equilibrium with crystalline ZrO2 may be estimated by comparing the intensities of Raman bands from the fluid and from the crystalline ZrO2 recorded at the same temperature and pressure. In such a calculation, it is assumed that the integrated Raman intensity of spectra and fluid and melt are related to one another via the same correction factor because the local structure of the Zr complexes in such fluids resembles that of crystalline ZrO2at the same temperature and pressure. This approach to solubility de-termination is similar to that for Ti solubility in aqueous fluid in equilibrium with crystalline TiO2 (Mysen 2012) where Ti solubility determined in this manner compared well with values obtained by other methods (Audetat and Keppler 2005, Antignano and Manning 2008).
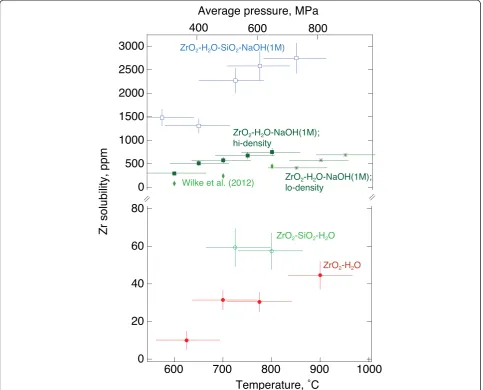
The Zr4+ concentration in ZrO2-H2O fluid ranges from ~10 ppm at 600 °C/60 MPa to about 40 ppm Zr at 900 °C and 560 MPa (Fig. 5). Two data points from the ZrO2-SiO2-H2O system at 725 °C/783 MPa and 800 °C/~1050 MPa indicate solubilities near 60 ppm or about 25 ppm higher than that in the absence of SiO2. This slightly higher solubility likely is because of the higher pressures in the experiments in the ZrO2-SiO2-H2O system because Zr4+solubility in aqueous fluids is positively correlated with pressure (Ayers et al. 2012, Wilke et al. 2012).
The Zr4+concentration in aqueous fluid is sensitive to alkali and alkali + silica content. For example, addition of
1 M NaOH to H2O raises the Zr4+content of the aque-ous fluid by approximately a factor of 10. Addition of SiO2 to NaOH-bearing systems increases the solubility by an additional factor of 5 or more (Fig. 5). Addition of Na-silicate component also results in major zircon (ZrSiO4) solubility increases (Ayers et al. 2012, Wilke et al. 2012). This feature may be analogous to the solution behavior of Zr4+in hydrous and peralkaline aluminosili-cate melt where the solubility is a positively correlated peralkalinity of the melt (Watson 1979). This concept would also be consistent with the XANES data on sili-cate glasses by Farges and Rossano (2000). We note, however, that addition of SiO2 to ZrO2-H2O without NaOH does not have significant influence on the Zr4+ solubility. The solubility increase with NaOH qualita-tively is similar to that reported elsewhere for zircon (ZrSiO4) and for ZrO2 solubility in aqueous fluid (e.g., Wilke et al. 2012). However, in order to quantitatively compare Zr4+ concentration in fluid equilibrated with ZrO2from the experiments by Wilke et al. (2012), their data were extrapolated linearly to the temperature/ pressure conditions of the present experiments. The resulting solubility compares well with the results re-ported here (Fig. 5).
Discussion
It has been suggested that pH is an important variable governing Zr solubility in aqueous fluid based on the positive correlation of Zr4+ solubility with NaOH con-centration in the fluid. The formation of hydroxylated Zr complexes such as Zr(OH)3+, Zr(OH)22+, Zr(OH)33+, Zr(OH)4, and Zr(OH)5− could then be an important mechanism by which Zr4+ can dissolve in aqueous fluid (e.g., Ayers et al. 2012). The interpretation of the Raman signals assigned to fundamental OH vibrations in the 3000–4100 cm−1 frequency range from fluids in the ZrO2-H2O and ZrO2-SiO2-H2O systems does not re-quire the existence of Zr-OH complexes in the fluids as there is no clear evidence for Zr-OH bonding in the spectra. However, crystalline Zr(OH)4exists, so one can-not rule out undetected OH-bearing Zr complexes. That caveat notwithstanding, for these simple ZrO2-H2O and ZrO2-SiO2-H2O systems, a simple solution mechanism is proposed:
ZrO2ðxtalÞ ¼ZrO2ðfluidÞ; ð1Þ
with the associated equilibrium constant:
Kð Þ1 ¼ mZrO2ðfluidÞ: ð2Þ
mZrO2¼
1− X
wt ZrO2•MH2O
MZrO2−ðXwtZrO2•MZrO2−XwtZrO2•MH2O
Xwt
ZrO2•MH2O
MZrO2−ðXwtZrO2•MZrO2−XwtZrO2•MH2O
0 B B @
1 C C A•55:56;
ð3Þ
where Msubscript denotes molecular weight of the sub-scripted entity, and Xwtsubscript is the corresponding weight fraction (in g ZrO2/kg H2O) that was derived from the Raman spectra as discussed above.
The temperature-dependent equilibrium constant,
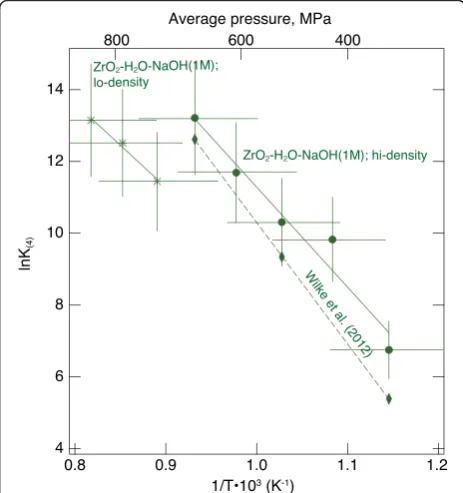
K(1), (Fig. 6), yields ΔH = 43 ± 16 kJ/mol (Tables 2 and 3). In these (and succeeding) calculations, it is assumed that the pressure change associated with
changing temperature is not a factor. In other words, the ΔV values of the equilibrium reactions are con-sidered negligible.
The Zr4+ solubility behavior in the ZrO2-SiO2-H2O system appears similar to that in the ZrO2-H2O (Fig. 5). However, only two data points (at 725 and 800 °C) were obtained for the ZrO2-SiO2-H2O system, and these were within 75 °C of each other because a Raman signal above background noise could be detected at lower tempera-tures. No clear temperature-dependence could be dis-cerned. Given the data uncertainty, ΔH for reaction (1) in the ZrO2-SiO2-H2O system could not be obtained, but with the similar solubility in fluid in the two sys-tems, the Zr4+ solution mechanism and its energetics likely also are similar.
Addition of 1 M NaOH to the aqueous solution results in a Zr4+solubility increase of approximately an order of magnitude compared with the NaOH-free solution (Fig. 5). This positive correlation between solubility and NaOH concentration of the fluid was why Ayers et al. (2012) suggested that Zr4+ dissolved as hydroxylated Zr complexes. However, enhanced solubility could just as easily be ascribed to zirconate complexing. Na-zirconate type of complexing is consistent with the available XANES data (Louvel et al. 2013). It is also con-sistent with the Raman spectra of solutions and crystalline Na-zirconate discussed above (Fig. 4).
Detailed stoichiometry of the zirconate complex(es) cannot be inferred from existing data. The simplest pos-sible zirconate group is ZrO44−so that a complex resem-bling Na4ZrO4 could be considered. The solution mechanism then can be described with the expression:
ZrO2þ4NaOH ¼ Na4ZrO4þ2H2O; ð4Þ
with the equilibrium constant:
Kð Þ4a ¼mNa4ZrO4• fH2O
2
mNaOH
ð Þ2 : ð5Þ
In equilibrium with pure ZrO2, the ZrO2 activity equals unity. The molality of NaOH also equals 1 so that Eq. (5) reduces to:
Kð Þ4 ¼mNa4ZrO4• fH2O
2
: ð6Þ
The mNa4ZrO4 is calculated from the solubility weight
fraction of Na4ZrO4 by substituting MNa4ZrO4 and
Xwt
Na4ZrO4forMZrO2andX
wt
ZrO2 in Eq. (3).
The regression of lnK(4)vs. 1/T for the ZrO2 -NaOH-H2O fluids is divided into high density and low density (Fig. 6) because the three highest temperature data points for this composition were recorded at a lower pressure as the result of extensive deformation of the sample hole of the Ir gasket (see also Table 1 and Fig. 1). The linear slope of these two curves does agree within error with theΔH value derived from this temperature-dependence between 195 ± 24 kJ/mol and 232 ± 29 kJ/ mol (Fig. 7; Tables 2 and 3). There is, however, an offset of the solubility axis of that figure, which likely reflects the positive correlation of solubility with pressure at any temperature. TheK(4)values calculated from the experi-mental data for ZrO2-NaOH-H2O from Wilke et al. (2012) in the same temperature and pressure range fall nearly within the range of the present data (Fig. 7) with a slightly higher ΔH value (282 kJ/mol; see Tables 2 and 3). It is somewhat difficult to establish the error for those latter data because of the way they were ex-tracted from Wilke et al. (2012) by interpolation and
Fig. 7Temperature-dependence of the equilibrium constant,K(4), for equilibrium (4) for the compositions indicated. Regression coefficients are shown in Tables 2 and 3. Average pressure is that calculated from the regression line in Fig. 2. For actual pressure, see Table 1.Horizontal error barsrepresent calculated pressure uncertainty (±110 MPa; see text) Fig. 6Temperature-dependence of the equilibrium constant,K(1), for
extrapolation of data obtained at different pressure than those of the present experiments.
The differences in the spectral topology of fluids below 800 cm−1in (Fig. 4) suggest a different structural behav-ior of Zr4+ in the ZrO2-NaOH-H2O and ZrO2-SiO2 -NaOH-H2O fluids. The 3000–4100 cm−1intensity enve-lope also indicates structural differences where at any temperature the FWHH is considerably smaller in spec-tra of fluids in the ZrO2-SiO2-NaOH-H2O system
com-pared with those in the ZrO2-NaOH-H2O system
(Fig. 3). Such narrowing of the Raman band would be consistent with fundamental OH vibrations from OH groups forming Si-OH bonds perhaps linked to Qo spe-cies (SiO4 groups). However, the lack of a detectable 770 cm−1band, which is assignable to protonated ortho-silicate (SiO4) groups (e.g., Mibe et al., 2008), makes that possibility less likely. An Si-OH linkage could, neverthe-less, exist as a part a zirconosilicate complex in the fluid. This latter suggestion would be consistent with the EXAFS- and XANES-based structural interpretation of fluids in alkali silicate zirconate environments (Wilke et al. 2012, Louvel et al. 2013).
From existing X-ray data and the Raman data reported here, a number of reactions involving zirconosilicate or separate silicate and zirconate complexes could be con-sidered. These possibilities include, but are not unique, an expression such as:
2ZrO2þ2NaOHþ2SiO2¼Na2Zr2Si2O9þH2O: ð7Þ
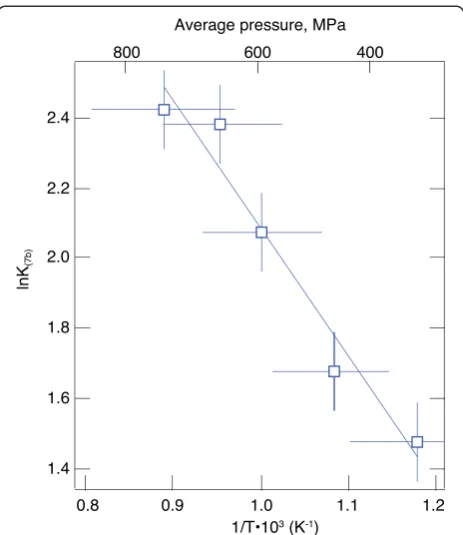
Given the interpretation of the high-frequency enve-lope of the fluids in ZrO2-SiO2-NaOH-H2O suggesting some Si-OH bonding, it is possible that a portion of Na+- in Na2Zr2Si2O9 might be replaced with H+, which leads to a possible modification of Eq. (7);
2ZrO2þNaOHþ2SiO2¼NaZr2Si2O8ðOHÞ þH2O; ð7bÞ
with the equilibrium constant:
Kð Þ7b ¼ mNaZr2Si2O8ðOHÞ
aZrO2
ð Þ2• a SiO2
ð Þ2•m NaOH
: ð8Þ
In Eq. (8), the activity of SiO2 and ZrO2 equals 1 as these are pure crystalline phases. The mNaOH also equals 1. Therefore, K(7b)can be simplified to:
Kð Þ7b ¼mNaZr2Si2O8ðOHÞ: ð8bÞ
From the temperature-dependentK(7b),ΔH is 30 ± 4 kJ/ mol (Fig. 8; Tables 2 and 3). In other words, the Zr solubility is less temperature-dependent than fluids in SiO2-free environments.
Conclusions
The experimental Zr4+ solubility data for water-rich fluids as a function of other solutes illustrate how an es-sentially insoluble high field strength cation such as Zr4+ can be made quite soluble in aqueous fluid under deep crustal and upper mantle temperature and pressure con-ditions through the stabilization of zirconate complexes that incorporate other solutes. This conclusion implies, for example, that fluid released during high-temperature dehydration of hydrous mineral assemblages such as those of oceanic crust descending into the upper mantle in subduction zones may carry significant (perhaps thou-sands of ppm) Zr and likely other HFSEs. Such fluids will alter the environment through which they migrate. This is consistent with natural evidence for Zr4+ trans-port such as that observed in veins in high-grade meta-morphic eclogite and granulite (e.g., Philippot and Selverstone 1991, Möller et al. 2002). Moreover, aqueous fluids transported from dehydrating oceanic crust can also carry this signature to the source rock of partial melting. These processes may have been operational through for at least the last 2 billion years of the Earth’s history where subduction resembling that observed today was operational. Fluid-mediated HFSE transport likely also occurred earlier in the Earth’s history, but those transport mechanisms are less certain.
Abbreviations
ΔH:change of enthalpy;ΔV: change of volume; CCD: charge-coupled detector; FWHH: full width at half height; HDAC: hydrothermal diamond anvil cell; HFSE: high field strength element; NSF: National Science Foundation; XANES: X-ray near-edge spectroscopy.
Competing interests
The author declares that he/she has no competing interests.
Acknowledgements
Support from NSF grant EAR-1212754 made this research possible. The W. M. Keck Foundation supported acquisition of analytical instruments used. The carbon-13 diamonds were produced by Mr. J. Lai. His assistance is gratefully acknowledged. All data used in this manuscript are available from the author upon request.
Received: 18 June 2015 Accepted: 29 October 2015
References
Ampian SG. X-ray and optical crystallographic data for Na2ZrO3. J Am Ceram Soc. 1968;51:607–8.
Antignano A, Manning CE. Rutile solubility in H2O, H2O–SiO2, and H2O-NaAlSi3O8 fluids at 0.7-2.0 GPa and 700–1000 °C; implications for mobility of nominally insoluble elements. Chem Geol. 2008;255:283–93.
Audetat A, Keppler H. Solubility of rutile in subduction zone fluids, as determined by experiments in the hydrothermal diamond anvil cell. Earth Planet Sci Lett. 2005;232:393–402.
Ayers JC, Watson EB. Rutile solubility and mobility in supercritical aqueous fluids. Contrib Mineral Petrol. 1993;112:321–30.
Ayers JC, Zhang L, Luo Y, Peters TJ. Zircon solubility in alkaline aqueous fluids at upper crustal conditions. Geochim Cosmochim Acta. 2012;96:18–28. Bassett WA, Wu T-C, Chou I-M, Haselton T, Frantz JD, Mysen BO. The
hydrothermal diamond anvil cell (DAC) and its applications. In: Dyar MD, McCammon CA, Schaefer M, editors. Mineral spectroscopy: a tribute to Roger G. Burns. Houston: The Geochemical Society; 1996. p. 261–72.
Bebout GE. Metamorphic chemical dynamics of subduction zones. Earth Planet Sci Lett. 2007;260:905–20.
Bernini D, Audetat A, Dolejs D, Keppler H. Zircon solubility in aqueous fluids at high temperatures and pressures. Geochim Cosmochim Acta. 2013;119:178–87. Brenan JM, Shaw HF, Phinney DL, Ryerson RJ. Rutile-aqueous fluid partitioning of
Nb, Ta, Hf, Zr, U and Th: implications for high field strength element depletions in island-arc basalts. Earth Planet Sci Lett. 1994;128:327–39. Compston W, Pidgeon RT. Jack Hills, evidence of more very old detrital zircons in
Western Australia. Nature. 1986;321:766–9.
Dixit A, Majumder SB, Dobal PS, Katiyar RS, Bhalla AS. Phase transition studies of sol–gel deposited barium zirconate titanate thin films. Thin Solid Films. 2004;447–448:284–8.
Ellison AJ, Hess PC. Solution behavior of +4 cations in high silica melts; petrologic and geochemical implications. Contrib Mineral Petrol. 1986;94:343–51. Farges F, Rossano S. Water in Zr-bearing synthetic and natural glasses. Eur J
Mineral. 2000;12:1093–107.
Farges F, Ponader CW, Brown CW, Jr GE. Structural environments of incompatible elements in silicate glass/ melt systems: I. Zirconium at trace levels. Geochim Cosmochim Acta. 1991;55:1563–74.
Foustoukos DI, Mysen BO. D/H isotopic fractionation in the H2-H2O system at supercritical water conditions: composition and hydrogen bonding effects. Geochim Cosmochim Acta. 2012;86:88–102.
Frantz JD, Dubessy J, Mysen BO. An optical cell for Raman spectroscopic studies of supercritical fluids and its applications to the study of water to 500°C and 2000 bar. Chem Geol. 1993;106:9–26.
Galoisy L, Pelegrin E, Arrio ME, Ildefonse P, Calas G. Evidence for 6-coordinated zirconium in inactive nuclear waste glasses. J Am Ceram Soc. 1999;82:2219–24. Giere R. Zirconolite, allanite, and hoegbomite in a marble skarn from the Bergell contact aureole: implications for mobility of Ti, Zr, and REE. Contrib Mineral Petrol. 1986;93:459–70.
Gill JB. Orogenic andesites and plate tectonics. Berlin: Springer; 1981. p. 391. Hamilton W. Earth’s first two billion years - the era of internally mobile crust.
Geol Soc Am Mem. 2007;200:233–96. doi:10.1130/2007.1200(13).
Hanfland M, Syassen K, Fahy S, Louie SG, Cohen ML. Pressure-dependence of the first-order Raman mode in diamond. Phys Rev B. 1985;31:6896–9.
Hermann J, Spandler C, Hack A, Korsakov AV. Aqueous fluids and hydrous melts in high-pressure and ultra-high pressure rocks: implications for element transfer in subduction zones. Lithos. 2006;92:399–417.
Horita J. Hydrogen isotope analyses of natural waters using an H2-water
equilibration method: a special implication to brines. Chem Geol. 1988;72:89–94. Keramidas VG, White WB. Raman scattering study of the crystallization and phase
transformations of ZrO2. J Am Ceram Soc. 1974;57:22–4.
Kröner A, Layer PW. Crust formation and plate motion in the early archean. Science. 1992;256:1405–11.
Le Losq CR, Moretti R, Neuville DR. Water speciation in silicate melts investigated by Raman spectroscopy; implication for volcanic processes. Mineral Mag. 2011;75:1296.
Linnen RL, Keppler H. Melt composition control on Zr/Hf fractionation in magmatic processes. Geochim Cosmochim Acta. 2002;66:3293–302. Louvel M, Sanchez-Valle C, Malfait WJ, Testemale D, Hazemann J-L. Zr
complexation in high pressure fluids and silicate melts and implications for the mobilization of HFSE in subduction zones. Geochim Cosmochim Acta. 2013;104:281–99.
Manning CE. The solubility of quartz in H2O in the lower crust and upper mantle. Geochim Cosmochim Acta. 1994;58:4831–40.
Mibe K, Chou I-M, Bassett W A. In situ Raman spectroscopic investigation of the structure of subduction-zone fluids. J Geophys Res. 2008;
doi:10.1029/2007JB005179.
Mojzsis SJ, Harrison TM, Pidgeon RT. Mass transfer in the Earth’s mantle and crust is documented on rocks dating to the first few hundred million years of the Earth’s history. Nature. 2001;409:178–81.
Möller A, O’Brian PJ, Kennedy A, Kröner A. Polyphse zircon in ultrahigh-temperature granulites (Rogaland, SW. Norway): constraints from Pb diffusion in zircon. J Metamorph Geol. 2002;20:727–40.
Mysen BO. High-pressure/-temperature titanium solution mechanisms in silicate-saturated aqueous fluids and hydrous silicate melts. Am Mineral. 2012;97:1241–51. Mysen BO. Carbon speciation in silicate-C-O-H melt and fluid as a function of
redox conditions: an experimental study, in-situ to 1.7 GPa and 900 °C. Am Mineral. 2015;100:872–82.
Mysen BO, Virgo D. Volatiles in silicate melts at high pressure and temperature. 1. Interaction between OH groups and Si4+, Al3+, Ca2+, Na+and H+. Chem Geol. 1986;57:303–31.
Mysen BO, Yamashita S. Speciation of reduced C-O-H volatiles in coexisting fluids and silicate melts determined in-situ to ~1.4 GPa and 800 °C. Geochim Cosmochim Acta. 2010;74:4577–88.
Newton RC, Manning CE, Hanchar JM, Colasanti CV. Free energy of formation of zircon based on solubility measurements at high temperature and pressure. Am Mineral. 2010;95:52–8.
Pascal ML, Anderson GM. Speciation of Al, Si, and K in supercritical solutions: experimental study and interpretation. Geochim Cosmochim Acta. 1989;53:1843–56.
Philippot P, Selverstone J. Trace-element-rich brines ion eclogitic veins: implications for fluid composition and transport during subduction. Contrib Mineral Petrol. 1991;106:417–30.
Schiferl D, Nicol M, Zaug JM, Sharma SK, Cooney TF, Wang S-Y, et al. The diamond13C/12C isotope Raman pressure sensor system for high temperature/pressure diamond-anvil cells with reactive samples. J Appl Phys. 1997;82:3256–65.
Scholze H. Zur frage der unterschiedung zwischen H2O-molekulen und OH-gruppen in glasern und mineralen. Naturwissenschaften. 1960;47:226–7.
Smith DK, Newkirk HW. Crystal structure of baddeleyite (monoclinic ZrO2) and its relation to polymorphism of ZrO2. Acta Crystallogr A. 1965;18:983–91. Tatsumi Y, Eggins S. Subduction zone magmatism. Cambridge: Blackwell
Scientific Publications; 1995.
Valley JW, Lackey JS, Cavoisie AJ, Clenchenko CC, Spicuzza MJ, Basel MAS, et al. 4.4 billion years of crustal maturation: oxygen isotope ratios of magmatic zircon. Contrib Mineral Petrol. 2005;150:561–80.
Walrafen GE, Fisher MR, Hokmabadi MS, Yang W-H. Temperature dependence of the low- and high-frequency Raman scattering from liquid water. J Chem Phys. 1986;85:6970–82.
Walrafen GE, Yang W-H, Chu YC. Raman spectra from saturated water vapor to the supercritical fluid. J Chem Phys B. 1999;103:1332–8.
Watson EB. Two-liquid partition coefficients; experimental data and geochemical implications. Contrib Mineral Petrol. 1976;56:119–34.
Wilke M, Schmidt C, Dubrail J, Appel K, Borchert M, Kvashnina K, et al. Zircon solubility and zircon complexation in H2O+Na2O+SiO2±Al2O3fluids at high pressure and temperature. Earth Planet Sci Lett. 2012;349–350:15–25. Wyllie PJ, Sekine T. The formation of mantle phlogopite in subduction zone
hybridization. Contrib Mineral Petrol. 1982;79:375–80.
Zotov N, Keppler H. Silica speciation in aqueous fluids at high pressures and high temperatures. Chem Geol. 2002;184:71–82.
Submit your manuscript to a
journal and benefi t from:
7Convenient online submission
7Rigorous peer review
7Immediate publication on acceptance
7Open access: articles freely available online
7High visibility within the fi eld
7Retaining the copyright to your article