R E S E A R C H
Open Access
Normative reference ranges for
echocardiographic chamber dimensions in
a healthy Central European population:
results from the Czech post-MONICA survey
Josef Marek
1, Jean-Claude Lubanda
1, Renata Cifkova
1,2, Petr Kuchynka
1, Lubor Golan
1, Eduard Nemcek
1and
Ales Linhart
1*Abstract
Background:Normative reference values for echocardiographic chamber quantification are of great importance;
however, this can be challenging. Our aim was to derive these values including degrees of abnormality from a random Central European population sample with a homogeneous subset of healthy subjects.
Methods:We analysed echocardiograms obtained in a randomly selected population sample during the Czech
post-MONICA survey in 2007/2008. Overall, 1850 out of 2273 persons of the whole sample of three districts had adequate echocardiograms (81.4%). A healthy subgroup defined by the absence of known cardiovascular disease was used to define normal reference range limits (n= 575, median age 42 years [IQR 34–52], 57% females). The whole population sample with predefined percentile cut-offs was used to define degrees of abnormality.
Results:Left ventricular (LV) size tended to decrease with age, while LV mass increased with age in both males and females and in both the healthy and general populations. LV dimensions were larger in males, except for body surface area-indexed LV diameter. M-mode derived LV measurements were larger and LV mass higher compared to 2D measurements. Right ventricle basal dimension was larger in males.
Conclusions:Our study provides reference ranges for echocardiographic measurements obtained in a healthy
subgroup derived from an epidemiological study of a Central European population. Where feasible, degrees of abnormality are provided based on the whole population sample including patients with disease. Our data show that age, gender and measurement method significantly affect cardiac dimensions and function and should be always taken into account.
Keywords:Echocardiography, Left ventricular function, Left ventricular mass, Left ventricular end-diastolic dimension, Right ventricular function, Atrium
Introduction
Echocardiography is the most commonly used imaging method to evaluate cardiac structure and function [1]. Quantification of cardiac chamber dimensions and func-tion remains paramount to echocardiographic examin-ation, defining normal values is thus of great importance.
However, this can be challenging due to variations based on gender, age and specific populations. Indeed, recent data show substantial influences of ethnicity, gender and age, while only limited epidemiological data exist uniquely for Central European populations [2, 3]. Furthermore, with a healthy population, only normal reference limits can be reliably calculated. For defining degrees of abnor-mality, a true general population sample is advantageous [4,5]. Therefore, we aimed to define normal chamber di-mensions and function based on a randomly selected population sample in the Czech Republic.
© The Author(s). 2019Open AccessThis article is distributed under the terms of the Creative Commons Attribution 4.0 International License (http://creativecommons.org/licenses/by/4.0/), which permits unrestricted use, distribution, and reproduction in any medium, provided you give appropriate credit to the original author(s) and the source, provide a link to the Creative Commons license, and indicate if changes were made. The Creative Commons Public Domain Dedication waiver (http://creativecommons.org/publicdomain/zero/1.0/) applies to the data made available in this article, unless otherwise stated.
* Correspondence:[email protected]
12nd Department of Medicine–Department of Cardiovascular Medicine,
First Faculty of Medicine, Charles University and General University Hospital in Prague, U Nemocnice 2, 128 08 Praha 2, Czech Republic
Methods Study population
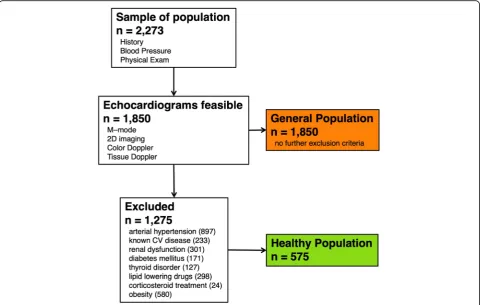
The Czech post-MONICA study is a population-based sur-vey assessing cardiovascular risk profile in a randomly se-lected sample of the Czech population. Detailed methods of the study have been described previously [6, 7]. Briefly, one-percent adult population samples stratified by age and gender were randomly selected from the general population of nine districts of the country. Selection was made using the General Health Insurance Company registry that keeps, by law, a list of people who are insured. Since health insur-ance is mandatory for Czech citizens, the registry covers the entire population. Echocardiographic examination was performed in three districts (Benesov, Pardubice, and city of Pilsen). The present analysis includes 1850 individuals (i.e. 81.4% of the entire screened population, n= 2273, within the three districts in 2007/2008) over 25 years of age in whom echocardiograms were available and these scans were used for subsequent analysis. The study was approved by the joint ethics committee of the Institute for Clinical and Experimental Medicine and Thomayer Hospital and was in accordance with the Declaration of Helsinki.
As Fig.1shows, the healthy cohort was defined as a subset of the general sample without obesity (BMI > 30 kg/m2),
arterial hypertension, known cardiovascular disease, renal dysfunction, diabetes mellitus, thyroid disorder, lipid-lowering or corticosteroid treatment. The healthy cohort included 575 selected patients. The total cohort consisted of all the recruited individuals irrespective of treatment or comorbidities.
Echocardiography
All studies were done using the GE Vivid 7 system (GE Healthcare, Chicago, Illinois, USA). Three measurements were taken for each parameter and averaged. All mea-surements were done according to the recommendations for ASE/EACVI chamber quantification unless otherwise specified [4] and were done in one centralized core la-boratory. Briefly, aortic root and left atrial (LA) diame-ters were measured from the parasternal long-axis view using M-mode and both measurements were performed using the leading edge to leading edge convention.
Left ventricular (LV) dimensions were measured first using 2D guided M-mode acquisition, with diameters measured according to the ASE convention [1]. The in-terventricular septum and posterior wall thickness and LV diastolic diameter were also measured with the 2D technique using the blood-myocardial interface. LV mass
Table 1Baseline characteristics
Variable Healthy subset
n= 575
Remaining cohort
n= 1275
pvalue
Age (years) 42 [34, 52] 58 [49, 65] < 0.001
Female gender, n (%) 328 (57%) 631 (49%) 0.003
BSA (m2) 1.82 [1.70, 1.99] 1.97 [1.82, 2.13] < 0.001
Weight (kg) 72 [62, 81] 86 [74, 98] < 0.001
Height (cm) 171 [165, 179] 171 [163, 177] 0.003
BMI (kg/m2) 24 [22, 26] 29 [26, 33] < 0.001
Systolic blood pressure (mmHg) 118 [109, 124] 132 [121, 144] < 0.001
Diastolic blood pressure (mmHg) 78 [72, 81] 83 [78, 90] < 0.001
History of CVD, n (%) 230 (18%)
Antihypertensive medication, n (%) 606 (48%)
Diabetes mellitus, n (%) 171 (13%)
Lipid-lowering drugs, n (%) 298 (23%)
Total serum cholesterol (mmol/l) 5.02 [4.42, 5.71] 5.25 [4.57, 5.92] < 0.001
Total serum triglycerides (mmol/l) 0.97 [0.73, 1.39] 1.39 [1.03, 2.02] < 0.001
HDL cholesterol (mmol/l) 1.51 [1.27, 1.76] 1.34 [1.10, 1.62] < 0.001
LDL cholesterol (mmol/l) 2.94 [2.37, 3.58] 3.05 [2.41, 3.65] 0.091
Age group (n) < 0.001
under 40 years 239 160
40–60 years 283 556
over 60 years 53 559
Continuous variables presented as median [25th, 75th percentile] BMIbody mass index,BSAbody surface area,CVDcardiovascular disease
was calculated using the modified Devereux formula, from both M-mode and 2D recordings as previously de-scribed [8].
LV volumes and ejection fraction were measured from the single plane apical four-chamber view using the Simpson rule. Left atrium (LA) volume was measured using the area-length method while vertical and horizon-tal dimensions of both atria were measured as perpen-dicular major and minor axes.
Right ventricular (RV) basal dimension was measured as the largest diameter in the basal third of the right ventricle in end-diastole. Tricuspid annular plane sys-tolic excursion (TAPSE) was measured from dedicated M-mode recordings.
Tissue Doppler recording was made on the septal and lateral sides of the mitral annulus and on the tricuspid
annulus using dedicated pulsed wave tissue Doppler ac-quisitions. Peak systolic velocity was denoted s’.
Statistical analysis
Continuous values are summarized using median with 25th to 75th percentile and categorical variables using proportions. The Mann-Whitney U test and Chi-square test were used to compare baseline variables and Wilcoxon signed-rank test to compare 2D and M-mode measure-ments. Reference values for normality and degrees of ab-normality were calculated using multivariate quantile regression with age and gender as predictors. Limit of nor-mality was defined as 5th or 95th percentile of the respect-ive value in the healthy subset. Gender specific cut-offs are provided for all variables and age-specific cut-offs are pre-sented in variables where the testing showed relevant age
Table 2Effects of age and gender on reference limits–left ventricle
Variable Age effect (per 10 years) Age effect
pvalue
Gender effect (male vs. female) Gender effect
pvalue Left ventricular dimensions
2D method
LV end-diastolic diameter (mm) −0.7 [−1.0,−0.3] 0.001 5.6 [4.3, 7.0] < 0.001
LV end-diastolic diameter, BSA (mm/m2) −0.4 [−0.8,−0.1] 0.021 −1.4 [−2.5,−0.4] 0.007
M-mode method
LV end-diastolic diameter (mm) 0.5 [−0.1, 1.2] 0.113 5.4 [4.0, 6.8] < 0.001
LV end-diastolic diameter, BSA (mm/m2) 0.3 [−0.1, 0.7] 0.107 −1.3 [−2.1,−0.4] 0.004
LV end-systolic diameter (mm) 0.7 [−0.2, 1.6] 0.114 4.1 [1.9, 6.2] < 0.001
LV end-systolic diameter, BSA (mm/m2) 0.4 [−0.1, 0.9] 0.109 −0.4 [−1.5, 0.7] 0.469
LV mass and wall thickness
2D method
Interventricular septum (mm) 0.5 [0.1, 0.8] 0.011 1.3 [0.4, 2.3] 0.004
LV Posterior wall (mm) 0.4 [0.2, 0.6] < 0.001 1.5 [1.0, 2.0] < 0.001
LV mass, BSA (g/m2) 4.2 [2.1, 6.4] < 0.001 23.5 [18.4, 28.6] < 0.001
M-mode method
Interventricular septum (mm) 0.6 [0.3, 0.9] < 0.001 1.7 [0.9, 2.5] < 0.001
LV Posterior wall (mm) 0.6 [0.4, 0.8] < 0.001 1.6 [1.1, 2.0] < 0.001
LV mass, BSA (g/m2) 7.1 [3.2, 11.1] < 0.001 22.6 [10.6, 34.5] < 0.001
LV mass, height2.7(g/m) 4.2 [2.2, 6.2] < 0.001 4.8 [−0.2, 9.8] 0.060
LV volumes and function
LV end-diastolic volume (ml) −6.6 [−10.0,−3.1] < 0.001 35.4 [25.1, 45.6] < 0.001
LV end-diastolic volume, BSA (ml/m2) −3.1 [−6.5, 0.4] 0.081 8.4 [0.9, 16.0] 0.029
LV end-systolic volume (ml) −3.6 [−5.0,−2.1] < 0.001 23.2 [19.4, 27.0] < 0.001
LV end-systolic volume, BSA (ml/m2) −2.1 [−3.5,−0.8] 0.002 6.4 [2.9, 9.9] < 0.001
LV ejection fraction (%) 1.4 [−0.1, 2.9] 0.059 −1.6 [−5.7, 2.6] 0.455
Mitral septal s’(cm/s) −0.2 [−0.4,−0.1] 0.001 −0.1 [−0.4, 0.3] 0.658
Mitral lateral s’(cm/s) −0.3 [−0.5,−0.1] 0.002 0.4 [−0.1, 0.8] 0.162
differences. We stratified degrees of abnormality using the whole population sample including both healthy and remaining patients. Cut-offs for moderate abnormality were 2.5th or 97.5th interval of thewholesample and severe ab-normality as 1st or 99th percentile of the whole sample. These differences are summarized in Fig.2. Nonparametric methods with quantile regression were preferred because of non-normal distribution of echocardiographic variables (Shapiro-Wilks testp< 0.001 for all echocardiographic var-iables for both healthy and general populations). Using cut-offs based on distribution of general population has been suggested previously [4,5]. Apvalue < 0.05 was considered significant. Analysis was done using R software version 3.0.2 (R Foundation for Statistical Computing, Vienna, Austria).
Results
Baseline variables
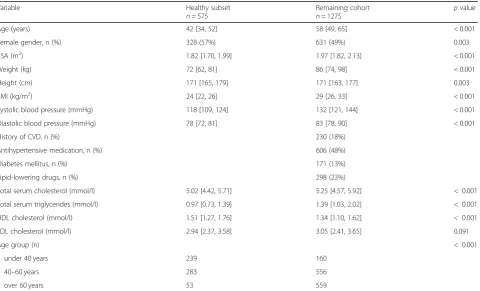
Overall, as Table 1 shows, the healthy cohort was on average younger, with a higher percentage of females and lower body weight, height, body surface area (BSA), body mass index (BMI), systolic and diastolic blood pressure. Healthy patients also had lower total choles-terol and triglycerides and higher HDL cholescholes-terol and showed a numeric trend towards lower LDL levels. All
patients in both subsets were Caucasians. The distribu-tion of BSA, height and weight according to age groups is shown in Additional file2: Table S9.
Effects of age, gender and measurement method
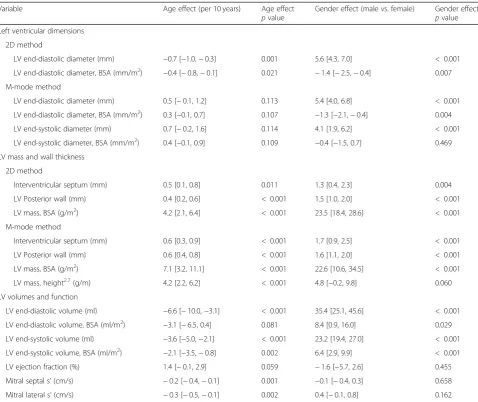
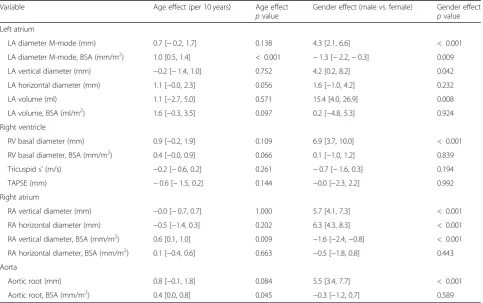
Tables 2 and 3 show the effects of gender and age on reference limits (the 5th or 95th percentile of healthy population). Values stratified by age and gender as well as effect of age and gender on median values are shown in Additional file 1: Tables S5 and S6, Additional file 2: Tables S7 and S8. Overall, there was a slight trend towards smaller LV size upper reference limits with in-creasing age. LV diameter upper reference limits de-creased with age when measured using the 2D method. End-diastolic and end-systolic volume upper reference limit overall decreased with age. Longitudinal LV systolic function lower reference limit measured by s’ signifi-cantly decreased. There was a strong tendency of LV mass and LV wall thickness upper reference limit to in-crease with age in the healthy cohort both using M-mode and 2D calculations and different indexations. There seemed to be an overall numeric trend towards enlargement of LA upper reference limit with age, sig-nificant in indexed LA diameter. Indexed right atrial
Table 3Effects of age and gender on reference limits–left atrium, right chambers, aorta
Variable Age effect (per 10 years) Age effect
pvalue
Gender effect (male vs. female) Gender effect
pvalue Left atrium
LA diameter M-mode (mm) 0.7 [−0.2, 1.7] 0.138 4.3 [2.1, 6.6] < 0.001
LA diameter M-mode, BSA (mm/m2) 1.0 [0.5, 1.4] < 0.001 −1.3 [−2.2,−0.3] 0.009
LA vertical diameter (mm) −0.2 [−1.4, 1.0] 0.752 4.2 [0.2, 8.2] 0.042
LA horizontal diameter (mm) 1.1 [−0.0, 2.3] 0.056 1.6 [−1.0, 4.2] 0.232
LA volume (ml) 1.1 [−2.7, 5.0] 0.571 15.4 [4.0, 26.9] 0.008
LA volume, BSA (ml/m2) 1.6 [−0.3, 3.5] 0.097 0.2 [−4.8, 5.3] 0.924
Right ventricle
RV basal diameter (mm) 0.9 [−0.2, 1.9] 0.109 6.9 [3.7, 10.0] < 0.001
RV basal diameter, BSA (mm/m2) 0.4 [−0.0, 0.9] 0.066 0.1 [−1.0, 1.2] 0.839
Tricuspid s’(m/s) −0.2 [−0.6, 0.2] 0.261 −0.7 [−1.6, 0.3] 0.194
TAPSE (mm) −0.6 [−1.5, 0.2] 0.144 −0.0 [−2.3, 2.2] 0.992
Right atrium
RA vertical diameter (mm) −0.0 [−0.7, 0.7] 1.000 5.7 [4.1, 7.3] < 0.001
RA horizontal diameter (mm) −0.5 [−1.4, 0.3] 0.202 6.3 [4.3, 8.3] < 0.001
RA vertical diameter, BSA (mm/m2) 0.6 [0.1, 1.0] 0.009 −1.6 [−2.4,−0.8] < 0.001
RA horizontal diameter, BSA (mm/m2) 0.1 [−0.4, 0.6] 0.663 −0.5 [−1.8, 0.8] 0.443
Aorta
Aortic root (mm) 0.8 [−0.1, 1.8] 0.084 5.5 [3.4, 7.7] < 0.001
Aortic root, BSA (mm/m2) 0.4 [0.0, 0.8] 0.045 −0.3 [−1.2, 0.7] 0.589
vertical dimension and indexed aortic root diameter upper reference limits increased significantly with age.
LV diameter reference limits were larger in males, but this finding was completely reversed when indexed for BSA. In contrast, both end-systolic and end-diastolic LV volumes limits remained larger in males despite index-ation. LV mass upper reference limit was also larger in males. Males had a significantly larger non-indexed RV basal diameter upper reference limit by over 6 mm, a trend that disappeared after BSA indexation to BSA.
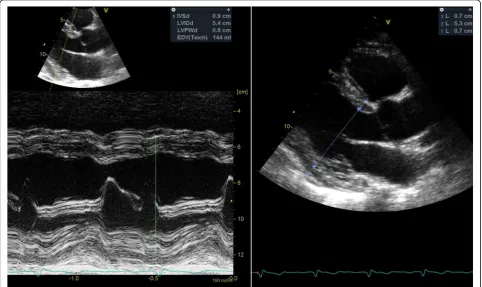
Overall, M-mode derived LV linear measurements were significantly larger compared to their 2D counter-parts (p< 0.001 for all comparisons). An example of such discrepancy is shown in Fig. 3. Furthermore, BSA-indexed LV mass using M-mode was significantly higher compared to the 2D method (p< 0.001).
Estimated cut-off values
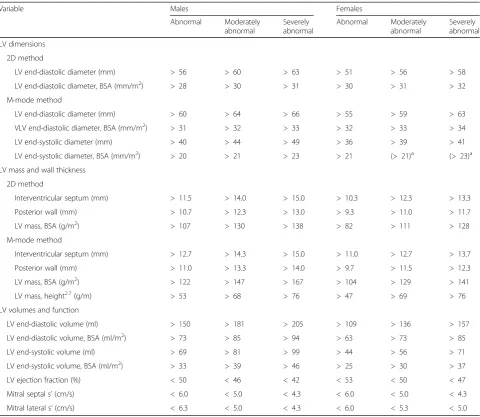
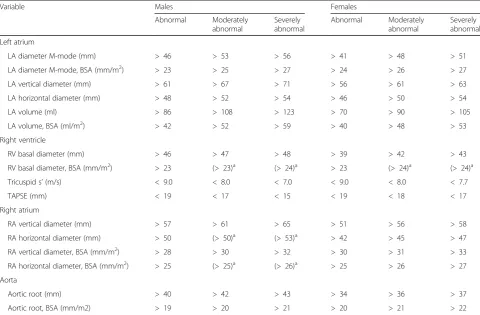
General reference values for normality irrespective of age are shown in Tables 4 and 5 separated by gender. For variables significantly affected by age, we provide further age-related cut-offs in Additional file 1: Tables S1-S4. Parametric summaries including stratification by
age and gender are included in Additional file 1: Tables S5 and S6, Additional file2: Tables S7 and S8. As for LV mass and LA volume, distributions with reference limits are shown in Additional file1: Figure S1 to give a clearer visual idea of their distribution. Furthermore, for LV mass, Additional file1: Figure S2 summarizes differences due to age, gender, measurement technique and popula-tion subset.
Discussion
In our study, we calculated reference limits for chamber dimensions and systolic function of the left and right ventricles using a pre-specified healthy subset from a population-wide epidemiological survey. Furthermore, data from our unselected general population sample allowed us to propose cut-offs for mild, moderate and significant abnormality, based on the approach using predefined percentiles and unselected population sample [4, 5]. The major strengths of our study are the homo-geneity of the studied population, which was randomly selected and is considered representative of the Czech population, and analysis performed by skilled operators trained to use a standardized measurement technique.
Relation of normal values to age
We used age-specific subgrouping in selected variables. This is consistent with current studies reporting normal values [2, 9]. Previously, age was intentionally not in-cluded in some analyses due to the uncertainty whether these effects represent true physiological aging [5]. However, a significant age effect was observed for sev-eral measurements in our and previous studies of nor-mal populations [9–12]. Not correcting for age would lead to a large proportion of older patients without any apparent cardiovascular disease to fall outside the nor-mal reference range.
Reference limits for degrees of abnormality
Although several recent studies have defined the upper reference limits for many echocardiographic parameters [2, 9, 10], studies defining degrees of abnormality above this range are scarce [5]. In the absence of long-term prognostic data, a sample of the general population in-cluding patients with disease and using predefined percen-tiles is one of the possible approaches [4]. In our study, we had a general population sample, which allowed us to propose cut-offs using this methodology. These cut-offs are most relevant in variables where disease is prevalent in the general population, as is LV mass due to arterial
Table 4Reference limits for left ventricular measurements
Variable Males Females
Abnormal Moderately abnormal
Severely abnormal
Abnormal Moderately abnormal
Severely abnormal
LV dimensions
2D method
LV end-diastolic diameter (mm) > 56 > 60 > 63 > 51 > 56 > 58
LV end-diastolic diameter, BSA (mm/m2) > 28 > 30 > 31 > 30 > 31 > 32
M-mode method
LV end-diastolic diameter (mm) > 60 > 64 > 66 > 55 > 59 > 63
VLV end-diastolic diameter, BSA (mm/m2) > 31 > 32 > 33 > 32 > 33 > 34
LV end-systolic diameter (mm) > 40 > 44 > 49 > 36 > 39 > 41
LV end-systolic diameter, BSA (mm/m2) > 20 > 21 > 23 > 21 (> 21)a (> 23)a
LV mass and wall thickness
2D method
Interventricular septum (mm) > 11.5 > 14.0 > 15.0 > 10.3 > 12.3 > 13.3
Posterior wall (mm) > 10.7 > 12.3 > 13.0 > 9.3 > 11.0 > 11.7
LV mass, BSA (g/m2) > 107 > 130 > 138 > 82 > 111 > 128
M-mode method
Interventricular septum (mm) > 12.7 > 14.3 > 15.0 > 11.0 > 12.7 > 13.7
Posterior wall (mm) > 11.0 > 13.3 > 14.0 > 9.7 > 11.5 > 12.3
LV mass, BSA (g/m2) > 122 > 147 > 167 > 104 > 129 > 141
LV mass, height2.7(g/m) > 53 > 68 > 76 > 47 > 69 > 76
LV volumes and function
LV end-diastolic volume (ml) > 150 > 181 > 205 > 109 > 136 > 157
LV end-diastolic volume, BSA (ml/m2) > 73 > 85 > 94 > 63 > 73 > 85
LV end-systolic volume (ml) > 69 > 81 > 99 > 44 > 56 > 71
LV end-systolic volume, BSA (ml/m2) > 33 > 39 > 46 > 25 > 30 > 37
LV ejection fraction (%) < 50 < 46 < 42 < 53 < 50 < 47
Mitral septal s’(cm/s) < 6.0 < 5.0 < 4.3 < 6.0 < 5.0 < 4.3
Mitral lateral s’(cm/s) < 6.3 < 5.0 < 4.3 < 6.0 < 5.3 < 5.0
Mildly abnormal is defined as >95th or < 5th percentile of the healthy subset, moderately abnormal as > 97.5th or < 2.5th percentile and severely abnormal as >99th or < 1st percentile of the whole sample
BSAbody surface area,LVleft ventricle
a
hypertension. In these instances, degrees of abnormality can provide a sense of how extreme abnormal values are in a similar sense to degrees of abnormality provided in EACVI/ASE guidelines, which in some cases rely on multiples of standard deviation [1]. In other cases, low prevalence of disease in the general population makes dif-ference between healthy and general populations negli-gible and these cut-offs only hypothesis-generating.
For some variables, most notably for LV ejection frac-tion and LA volume, cut-offs based on prognosis are well established and probably more useful [13,14].
LV dimensions, mass and wall thickness
We found similar cut-offs for both indexed and non-indexed LV end-diastolic dimensions compared to current recommendations [15]. Interestingly, our study shows a clinically relevant overestimation of dimension and wall thickness using M-mode imaging compared to the 2D method. This is an intriguing finding conflicting with some previous reports [16]. It is most strikingly shown in our LV mass measurement, where our M-mode derived cut-offs were higher than the currently recommended cut-off values (95 and 115 g/m2for men
and women, respectively) by almost 10 g/m2, while the 2D-derived limits were lower to a similar extent [15]. This can be visually appreciated in Additional file 1: Figures S1 and S2 and underscores the critical need to consider the measurement technique when evaluating LV mass. To the best of our knowledge, our study is the first to identify separate cut-offs for M-mode and 2D-derived LV mass derived from data obtained in such a large population sample. Furthermore, cut-offs for LV mass values significantly increased with age in our population, along with wall thickness. This trend has been shown in previous studies for both mass [9,10] and wall thickness [10,11]. Whether this phenomenon repre-sents a genuine effect of aging or confounding by other factors associated with increasing age is impossible to differentiate based on our data [17].
LV volumes and systolic function
Our LV volume cut-offs in apical views are similar to the current recommendations [1]. Ejection fraction cut-off was slightly lower than previously reported, but the known trend towards higher EF in females was numeric-ally present in our population. Longitudinal systolic
Table 5Reference limits for left atrium, right chambers and aorta
Variable Males Females
Abnormal Moderately abnormal
Severely abnormal
Abnormal Moderately abnormal
Severely abnormal
Left atrium
LA diameter M-mode (mm) > 46 > 53 > 56 > 41 > 48 > 51
LA diameter M-mode, BSA (mm/m2) > 23 > 25 > 27 > 24 > 26 > 27
LA vertical diameter (mm) > 61 > 67 > 71 > 56 > 61 > 63
LA horizontal diameter (mm) > 48 > 52 > 54 > 46 > 50 > 54
LA volume (ml) > 86 > 108 > 123 > 70 > 90 > 105
LA volume, BSA (ml/m2) > 42 > 52 > 59 > 40 > 48 > 53
Right ventricle
RV basal diameter (mm) > 46 > 47 > 48 > 39 > 42 > 43
RV basal diameter, BSA (mm/m2) > 23 (> 23)a (> 24)a > 23 (> 24)a (> 24)a
Tricuspid s’(m/s) < 9.0 < 8.0 < 7.0 < 9.0 < 8.0 < 7.7
TAPSE (mm) < 19 < 17 < 15 < 19 < 18 < 17
Right atrium
RA vertical diameter (mm) > 57 > 61 > 65 > 51 > 56 > 58
RA horizontal diameter (mm) > 50 (> 50)a (> 53)a > 42 > 45 > 47
RA vertical diameter, BSA (mm/m2) > 28 > 30 > 32 > 30 > 31 > 33
RA horizontal diameter, BSA (mm/m2) > 25 (> 25)a (> 26)a > 25 > 26 > 27
Aorta
Aortic root (mm) > 40 > 42 > 43 > 34 > 36 > 37
Aortic root, BSA (mm/m2) > 19 > 20 > 21 > 20 > 21 > 22
Mildly abnormal is defined as >95th or < 5th percentile of the healthy subset, moderately abnormal as > 97.5th or < 2.5th percentile and severely abnormal as >99th or < 1st percentile of the whole sample
BSAbody surface area,LAleft atrium,RAright atrium,RVright ventricle,TAPSEtricuspid annular systolic plane excursion
a
function assessed by s’ is in general consistent with values presented previously [18].
LA volume, RV diameter and function
Left atrial volume reference limits were higher than the commonly accepted limit of 34 ml/m2 [4]. Epidemio-logical method of sampling our population could lead to these larger reference limits. Interestingly, our results are quite comparable to the more recently published NORRE data, that have shown an upper reference limit of 40.3 ml/m2for both genders using the same method-ology [9].
Right ventricular basal dimension was strongly dependent on gender, a significant difference not highlighted in the current recommendations, but shown in recent population studies [9,10]. Interestingly, indexation to BSA was able to abolish this difference and a cut-off value of 23 mm/m2 seems reasonable as a sex-independent upper reference limit. A lower reference limit for TAPSE in our population was slightly higher than previously reported. Indexed right atrial diameters seemed comparable to previous recom-mendations [4].
Limitations
A significant limitation of our study is the absence of deformation indices. Despite that, routine chamber evaluation is still often done using relatively simple tech-niques described in our paper.
Another limitation is that defining degrees of ab-normality based on percentiles of the general popula-tion is mostly relevant when prevalence of pathology is sufficient in the general population, as is the case for LV mass. When there is a small number of pa-tients with disease, we observed small to no differ-ences in cut-offs differentiating mild, moderate and severe abnormality, especially in young patients where overall cardiovascular disease prevalence is low. In these cases, these limits should be used carefully, if at all. To address this issue, wherever the degrees of ab-normality are too small and converged, we have re-ported that in the Result tables. Furthermore, absence of prognostic data is a limitation based on design of the Czech post-MONICA survey; however, a cross-sectional design is an established methodology for de-riving normative values [15].
Simple indexing by BSA might be considered a limita-tion. However, it is the most commonly used indexation in echocardiography. Further analysis of anthropometric relations was beyond the scope of this manuscript.
Conclusions
This analysis reports echocardiographic reference values for chamber dimensions and ventricular systolic function gained from the population-based Czech post-MONICA
study, providing unique normative ranges applicable to Central European populations. The age and gender de-pendence of echocardiographic variables is described, as well as differences between M-mode and 2D imaging. Furthermore, cut-offs for mild, moderate and severe ab-normalities based on percentiles of the general popula-tion are provided where feasible.
Supplementary information
Supplementary informationaccompanies this paper athttps://doi.org/10. 1186/s12947-019-0172-0.
Additional file 1: Figure S1.Shows distribution of LV mass (both using M-mode and 2D imaging) and indexed LA volume distribution in both healthy and general cohort. It can be seen that distributions of most vari-ables are significantly skewed. Furthermore, reference limits based on 95th percentile of normal population and 97.5th and 99th percentile of general populations are shown with points and annotated with values. Horizontal axis has been truncated at 150% of the 99th percentile of gen-eral population. Gaussian kernel density estimates are used for plotting. BSA, body surface area; LV, left ventricle.Figure S2.Showing distribution of indexed LV mass using different measurement methods by age and gender. Reference limits based on gender and age derived from quantile regression are shown. Severe abnormality is above 99th percentile of general population, moderate 97.5th–99th percentile of general popula-tion and mild between 95th percentile of the healthy populapopula-tion and 97.5th percentile of general population. One female outlier from general population with LV mass over 250 g was excluded from the plotting but is included in the analyses. BSA, body surface area; LV, left ventricle.Table S1.Female reference limits by age - left ventricle.Table S2.Female refer-ence limits by age–atria and aortic root.Table S3.Male reference limits by age–left ventricle.Table S4.Male reference limits by age–atria and aortic root.Table S5.Echocardiographic parameters for healthy popula-tion–left ventricle.Table S6.Echocardiographic parameters for healthy population–left atrium, right chambers and aorta.
Additional file 2: Table S7.Echocardiographic parameters for healthy population by gender and age–left ventricle.Table S8.
Echocardiographic parameters for healthy population by gender and age –left atrium, right chambers and aorta.Table S9.Anthropometric variables for healthy population by age and gender.
Abbreviations
BMI:Body mass index; BSA: Body surface area; LA: Left atrium; LV: Left ventricle; RV: Right ventricle; TAPSE: Tricuspid annular plane systolic excursion
Acknowledgments Not applicable.
Authors’contributions
RC and AL conceived the overall design of the study and supervised both analysis of the data and writing of the manuscript. JCL, PK, LG and EN performed the measurements, collected the data and aided in writing the manuscript. JM performed the measurements, collected and analyzed the data, and wrote the manuscript. All authors read and approved the final manuscript.
Funding
The study was supported by grant No. 15-27109A (provided by the Ministry of Health of the Czech Republic) and by PROGRES Q38/LF1 (an institutional research funding project of Charles University, Prague, Czech Republic).
Availability of data and materials
Ethics approval and consent to participate
All participants signed informed consent and the study was approved by the joint ethics committee of the Institute for Clinical and Experimental Medicine and Thomayer Hospital, Prague and was in accordance with the Declaration of Helsinki.
Consent for publication
Not applicable–no individual patient data presented.
Competing interests
The authors declare that they have no competing interests.
Author details 1
2nd Department of Medicine–Department of Cardiovascular Medicine, First Faculty of Medicine, Charles University and General University Hospital in Prague, U Nemocnice 2, 128 08 Praha 2, Czech Republic.2Center for
Cardiovascular Prevention, First Faculty of Medicine, Charles University in Prague and Thomayer Hospital, Prague, Czech Republic.
Received: 8 July 2019 Accepted: 4 October 2019
References
1. Lang RM, Badano LP, Mor-Avi V, Afilalo J, Armstrong A, Ernande L, Flachskampf FA, Foster E, Goldstein SA, Kuznetsova T, Lancellotti P, Muraru D, Picard MH, Rietzschel ER, Rudski L, Spencer KT, Tsang W, Voigt JU. Recommendations for cardiac chamber quantification by echocardiography in adults: an update from the American Society of Echocardiography and the European Association of Cardiovascular Imaging. J Am Soc Echocardiogr. 2015;28:1–39 e14.
2. EchoNoRMAL Collaboration. Ethnic-specific normative reference values for echocardiographic LA and LV size, LV mass, and systolic function: the EchoNoRMAL study. JACC Cardiovasc Imaging. 2015;8:656–65.
3. Poppe KK, Bachmann ME, Triggs CM, Doughty RN, Whalley GA. Geographic variation in left ventricular mass and mass index: a systematic review. J Hum Hypertens. 2012;26:420–9.
4. Lang RM, Bierig M, Devereux RB, Flachskampf FA, Foster E, Pellikka PA, Picard MH, Roman MJ, Seward J, Shanewise JS, Solomon SD, Spencer KT, Sutton MS, Stewart WJ. Recommendations for chamber quantification: a report from the American Society of Echocardiography’s Guidelines and Standards Committee and the Chamber Quantification Writing Group. J Am Soc Echocardiogr. 2005;18:1440–63.
5. Vasan RS, Larson MG, Levy D, Evans JC, Benjamin EJ. Distribution and categorization of echocardiographic measurements in relation to reference limits: the Framingham Heart Study: formulation of a height- and sex-specific classification and its prospective validation. Circulation. 1997;96: 1863–73.
6. Cifkova R, Skodova Z, Bruthans J, Adamkova V, Jozifova M, Galovcova M, Wohlfahrt P, Krajcoviechova A, Poledne R, Stavek P, Lanska V. Longitudinal trends in major cardiovascular risk factors in the Czech population between 1985 and 2007/8. Czech MONICA and Czech post-MONICA. Atherosclerosis. 2010;211:676–81.
7. Cifkova R, Skodova Z, Bruthans J, Holub J, Adamkova V, Jozifova M, Galovcova M, Wohlfahrt P, Krajcoviechova A, Petrzilkova Z, Lanska V. Longitudinal trends in cardiovascular mortality and blood pressure levels, prevalence, awareness, treatment, and control of hypertension in the Czech population from 1985 to 2007/2008. J Hypertens. 2010;28:2196–203. 8. Devereux RB, Alonso DR, Lutas EM, Gottlieb GJ, Campo E, Sachs I, Reichek N.
Echocardiographic assessment of left ventricular hypertrophy: comparison to necropsy findings. Am J Cardiol. 1986;57:450–8.
9. Kou S, Caballero L, Dulgheru R, Voilliot D, De Sousa C, Kacharava G, Athanassopoulos GD, Barone D, Baroni M, Cardim N, Gomez De Diego JJ, Hagendorff A, Henri C, Hristova K, Lopez T, Magne J, De La Morena G, Popescu BA, Penicka M, Ozyigit T, Rodrigo Carbonero JD, Salustri A, Van De Veire N, Von Bardeleben RS, Vinereanu D, Voigt JU, Zamorano JL, Donal E, Lang RM, Badano LP, Lancellotti P. Echocardiographic reference ranges for normal cardiac chamber size: results from the NORRE study. Eur Heart J Cardiovasc Imaging. 2014;15:680–90.
10. Daimon M, Watanabe H, Abe Y, Hirata K, Hozumi T, Ishii K, Ito H, Iwakura K, Izumi C, Matsuzaki M, Minagoe S, Abe H, Murata K, Nakatani S, Negishi K, Yoshida K, Tanabe K, Tanaka N, Tokai K, Yoshikawa J. Normal values of
echocardiographic parameters in relation to age in a healthy Japanese population: the JAMP study. Circ J. 2008;72:1859–66.
11. Pfaffenberger S, Bartko P, Graf A, Pernicka E, Babayev J, Lolic E, Bonderman D, Baumgartner H, Maurer G, Mascherbauer J. Size matters! Impact of age, sex, height, and weight on the normal heart size. Circ Cardiovasc Imaging. 2013;6:1073–9.
12. Vasan RS, Larson MG, Benjamin EJ, Levy D. Echocardiographic reference values for aortic root size: the Framingham Heart Study. J Am Soc Echocardiogr. 1995;8:793–800.
13. Benjamin EJ, D'Agostino RB, Belanger AJ, Wolf PA, Levy D. Left atrial size and the risk of stroke and death. The Framingham Heart Study. Circulation. 1995;92:835–41.
14. Yeboah J, Rodriguez CJ, Stacey B, Lima JA, Liu S, Carr JJ, Hundley WG, Herrington DM. Prognosis of individuals with asymptomatic left ventricular systolic dysfunction in the multi-ethnic study of atherosclerosis (MESA). Circulation. 2012;126:2713–9.
15. Lang RM, Badano LP, Mor-Avi V, Afilalo J, Armstrong A, Ernande L, Flachskampf FA, Foster E, Goldstein SA, Kuznetsova T, Lancellotti P, Muraru D, Picard MH, Rietzschel ER, Rudski L, Spencer KT, Tsang W, Voigt JU. Recommendations for cardiac chamber quantification by echocardiography in adults: an update from the American Society of Echocardiography and the European Association of Cardiovascular Imaging. Eur Heart J Cardiovasc Imaging. 2015;16:233–70.
16. Ilercil A, O'Grady MJ, Roman MJ, Paranicas M, Lee ET, Welty TK, Fabsitz RR, Howard BV, Devereux RB. Reference values for echocardiographic measurements in urban and rural populations of differing ethnicity: the Strong Heart Study. J Am Soc Echocardiogr. 2001;14:601–11.
17. Dannenberg AL, Levy D, Garrison RJ. Impact of age on echocardiographic left ventricular mass in a healthy population (the Framingham Study). Am J Cardiol. 1989;64:1066–8.
18. Dalen H, Thorstensen A, Vatten LJ, Aase SA, Stoylen A. Reference values and distribution of conventional echocardiographic Doppler measures and longitudinal tissue Doppler velocities in a population free from cardiovascular disease. Circ Cardiovasc Imaging. 2010;3:614–22.
Publisher’s Note