R E G U L A R A R T I C L E
Food intake survey of kindergarten children in Korea: Part 1
food, energy, and nutrient intake
Haruo Nakatsuka1•Eul-Sang Kim2•Yang-Sook Ko3•Hye-Ran Yang4•
Chan-Seok Moon5•Takao Watanabe6•Shinichiro Shimbo7•Masayuki Ikeda8
Received: 16 March 2015 / Accepted: 13 April 2015 / Published online: 21 May 2015 ÓThe Japanese Society for Hygiene 2015
Abstract
Objectives Nutrient intakes of children were surveyed at the time when a nation-wide shift took place in the Republic of Korea from agriculture-based to industrialized society. Taking advantage of the survey locations (see below), possible delay in nutritional improvement in rural areas (as compared with that in an urban area) was also examined.
Methods In total, 108 4- to 6-year-old children (boys and girls in combination) in 4 kindergartens (KGs; 1 in Seoul and 3 in Jeju Island) participated in the survey in 2003–2004. 24-h food duplicate samples were prepared by the mother of each child. Food items in each duplicate
sample were separated and coded with reference to the Dietary Reference Intake for Koreans (the 2005 version). Nutrient intake of the day was estimated from the code and weight followed by summation for daily intake.
Results The children in the KG in Seoul studied were younger, and therefore were smaller in body size than those in other KGs. Thus, it was considered necessary to evaluate nutrient intake not only on a daily basis, but after adjustment for body weight. The AM daily intake of energy (protein in parenthesis) for the 108 children was 1479 kcal (55 g)/day or 69.8 kcal (2.6 g)/kg body weight/day. Evaluation by in-dividual nutrient suggested that the intake was sufficient for almost all nutrients except for sodium and potassium. Sodium and potassium intake (2285 and 1840 mg/day, re-spectively) was in excess and insufficient, respectively, with potential risk of inducing hypertension later in life. Conclusions Inter-KG difference was not remarkable and therefore urban–rural difference was not apparent. Nutrient intakes as a whole appeared to be sufficient urban and rural areas. Nevertheless, excess Na intake coupled with insuf-ficient K intake was a common problem.
Keywords ChildrenFood intakeKindergarten
KoreaNutrient intake
Introduction
It is well known that the Korean National Health and Nutrition Examination Survey (KNHANES) covering the whole country was initiated in 1998, and that the survey has been repeated in every 3–5 years [1, 2]. It is also known that Recommended Dietary Allowances for Kore-ans has been published from the Korean Nutrition Society [3,4].
E.-S. Kim is deceased.
& Masayuki Ikeda m-71-ikeda@nifty.com
1 School of Nursing, Miyagi University, Taiwa-cho 981-3298,
Japan
2 Department of Food and Nutrition, Dankook University,
Yongin, Gyeonggi 448-701, Korea
3 Department of Food and Nutrition, Jeju National University,
Jeju 690-756, Korea
4 Seoul Metropolitan Government Research Institute of Public
Health and Environment (the Food and Drug Division), Seoul 137-734, Korea
5 Department of Industrial Health, Catholic University of
Pusan, Busan 609-757, Korea
6 Department of Childhood Education, Faculty of Human
Sciences, Tohoku Bunkyo University, Yamagata 990-2316, Japan
7 Kyoto Women’s University, Kyoto 605-8501, Japan 8 Kyoto Industrial Health Association, Kyoto 604-8472, Japan
Survey on nutrient intake among children is particularly important. As many studies in pediatric medicine had shown, children are not just small adults. From nutritional point of view, they are physically much more active and dynamic than adult people, and they need more nutrients not only for daily life, but also for growth. Nevertheless, reports on nutrition of children are still limited.
There has been a remarkable shift in the Republic of Korea from the agriculture-based community to an indus-trialized one in 1970s [5,6]. The shift may have induced improvement not only in economy, but also in nutrition of the people, especially children. Such favorable change is quite conceivable but not yet proved. The present study on nutrition was conducted early in 2000s with a special focus on 4- to 6-year-old preschool children in kindergartens, one in Seoul, a megalopolis as the capital, and one in a smaller city and two in rural areas in Jeju Island in southern part of Republic of Korea.
For the survey, the food duplicate collection method [7] was employed so that the collected samples could be employed not only for nutrient intake examination, but also for instrumental determination of selected metals in food. The 2005 version of Dietary Reference Intake for Koreans [3] was employed for nutritional evaluation as the publication date was close to the date of survey (2003–2004).
The survey report consists of three parts, i.e., Part 1 on nutrient intake (i.e., this article), Part 2 on tin intake via foods [8], and Part 3 on the burden of two pollutant metals of cadmium and lead [9].
Materials and methods
Survey sites, survey subjects and ethical issues
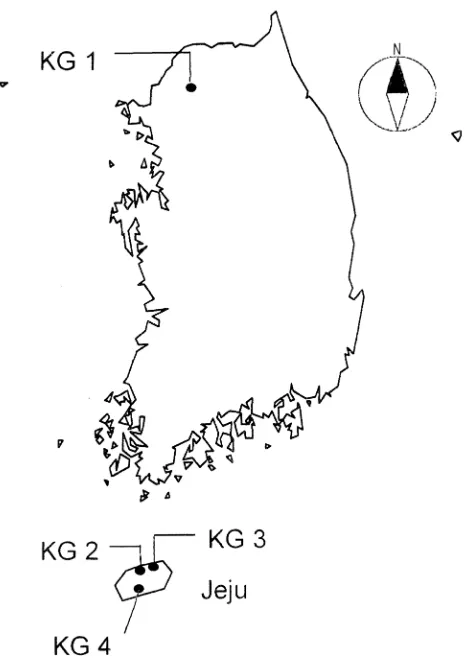
Surveys were conducted in one kindergarten (KG 1 with 33 children) in Seoul in September, 2004, and in three KGs in Jeju Island in October, 2003 (KG 2 in the city of Jeju with 37 attending children, KG 3 with 18 children and KG 4 with 20 children in rural areas in the island). Guardians of the children (mostly mothers) provided in-formed consents, demographic parameters of children and food duplicate samples. The study protocol was approved by the Institutional Review Board of Dankook University (DKU2015-03-007), Yongin-si, Gyeonggi-do 448-701, Korea.
Collection of food duplicate sample and estimation of nutrient intake
On the day of survey, the guardians were asked to prepare 24-h food duplicate samples (including drinks and water)
following the method as previously detailed [6, 10–12]. Food items in each duplicate sample were separated manually, and weights were recorded. Each food item was coded after tables attached to Dietary Reference Intakes for Koreans (the 2005 version [1]). The nutrient intake/day was estimated from the code and amount (by weight) of each food item followed by summation [10–12].
Statistical analysis
Nutrient intakes were assumed to be distributed normally so that arithmetic means (AMs) and arithmetic standard deviations (ASDs) were taken as parameters to represent distributions, although coefficients of variation (CVs) were large for some nutrients (e.g., vitamin D). One-way ana-lyses of variance (ANOVA) followed by post hoc test (Scheffe) were applied to detect possible differences among the four KGs (inter-KG difference); p\0.05 was taken as the point of significance (see Fig.1).
Fig. 1 Locations of 4 kindergartens (KGs) participated in the present
Results
Demographic characteristics of children
Demographic characteristics of the children as a whole and by KG are summarized in Table1 in terms of number (by boys and girls), age, height and weight. Most of children were at the ages of 5–6 years, but children in KG 1 were significantly younger (p\0.05) than those in other three KGs with less height and body weight on average (Table1). The observation suggested that the nutrient in-take should be evaluated on a kg body weight basis in addition to that on a daily intake basis.
Daily dietary intake of nutrients
The results of nutrient intake estimation are summarized in Table2 in terms of both on the daily intake basis and on the daily intake per by body weight basis. Amounts of food intake were also presented in terms of food groups (Table3).
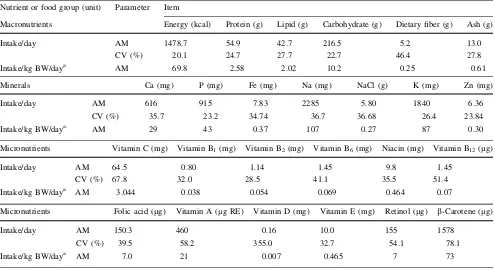
It is clear from Table2 that the children took about 1480 kcal/day (or 70 kcal/kg body weight/day) and 55 g protein/day (2.6 g protein/kg body weight/day). When co-efficients of variation (CVs) were calculated, CVs for macronutrients were less than 30 % (with exception of dietary fibers). CVs tended to be greater for minerals, and
Table 1 Number of children
surveyed and their ages and body sizes by kindergarten
Kindergarten (KG) No. of children Age (years) Hight (cm) Body weight (kg)
Total Boys Girls AM ASD AM ASD AM ASD
Total 108 54 54 5.5 0.6 115.2 5.3 21.6 3.8
A. KG 1 33 15 18 5.1 1.1 112.4 4.7 19.2 2.9
B. KG 2 37 19 18 5.7 1.0 117.3 4.0 23.2 3.2
C. KG 3 18 8 10 5.8 1.4 116.1 5.2 22.4 4.4
D. KG 4 20 12 8 5.8 1.3 115.0 6.4 21.7 3.9
Comparison among KGsa B*C*D[A B*C*D[A B*C[A*D
a P
[Qmeans thatPwas significantly (p\0.05) greater thanQ, andP*Qmeans that the difference betweenPandQwas statistically insignificant (p[0.05)
Table 2 Daily take by nutrients and by food groups
Nutrient or food group (unit) Parameter Item
Macronutrients Energy (kcal) Protein (g) Lipid (g) Carbohydrate (g) Dietary fiber (g) Ash (g)
Intake/day AM 1478.7 54.9 42.7 216.5 5.2 13.0
CV (%) 20.1 24.7 27.7 22.7 46.4 27.8
Intake/kg BW/daya AM 69.8 2.58 2.02 10.2 0.25 0.61
Minerals Ca (mg) P (mg) Fe (mg) Na (mg) NaCl (g) K (mg) Zn (mg)
Intake/day AM 616 915 7.83 2285 5.80 1840 6.36
CV (%) 35.7 23.2 34.74 36.7 36.68 26.4 23.84
Intake/kg BW/daya AM 29 43 0.37 107 0.27 87 0.30
Micronutrients Vitamin C (mg) Vitamin B1(mg) Vitamin B2(mg) Vitamin B6(mg) Niacin (mg) Vitamin B12(lg)
Intake/day AM 64.5 0.80 1.14 1.45 9.8 1.45
CV (%) 67.8 32.0 28.5 41.1 35.5 51.4
Intake/kg BW/daya AM 3.044 0.038 0.054 0.069 0.464 0.07
Micronutrients Folic acid (lg) Vitamin A (lg RE) Vitamin D (mg) Vitamin E (mg) Retinol (lg) b-Carotene (lg)
Intake/day AM 150.3 460 0.16 10.0 155 1578
CV (%) 39.5 58.2 355.0 32.7 54.1 78.1
Intake/kg BW/daya AM 7.0 21 0.007 0.465 7 73
further greater in the cases of micronutrients; CV was as large as[300 % in case of vitamin D. The second largest was 78 % forb-carotene.
Table3 shows that children took 333 g of cereals on average (assumedly boiled rice as staple foods). The CV was as small as 26 %; the small CVs were taken to suggest that every child had rice at least once a day. CVs were greater for other food groups, but such was quite con-ceivable because each family may take different meals.
Difference in nutrient intake among 4 KGs
Analyses for possible difference in nutrient intake (in-cluding energy intake) showed that the inter-KG difference was quite limited. Only the nutrient items with significant inter-KG difference (p\0.05) are listed in Table4.
Thus, no significant difference could be detected in protein and carbohydrate intakes. Energy intake was lower in KG 2 in agreement with lower lipid intake. The obser-vation did not support the assumption of possible urban– rural difference. For example, the values for energy intake in KG 3 and KG 4, the two KGs in rural areas in Jeju Island, were indeed greater than the value for KG 1 in Seoul (although the difference was statistically in-significant with p[0.05). It was quite conceivable that vitamin C intake was higher in KG 3 and KG 4 in the rural areas. There was no significant inter-KG difference (p[0.05) in intakes of minerals or vitamins other than vitamin C (Tables2,3).
Difference in intake by food groups among 4 KGs
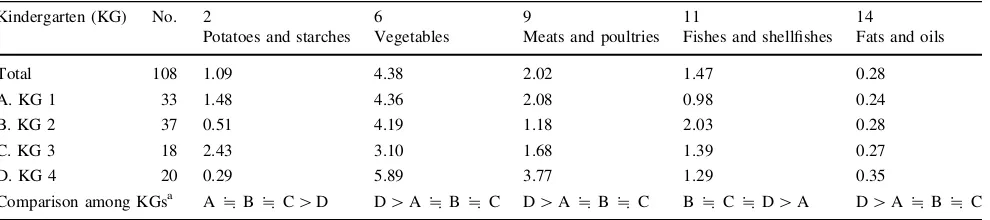
Similar analyses on food intakes by 17 food groups (in-cluding prepared foods) (Table5) disclosed that inter-KG differences were detectable in 5 groups only. It was in-teresting to note that children in KG 4 took less potatoes (and starches) and more vegetables (in agreement with higher intake of vitamin C). It was conceivable that fishes and shell fishes intakes were higher in the 3 KGs in Jeju Island than in KG 1 in the inland city of Seoul.
Discussion
In Korea, there had been substantial changes in food intake and therefore that of nutrients in 1970s (e.g., [4,5]). The society had been predominantly agricultural previously, but during this period, a shift took place in the location of working forces so that less than 5 % was in the agricultural sector after the shift [4]. Correspondingly, there was a re-markable shift in nutrient intake from cereal-based foods rich in carbohydrate to animal-based foods with substantial intake of lipid [4]. Thus, intake of plant foods dropped
down from 1024 g/person/day in 1969 to 871 g/person/day in 1995, whereas animal foods increased from 32 g/per-son/day to 330 g/perg/per-son/day during the same period [5]. It is quite conceivable that such shift may take place first in urban areas. The present observation of general absence of urban–rural difference (Table3) suggests that the shift was already completed in both urban and rural areas at the time of survey (i.e., early in 2000s). Lee and Kim [1] analyzed the KNHANES data and reported that vegetable intake increased significantly in all ages and across two genders, especially at lunch and dinner. Unfortunately, possible urban–rural differences in responses were not mentioned.
For evaluation of dietary intake, the 2005 version of Dietary Reference Intake for Koreans [3] was employed, because of closeness of the publication date with the dates of the present surveys (2003–2004). The version gives the reference value for energy intake of A. 1400 kcal, B. 1600 kcal and C. 1500 kcal for 3- to 5-year-old children, 6-to 8-year-old boys and 6- 6-to 8-year-old girls, respectively. A grand average was calculated by the equation of {A?[(B?C)/2]/2} for evaluation of the present results in which 4- to 6-year-old children (boys and girls in combination) participated. The equation gave 1475 kcal. The present result of 1479 kcal (Table2) was almost equal to the estimated reference value; the agreement may
suggest that the food duplicate collection was conducted adequately and the samples were fit for further evaluation. The results of calculation for other nutrition parameters by use of the above-cited equation (the bottom line in Table6) showed that the intakes were adequate for almost all of the nutrient items. There may be two exceptions, namely ex-cess intake of sodium and insufficient intake of potassium. Possible inter-KG difference was examined for energy, protein, vitamin B1, vitamin C, and four minerals of cal-cium (Ca), sodium (Na), potassium (K) and iron (Fe), by use of ANOVA; the 4 KGs were taken as independent variables and one of the nutrients (including energy) as a dependent variable. For selection of the dependent vari-ables, risks (although quite remote) were considered for malnutrition (energy and protein [13]), vitamin deficiency (vitamin B1and vitamin C [14, 15]), iron deficiency ane-mia (Fe [16]), retarded bone growth (Ca [17]) and hyper-tension (Na and K [18]).
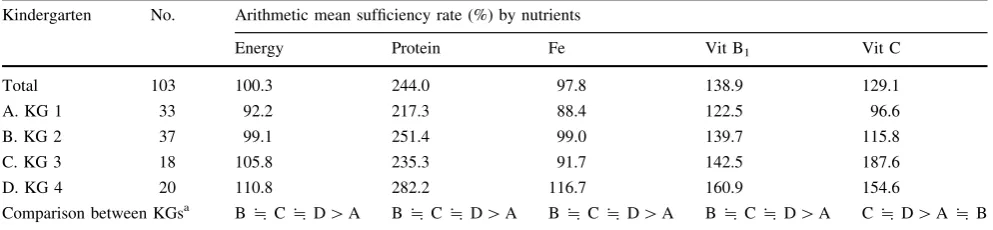
Nutrient items with statistical significance (p\0.05 by ANOVA) are summarized in Table7. Intakes of energy and protein (and possibly Fe as well) were lower for children in KG 1, but this may not be a matter of concern, because the children in KG 1 were younger and therefore smaller in body size than those in other KGs (Table1). Higher intake of vitamin C for children in KG 3 and KG 4
Table 4 Intake of nutrients with significant inter-KG difference
Kindergarden No. Macronutrients Micronutrient
Energy (kcal) Lipid (g) Dietary fiber (g) Vit. C (mg)
Total 108 69.8 2.02 0.25 3.04
A. KG 1 33 71.8 2.09 0.27 2.56
B. KG 2 37 63.8 1.81 0.22 2.60
C. KG 3 18 71.1 1.94 0.19 4.27
D. KG 4 20 76.2 2.34 0.32 3.56
Comparison among KGsa A*C*D[B A*C*D[B D[A*B*C C*D[A*B
Intakes were shown in terms of unit (as shown in the table)/kg body weight/day: AM values are shown
a Notes are as under Table1
Table 5 Food intakes with significant inter-KG differences
Kindergarten (KG) No. 2 6 9 11 14
Potatoes and starches Vegetables Meats and poultries Fishes and shellfishes Fats and oils
Total 108 1.09 4.38 2.02 1.47 0.28
A. KG 1 33 1.48 4.36 2.08 0.98 0.24
B. KG 2 37 0.51 4.19 1.18 2.03 0.28
C. KG 3 18 2.43 3.10 1.68 1.39 0.27
D. KG 4 20 0.29 5.89 3.77 1.29 0.35
Comparison among KGsa A*B*C[D D[A*B*C D[A*B*C B*C*D[A D[A*B*C Units for intakes were in g/kg body weight/day; AM values are shown
Table 6 Selected dietary reference intake values and the values employed for sufficient intake Item (Unit/day) Energy and nutrients Energy (kccal) Protein (g) Vitamin A ( l g RE) Vitamin D( l g) Vitamin E (mg a -TE) Vitamin C (mg)
Vitamin B1
(mg)
Vitamin B2
(mg)
Vitamin B6
(mg)
Vitamin B12
( l g) Ca (mg) P (mg) Na (mg) K (mg) Fe (mg) Zn (mg) DRI a for A. 3-to 5-year-old children 1400 20 300 10 6 4 0 0.5 0.5 0.7 1.1 600 500 1000 3000 7 4 B. 6-to 8-year-old boys 1600 25 400 10 7 6 0 0.7 0.7 0.9 1.3 700 700 1200 3800 9 5 C. 6-to 8-year-old girls 1500 25 400 10 7 6 0 0.6 0.6 0.8 1.3 700 600 1200 3800 9 5 Specification b EER RI RI AI AI RI RI RI RI RI RI RI AI AI RI RI The values to
calculate sufficient intakes
(D) c 1475 22.5 350 10 6.5 50 0.575 0.58 0.78 1.2 650 575 1100 3400 8 4.5
Measured value (intake/day: E)
may be the reflection of the locations that they were in rural areas. Intakes of Na and K did not show inter-KG differ-ence. The lack of the difference suggests that the problem of excess Na intake and insufficient K intake (Table6) were common to children irrespective of locations of KGs and therefore across urban and rural areas. Possible risk of developing hypertension later in life [18] should be a po-tential health concern. The risk of hypertension as sug-gested by the present analysis is not specific to the populations in Korea, but common to the people in Japan [19].
There are several limitations in the present survey. Only one kindergarten was studied in the large city of Seoul. It is quite possible that the kindergarten studied may not be representative of many kindergartens in the metropolis. The food habits of children may vary de-pending on the individual conditions such as social and economic status of the family. Another problem is the fact that food duplicate samples were collected only for 1 day. This limitation may be inherent to this method, because preparation of the collection is nerve-taxing and hand-requesting. An important advantage is the fact that the collected samples can be used for instrumental ana-lyses for components, e.g., some metals. The ages of children in the 4 KGs distributed from 4 to 6 years (Table1) and body sizes were inevitably different (i.e., smaller in KG 1 than in other KGs). As the dietary reference intakes were given for age groups of 3–5 and 6–8 years (Table6), the evaluation for adequate food intakes was possible only for combination of two age ranges (i.e., 3–4 and 6–8 years). The reference values thus calculated could be too demanding for children in KG 1 (Table7). Higher intakes of meats and poultry together with higher intake of fats and oils in KG 4 might suggest unique food habits there. However, details were not known to explain further.
The present results in Table4 may need care in evaluation. It is also known that family structure (e.g., living with both parents or not) may affect availability of some foods for children such as fruits and dairy products
[20]. No data were available in the present study on the family structures of participating children.
In conclusion, nutrient intakes as a whole appeared to be sufficient across the four kindergartens in urban and rural areas. Nevertheless, excess Na intake coupled with insuf-ficient K intake was a common problem. Attention may be necessary for hypertension later in life. No urban–rural difference in the nutrition for children was detected.
Acknowledgments The authors are grateful to Dr. K. Jung (the
General Director) and Dr. J.-H. Kim (the Director of the Food and Drug Division) of Seoul Metropolitan Government Research Institute of Public Health and Environment, Seoul, Korea, for their interest and support to this work. Thanks are also due to the participating children and their guardians, and administrations and staff of the kindergartens participated in the study. This work was supported in part by grants from the Ministry of Education, Culture, Sports, Science and Tech-nology, Japan: Grant-in-Aid for Scientific Research C: 22500755 (Head Investigator; T. Watanabe for fiscal years 2010–2012), and Grant-in-Aid for Scientific Research C; 26350150 (Head Investigator; H. Nakatsuka for fiscal years 2014–2016).
Conflict of interest The authors declare that they have no conflicts
of interest.
References
1. Lee J-S, Kim J. Vegetable intake in Korea; data from the Korean National Health and Nutrition Examination Survey 1998, 2001 and 2005. Br J Nutr. 2010;103:1499–506.
2. Lee K. Regional present fat and bone mineral density in Korean adolescents: the Fourth Korean National Health and Nutrition Examination Survey (KNHANES IV-3), 2009. Asia Pac J Clin Nutr. 2013;22:69–73.
3. Korean Nutrition Society. Dietary reference intakes for Koreans (the 2005 Version). Seoul: Korean Nutrition Society; 2005. 4. Korean Nutrition Society. Dietary reference intakes for Koreans
(the 2010 Revision). Seoul: Korean Nutrition Society; 2010. 5. Ju JS. Nutrition in the Republic of Korea. Br J CNutr.
2000;84(Suppl 2):8195–8.
6. Kim S, Moon S, Popkin BM. The nutrition transition in South Korea. Am J Clin Nutr. 2000;71:44–53.
7. Acheson KJ, Campbell IT, Edholm OG, Miller DS, Stock MJ. The measurement of food and energy intake in man—an evaluation of some techniques. Am J Clin Nutr. 1980;33:1147–54.
Table 7 Nutrients with significant inter-KG difference in sufficiency rate
Kindergarten No. Arithmetic mean sufficiency rate (%) by nutrients
Energy Protein Fe Vit B1 Vit C
Total 103 100.3 244.0 97.8 138.9 129.1
A. KG 1 33 92.2 217.3 88.4 122.5 96.6
B. KG 2 37 99.1 251.4 99.0 139.7 115.8
C. KG 3 18 105.8 235.3 91.7 142.5 187.6
D. KG 4 20 110.8 282.2 116.7 160.9 154.6
Comparison between KGsa B*C*D[A B*C*D[A B*C*D[A B*C*D[A C*D[A*B
8. Yang H-R, Ko Y, Watanabe T, Nakatsuka H, Moon C-S, Kim E-S, et al. Food intake survey of kindergarten children in Korea: Part 2 Increased dietary intake of tin possibly associated with canned foods. Environ Health Prev Med (in press).
9. Watanabe T, Ko Y, Yang H-R, Moon C-S, Kakatsuka H, Kim E-S, et al. Food intake survey of kindergarten children in Korea: Part 3 cadmium and lead burden. Environ Health Prev Med (in press).
10. Shimbo S, Watanabe T, Nakatsuka H, Yaginuma-Sakurai K, Ikeda M. Dietary tin intake and association with canned food consumption in Japanese preschool children. Environ Health Prev Med. 2013;18:230–6.
11. Nakatsuka H, Shimbo S, Watanabe T, Yaginuma-Sakurai K, Ikeda M. Applicability of food composition tables as a tool to estimate mineral intake of preschool children in Japan: a validation study. J Trace Elem Med Biol. 2013;27:339–45. 12. Watanabe T, Nakatsuka H, Shimbo S, Yaginuma-Sakurai K,
Ikeda M. High cadmium and low lead exposure of children in Japan. Int Arch Occup Environ Health. 2013;86:865–73. 13. Institute of Medicine. Dietary reference intakes: energy, protein
and others. 5 Energy, 10 Protein and others. p. 107–264, and p. 589–768. Washington, D.C.: National Academies Press; 2005.
14. Institute of Medicine. Dietary reference intakes: thiamin and others. 4 Thiamin etc. p. 58–86. Washington, D.C.: National Academies Press; 2000.
15. Institute of Medicine. Dietary reference intakes: vitamin C and others. 3 Vitamin C etc. p. 58–72. Washington, D.C.: National Academies Press; 2000.
16. Institute of Medicine. Dietary reference intakes: iron and others. 9 Iron. p. 290–393. Washington, D.C.: National Academies Press; 2002.
17. Institute of Medicine. Dietary reference intakes: calcium and others. 2 Calcium etc. p. 28–40. Washington, D.C.: National Academies Press; 1997.
18. Institute of Medicine. Dietary reference intakes: potassium, sodium and others. 5 Potassium, 10 Sodium and others. p. 186–268, and p. 269–423. Washington, D.C.: National Aca-demies Press; 2004.
19. National Institute of Health and Nutrition, Japan. The National Health and Nutrition Survey, 2011. pp. 46, 56–63, 115–118. Tokyo: Daiichi Shuppann Publishers; 2015.