O R I G I N A L R E S E A R C H A R T I C L E
Open Access
Indoor bacterial load and its correlation to
physical indoor air quality parameters in
public primary schools
Zewudu Andualem
*, Zemichael Gizaw, Laekemariam Bogale and Henok Dagne
Abstract
Background:Poor indoor air quality is a great problem in schools due to a high number of students per classroom, insufficient outside air supply, poor construction and maintenance of school buildings. Bacteria in the indoor air environment pose a serious health problem. Determination of bacterial load in the indoor environment is necessary to estimate the health hazard and to create standards for indoor air quality control. This is especially important in such densely populated facilities like schools.
Methods:Institutional based cross-sectional study was conducted among 51 randomly selected classrooms of eight public primary schools from March 29–April 26, 2018. To determine the bacterial load passive air sampling settle plate method was used by exposing a Petri dish of blood agar media for an hour. The Pearson correlation matrix was employed to assess the correlation between bacterial load and physical parameters.
Results: The grand total mean bacterial load was 2826.35 CFU/m3 in the morning and 4514.63 CFU/m3 in the
afternoon. The lowest and highest mean bacterial load was recorded at school 3 (450.67 CFU/m3) and school 5 (7740.57 CFU/m3) in the morning and afternoon, respectively. In the morning relative humidity (r=−0.7034), PM2.5 (r= 0.5723) and PM10 (r= 0.6856); in the afternoon temperature (r= 0.3838), relative humidity (r=−0.4014) were correlated with indoor bacterial load. Staphylococcus aureus, Coagulase-negative Staphylococcus species and
Bacillus species were among isolated bacteria.
Conclusions: High bacterial load was found in public primary schools in the Gondar city as compared to
different indoor air biological standards. Temperature, relative humidity and particulate matter concentration (PM2.5 and PM10) were associated with the indoor bacterial load. Staphylococcus aureus, Coagulase-negative
Staphylococcus species and Bacillus species were among isolated bacterial species. Attention should be given to control those physical factors which favour the growth and multiplication of bacteria in the indoor environment of classrooms to safeguard the health of students and teachers in school.
Keywords:Bacterial load, Classrooms, Correlation, Indoor air, Settle plate method
Background
Clean air is a basic requirement of life [1]. Most people spend 80–95% of their time in indoor environments by breathing on average 10–14 m3 of air per day [2–5]. Millions of children and adults spend 24–30% of their time in a day in school buildings, and they need safe, healthy environments to thrive, learn, and succeed [6,7].
The indoor air quality has been the object of several studies due to an increasing concern within the scientific community on the effects of indoor air quality upon health, especially as people spend more time indoors than outdoors [8–10]. The quality of air inside, homes, of-fices, schools or other private and public buildings is an essential determinant of healthy life and people’s well-being [1].
Indoor air pollution is a major problem in people daily life. Efficient corrective methods are urgently needed to combat the problem of indoor air quality: bacteria,
* Correspondence:zewuduandualem12@gmail.com
Department of Environmental and Occupational Health and Safety, Institute of Public Health, College of Medicine and Health Sciences, University of Gondar, Gondar, Ethiopia
pollen grains, smoke, humidity, chemical substances, and gases released by anthropogenic activity which has adverse health effects in humans [11]. Several studies underscore the significant risks of global warming on human health due to increasing levels of air pollution. The last decades have seen a rise in the concentrations of pollens and pollutants in the air. This rise parallels the increase in the number of people presenting with allergic symptoms (e.g., allergic rhinitis, conjunctivitis, and asthma) [12].
Globally, 3.8 million deaths were attributed to indoor air pollution in 2016. More than 90% of air pollution-related deaths occur in low- and middle-income countries, mainly in Asia and Africa, followed by low- and middle-income countries of the Eastern Mediterranean region, Europe, and Americas [13]. Bioaerosols contribute about 5–34% of indoor air pollution [5,6,14,15].
Indoor air quality problems in schools may be even more serious than in other categories of buildings, due to higher occupant density, poor sanitation of class-rooms, and insufficient outside air supply, aggravated by frequent poor construction and maintenance of school buildings [16]. Poor indoor air quality can also affect scholarly performance and attendance since children are more vulnerable than adults to health risks from expos-ure to the environmental hazard [16–18].
Therefore, the purpose of this research was to assess the bacterial quality of indoor air in public primary schools to increase awareness and provide references for better un-derstanding about bacterial indoor air quality problems in public primary schools.
Methods and materials Study design and study area
Institutional based cross-sectional study was conducted to assess indoor bacterial load and its relation to phys-ical indoor air quality parameters of public primary schools in Gondar city, Northwest Ethiopia. Gondar city is located in the northern part of Ethiopia in Amhara national regional state, North Gondar zone at a distance of 727 km from Addis Ababa and 173.09 km from the regional capital Bahir Dar at the 12°45’north latitude and 37 ° 45′ east longitudes. In Gondar city there are twenty public primary schools from grade 1–8 with a total of 27,766 students enrolled in 266 class-rooms [19].
Sample size and sampling procedures
The sample size was determined based on environmen-tal sampling and sample size determination methods [20]. Manly formula was used to determine sample size [21] by using the following equation.
n¼4σ 2
δ2
Where n = Number of samples, σ= Standard devi-ation, δ= Acceptable error [δ is half of the width of a 95% the confidence interval on the mean (Xδ)].
From a total of twenty public primary schools, 40% of the schools were selected through simple random sam-pling and 20% of classrooms at schools were selected as study unit through simple random sampling.
The mean and standard deviation (σ) of eight ran-domly selected public primary schools was 13.3 and 5.37 respectively, by taking 3% acceptable error (δ).
n¼ 4ð5:37Þ 2
1:5
ð Þ2
" #
¼51
A total of fifty-one classrooms were selected from eight public primary schools of Gondar city by simple random sampling technique.
Air sampling procedures
Air samples were taken from 51 randomly selected class-rooms from eight public primary schools in Gondar city. Bacterial measurements were made by passive air sam-pling method i.e., the settle plate method. Standard Petri dishes with 9 cm diameter (63.585 cm2areas) containing culture media were exposed. Bacterial contamination de-termination was based on the count of the microbial fall out on to Petri dishes left open to the air, according to the 1/1/1 scheme (for 1 h, 1 m away from the floor, at least 1 m away from walls or any obstacle) [14]. Bacteria were collected on blood agar media to which an antifun-gal agent (Griseofulvin) had been added to inhibit the growth of fungi. To determine the bacterial load with re-spect to environmental variation, sampling was done in the morning (at 6:30 am before students enter to the classroom) and afternoon (5:00 pm, after students left the classroom). After exposure, the sample was taken to the laboratory (Department of Biology, at the University of Gondar) and incubated at 37 °C for 24 to 48 h. Colony forming units (CFU) was enumerated, CFU/m3 micro-bial concentration was determined, using the following equation [22].
N¼a10000.
bt0:2
Where N = Microbial CFU/m3of indoor air; a = Num-ber of colonies per Petri dish; b = Dish surface area (cm2); t = Exposure time.
Parallel with bacterial sample collection, data on physical parameters such as CO2 concentration,
par-ticulate matter concentration (PM2.5 and PM10), in-door temperature, and relative humidity were measured by Aireveda. To minimize dilution of air contaminants, openings like doors and windows were closed [7,25, 26]. In addition, the movement of people during sampling was restricted to avoid air disturbance and newly emitted microorganisms.
Data analysis
Statistical analyses were carried out using STATA/SE 14.0. To assess the correlation of bacteria concentration with environmental factors like carbon dioxide concentra-tion, particulate matter concentration (PM2.5 and PM10), temperature and relative humidity Pearson correlation was employed. One way analysis of variance (ANOVA)
was carried out to know the mean difference of the bacter-ial load in public primary schools.
Results Bacterial load
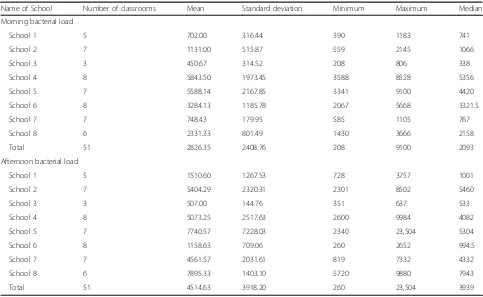
The concentrations of bacterial aerosols in the indoor environment of public primary schools in Gondar city, estimated with the use of the settle plate method, the lowest and highest bacterial load was estimated in the morning in school 1 (208 CFU/m3) and in the afternoon in school 5 (23,504 CFU/m3) (Table1).
The grand total mean bacterial load was 2826.35 and 4514.63 CFU/m3 in the morning and afternoon, re-spectively, while the overall mean bacterial load was 3670.49 CFU/m3(Table1). ANOVA test result was pre-sented to show the mean bacterial load difference among different public primary schools. The test showed that there was a significant mean bacterial load Table 1Statistical summary of bacterial load, in public primary schools of Gondar city, Northwest Ethiopia, 2018. (n= 51)
Name of School Number of classrooms Mean Standard deviation Minimum Maximum Median Morning bacterial load
School 1 5 702.00 316.44 390 1183 741 School 2 7 1131.00 515.87 559 2145 1066 School 3 3 450.67 314.52 208 806 338 School 4 8 5843.50 1973.45 3588 8528 5356 School 5 7 5588.14 2167.85 3341 9100 4420 School 6 8 3284.13 1185.78 2067 5668 3321.5 School 7 7 748.43 179.95 585 1105 767 School 8 6 2331.33 801.49 1430 3666 2158 Total 51 2826.35 2408.76 208 9100 2093 Afternoon bacterial load
School 1 5 1510.60 1267.53 728 3757 1001 School 2 7 5404.29 2320.31 2301 8502 5460 School 3 3 507.00 144.76 351 637 533 School 4 8 5073.25 2517.63 2600 9984 4082 School 5 7 7740.57 7228.03 2340 23,504 5304 School 6 8 1158.63 709.06 260 2652 994.5 School 7 7 4561.57 2031.61 819 7332 4332 School 8 6 7895.33 1403.10 5720 9880 7943 Total 51 4514.63 3918.20 260 23,504 3939
Table 2ANOVA test result on mean bacterial load difference among public primary schools of Gondar city, Northwest Ethiopia 2018
Analysis of Variance
Source variation Sum of Square Degree of freedom Mean Square F Sig. Between groups 189,395,110 7 27,056,444.3 7.67 < 0.001 Within groups 151,708,969 43 3,528,115.56
difference among public primary schools at p < 0.001 (Table2).
Physical parameters of indoor air environments
During physical parameter measurement, it was found that all examined classrooms did not have an HVAC (heating, ventilation, and air conditioning) system. The ranges of carbon dioxide concentration, indoor temperature, relative humidity, and particulate matter concentration (PM2.5 & PM10) during sampling time ranged from 401 to 550 ppm, 12 to 24 °C, 14 to 64%, 7 to 173μg/m3, and 21 to 277μg/m3 respectively (Table3).
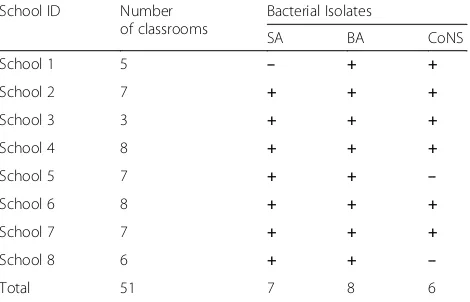
Isolated bacterial species
Three bacterial species were isolated; Bacillus species, Staphylococcus aureus and Coagulase-negative Staphylo-coccus (CoNS) species. Bacillus species was found in all public primary schools (Table4).
According to the European sanitary standards for non-industrial premises, the degree of air pollution by
bacteria population across the various classrooms of the eight public primary schools ranges largely between high to very high (Table5).
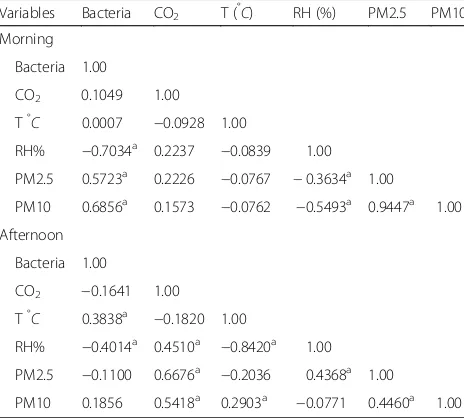
Relative humidity, particulate matter concentration and temperature correlated with an indoor bacterial load of public primary schools from all physical indoor air quality parameters; relative humidity had a negative strong correlation with indoor bacterial load (Table6).
Discussion
The bacterial load of indoor air environments of public primary schools in Gondar city was found in the range between 208 and 23,504 CFU/m3 with a mean bacterial load of 3670.49 CFU/m3, the finding of this study was higher than the findings of other studies, one conducted in Poland, [27] and another in Malaysia, [28].
There are no generally accepted threshold limit values concerning concentrations of the air of indoor bacteria, and the obtained results could be compared only with the values recommended by various authors or institutions. The work conducted by a WHO expert group on assess-ment of health risks of biological agents in indoor environ-ments suggested that total microbial concentration should not exceed 1000 CFU/m3[29], whereas other scholars con-sidered that 750 CFU/m3 should be the limit for bacteria [30]. Airborne microbial concentrations ranging from 4500 to 10,000 CFU/m3 also have been suggested as the upper limit for ubiquitous bacterial aerosols [31]. Ac-cording to the sanitary standards of the European Com-mission for non-industrial premises, the permissible limits of bacterial load were≤500 CFU/m3 [32]. The variation of bacterial load in indoor environments might be due to environmental factors such as ventila-tion system of classroom, temperature, humidity, and particulate matter concentration.
The finding of isolated bacterial species of the present study partly agrees with the work by Hussin N. et al. [28]. Table 3Statistical summary of physical indoor air quality parameters in public primary schools of Gondar city, Northwest Ethiopia, 2018 (n= 51)
Variables Mean Standard Deviation Median Minimum Maximum CO26:30 am 458.54 30.44 453 406 550
CO25:00 pm 429.12 27.05 422 401 548
T°C6:30 am 14.27 0.94 14 12 16
T°C5:00 pm 19.02 3.08 20 15 24
RH%6:30 am 39.37 14.25 45 21 61
RH%5:00 pm 36.37 13.89 39 14 57
PM2.5 6:30 am 68.18 43.42 48 18 173 PM2.5 5:00 pm 12.82 3.38 13 7 22 PM10 6:30 am 138.06 68.64 129 42 277 PM10 5:00 pm 55.92 22.06 51 21 144
N.BCarbon dioxide, (CO2, ppm); Temperature, (T, °C); Relative humidity, RH (%); concentration of particulate matter concentration PM10 and PM2.5 (μg/m3)
Table 4Type of microorganism isolated from each public Primary schools in Gondar city Northwest Ethiopia, 2018 (n= 51)
School ID Number of classrooms
Bacterial Isolates
SA BA CoNS School 1 5 – + +
School 2 7 + + +
School 3 3 + + +
School 4 8 + + +
School 5 7 + + –
School 6 8 + + +
School 7 7 + + +
School 8 6 + + –
Total 51 7 8 6
Likewise, it was harmonized in a study conducted in India [33], and it was partly agreed in the work by Naruka K. et al., [34].
In this study, the temperature of the indoor environ-ment had a positive correlation with total airborne bac-teria in the afternoon (r= 0.3838) while there was no correlation in the morning airborne bacterial concentra-tion. During the study, the temperature ranged from 12 to 16 °C and 15–26 °C in morning and afternoon, respect-ively. This was consistent with the results reported by Brągoszewska Ewa, et al. [35], but inconsistent with the re-sults reported by Naruka et al. [34], where the
temperature was negatively correlated, and Hayleeyesus S. et al. [14] where there was no correlation between temperature and indoor bacterial load.
The bacterial load would be significantly correlated with indoor temperature, i.e., the concentration of aero-sols will increase as the temperature increases [35], but the variation might be due to the fact that other envir-onmental factors increase the concentration of bacteria in classrooms and the number of students may result in a great diversity of high bacterial load [36].
In this study relative moderate to strong humidity was negatively correlated with total airborne bacteria in the afternoon (r=−0.4014) and in the morning (r=− 0.7034), respectively. The RH in public primary schools ranged from 21 to 62 % and 14–57 % in morning and afternoon, respectively. The negative correlation between relative humidity and indoor airborne bacterial load was not consistent with what is expected since a strict correl-ation between bacterial load and relative humidity was already reported by Brągoszewska Ewa, et al. [35], Huang H, et al. [37]. The possible explanation might be that if relative humidity decreases, bacterial load becomes de-creased because the viability of aerosols becomes inhib-ited if relative humidity is too low, because a dry environment decreases the metabolism and physiological activities of microorganisms [35].
Correlation of PM2.5 was positively strong with total airborne bacteria (r= 0.5723), while there is no correlation in the afternoon airborne bacterial concentration. The positive correlation of this finding is in agreement with a study conducted in Poland [38], but in other study con-ducted in Poland [35], PM2.5 was negatively correlated.
In this study, PM10 had a strong positive correlation with airborne bacterial load (r= 0.6856) but there was no correlation with the afternoon airborne bacterial load. The positive correlation is supported by a study conducted in Table 5Assessments of bacterial indoor air quality in the selected eight public Primary schools in Gondar city, according to the sanitary standards for non-industrial premises (n= 51)
Bacterial
Sampling time 6:30–7:30 am 5:00–6:00 pm
Range of values (CFU/m3) < 50 50–100 100–500 500–2000 > 2000 < 50 50–100 100–500 500–2000 > 2000 Degree of Air Pollution Very low Low Intermediate High Very high Very low Low Intermediate High Very high School School 1 – – – √ – – – – √ –
School 2 – – – √ – – – – – √ School 3 – – √ – – – – – √ – School 4 – – – – √ – – – – √ School 5 – – – – √ – – – – √ School 6 – – – – √ – – – √ – School 7 – – – √ – – – – – √ School 8 – – – – √ – – – – √
NB:≤500 CFU/m3
is the permissive standard, (√) in the range; (−) not in the range
Table 6Pearson correlation coefficients between indoor bacterial concentration & physical indoor air quality parameters in public primary schools of Gondar city, Northwest Ethiopia, 2018. (n= 51)
Variables Bacteria CO2 T (°C) RH (%) PM2.5 PM10
Morning Bacteria 1.00
CO2 0.1049 1.00
T°C 0.0007 −0.0928 1.00
RH% −0.7034a 0.2237 −0.0839 1.00
PM2.5 0.5723a 0.2226 −0.0767 −0.3634a 1.00
PM10 0.6856a 0.1573 −0.0762 −0.5493a 0.9447a 1.00
Afternoon Bacteria 1.00
CO2 −0.1641 1.00
T°C 0.3838a −0.1820 1.00
RH% −0.4014a 0.4510a −0.8420a 1.00
PM2.5 −0.1100 0.6676a −0.2036 0.4368a 1.00
PM10 0.1856 0.5418a 0.2903a −0.0771 0.4460a 1.00
N.B =a
Poland [35]. The possible explanation might be due to the fact that the PM10 increases the bacterial load that in-creases because of bioaerosols attached to coarse solid particles [39]; whereas the afternoon particulate matter concentration was not correlated with indoor bacterial load due to other environmental factors which have a more significant correlation with concentration bacterial load as compared to PM10, and the concentration of PM10 in the afternoon is lower when compared in the morning.
Conclusions
A high bacterial load was found in public primary school classrooms in the Gondar city as compared with differ-ent indoor air biological standards. Temperature, humid-ity, and particulate matter concentration (PM2.5 and PM10) were associated with the indoor bacterial load. Staphylococcus aureus, Coagulase-negative Staphylococcus, andBacilluswere among isolated bacterial species. Atten-tion should be given to control those physical factors which favour the growth and multiplication of bacteria in the indoor environment of classrooms to safeguard the health of students and teachers in school.
Abbreviations
°C:Degree centigrade; am: Ante meridian; ANOVA: Analysis of variance; CFU: Colony forming units; cm2: Centimeter square; m3: Cubic meter; PM: Particulate matter; pm: Post meridian; ppm: Part per million; RH: Relative humidity; WHO: World Health Organization.;μg: Microgram
Acknowledgements
Firstly, we would like to give our heartfelt thanks to the Almighty of God for giving us the wisdom, knowledge and all the support we needed to do this study. We would like to express our appreciation to the University of Gondar College of Medicine and Health Sciences and public primary school directors and teachers for their support.
Funding No funding source.
Availability of data and materials
Data will be made available upon request to the primary author.
Authors’contributions
All the authors actively participated during the conception of the research issue, development of a research proposal, data collection, analysis and interpretation, and write various parts of the research report. ZA designed the protocol, analyzed the data, supervised the overall research process, and prepared the manuscript. ZG, LB and HD advised and commented on the overall work. All the authors read and approved the final manuscript.
Ethics approval and consent to participate
Ethical clearance was obtained from the Institutional Review Board of the University of Gondar (ref. number: IPH/295/2017). Then, an official letter from the University of Gondar Research and Community Service Vice President and supportive letter from Institute of public health college of Medicine and Health Sciences was written to the respective responsible bodies.
Confidentiality of the data was maintained. No identifiers except coding were included in the data collection tools.
Consent for publication
This manuscript does not contain any individual person’s data.
Competing interest
The authors declare that they have no competing interests.
Publisher’s Note
Springer Nature remains neutral with regard to jurisdictional claims in published maps and institutional affiliations.
Received: 2 November 2018 Accepted: 26 December 2018
References
1. World Health Organization, WHO guidelines for Indoor Air quality: selected pollutants. 2010.
2. Fekadu HS, Melaku MA. Microbiological quality of indoor air in university libraries. Asian Pacific journal of tropical biomedicine. 2014;4:S312–7. 3. Awad Abdel Hameed A, Farag SA. An indoor bio-contaminants air quality.
Int J Environ Health Res. 1999;9(4):313–9.
4. Peter SG, Yakubu SE. Comparative analysis of airborne microbial concentrations in the indoor environment of two selected clinical laboratories. IOSR J Pharm Biol Sci (IOSR-JPBS). 2013;8:4.
5. Uzoechi AU, et al. Microbiological Evaluation of Indoor Air Quality of State University Library. Asian J Applied Sciences. 2017;05(03):525-30. 6. Samson E, Ihongbe JC, Okeleke Ochei, Hi Effedua, Phillips Adeyemi O.
Microbiological assessment of indoor air quality of some selected private primary schools in Ilishan-Remo, Ogun state. Nigeria. 2017;3:2454–9142. 7. Mohan K, Madhan N, Ramprasad S, Maruthi YA. Microbiological air quality of
indoors in primary and secondary schools of Visakhapatnam, India. Int J Curr Microbiol App Sci. 2014;3(8):880–7.
8. Cahna N, Martinho M, Almeida-Silva M, Freitas MC. Indoor air quality in primary schools. Int J Environment and Pollution. 2012;50:396–410. 9. Cahna N, Freitas MC, Almeida SM, Almeida-Silva M. Indoor school
enviroment: Easy and low cost to assess inorganic pollutants. J Radioanal Nucl Chem. 2010;286(2):495–500.
10. Freitas MC, Canha N, Martinho M, Almeida-Silva M, Almeida SM, Pegas P, et al. Chapter 20:‘Indoor air quality in primary school’, in Advanced Topics in Environmental Health and Air Pollution Case Studies, Anca Maria Moldoveanu, Editor. 2011. InTech Press: Croatia. 361-84.
11. Kalpana S. Indoor air pollution. Bhartiya Krishi Anusandhan Patrika. 2016. 4. 12. Patella V, Florio G, Magliacane D, Giuliano A, Crivellaro MA, Di Bartolomeo D, etal. Urban air pollution and climate change:“the Decalogue: allergy safe tree”for allergic and respiratory diseases care. Clin Mol Allergy. 2018;16(1): 20.
13. World Health Organization. World health organization. 2018 [cited 2018 July, 02]; available from: http://www.who.int/news-room/detail/02-05-2018-9-out-of-10-people-worldwide-breathe-polluted-air-but-more-countries-are-taking-action. 14. Fekadu HS, Amanuel E, Aklilu DF. Quantitative assessment of bio-aerosols
contamination in indoor air of university dormitory rooms. Int J Health Sci. 2015;9(3):249.
15. Zemichael G, Mulat G, Chalachew Y. High bacterial load of indoor air in hospital wards: the case of University of Gondar teaching hospital, Northwest Ethiopia. Multidiscip Respir Med. 2016;11(1):24.
16. Nascimento Pegas P, Alves C, Guennadievna Evtyugina M, Nunes T. Indoor air quality in elementary schools of Lisbon in Spring. Environ Geochem Health . 2010;33:455–68.
17. Daisey Joan M, Angell William J, Apte Michael G. Indoor air quality, ventilation and health symptoms in schools: an analysis of existing information. Indoor Air. 2003;13(1):53–64.
18. Godoi RHM, et al. Indoor air quality assessment of elementary schools in Curitiba, Brazil. Water Air Soil Pollut. 2009;9(3–4):171–7.
19. Gondar city education office, Number of students enrolled in Gondar city public primary schools from grade 1–8 2018.
20. Chunlong Z. Fundamentals of environmental sampling and analysis. Hoboken: Wiley; 2007.
21. Manly Bryan FJ. Statistics for environmental science and management. New York: Chapman and Hall/CRC; 2008.
22. Dumała Sławomira M, Dudzińska Marzenna R. Microbiological indoor air quality in polish schools. Annual Set The Environment Protection (Rocznik OchronaŚrodowiska). 2013;15:231–44.
24. Rajesh B, Lal IR. Essentials of medical microbiology. New Delhi: Jaypee Brothers, Medical Publishers Pvt. Limited; 2008.
25. Manisha J, Srivastava RK. Identification of indoor airborne microorganisms in residential rural houses of Uttarakhand, India. Int J Curr Microbiol Appl Sci. 2013;2:146–52.
26. Bartlett KH, Kennedy SM, Brauer M, van Netten C, Dill B. Evaluation and determinants of airborne bacterial concentrations in school classrooms. J Occup Environ Hyg. 2004;1(10):639–47.
27. Ewa Brągoszewska E, Mainka A, Pastuszka JS, Lizończyk K. Assessment of bacterial aerosol in a preschool, primary school and high school in Poland. Atmosphere. 2018;9(3):87.
28. Mat HNH, Sann LM, Shamsudin MN, Hashim Z. Characterization of bacteria and fungi bioaerosol in the indoor air of selected primary schools in Malaysia. Indoor Built Environ. 2011;20(6):607–17.
29. Heseltine Elisabeth and Rosen Jerome. WHO guidelines for indoor air quality: dampness and mould. Copenhagen: WHO Regional Office Europe; 2009.
30. Rao Carol Y, Burge Harriet A, Chang John CS. Review of quantitative standards and guidelines for fungi in indoor air. J Air Waste Manage Assoc. 1996;46(9):899–908.
31. Hameed AA, Habeeballah T. Air microbial contamination at the holy mosque, Makkah, Saudi Arabia. Curr World Environ. 2013;8:179–87. 32. Wanner H, Verhoeff A, Colombi A, Flannigan B, Gravesen S, Mouilleseaux A,
et al. Indoor air quality and its impact on man: report no. 12: biological particles in indoor Environments. Brussels-Luxembourg: ECSC-EEC-EAEC; 1993.
33. Kumari NK. Shravanthi Ch M, Byragi RT. Identification and assessment of airborne bacteria in selected school environments in Visakhapatnam. India Ind J Sci Res and tech. 2015;3(6):21–5.
34. Kavita N, Jyoti G. Microbial air contamination in a school. Int J Curr Microbiol App Sci. 2012;2(12):404–10.
35. Bragoszewska E, Mainka A, Pastuszka JS. Concentration and size distribution of culturable bacteria in ambient air during spring and winter in Gliwice: a typical urban area. Atmosphere. 2017;8(12):239.
36. Viegas C, Faria T, Pacifico C, Guimarães dos Santos M. Microbiota and particulate matter assessment in Portuguese optical shops providing contact lens services. Healthcare. 2017;5(2):24.
37. Hsiao-Lin H, Lee M-K, Hao-Wun S. Assessment of indoor bioaerosols in public spaces by real-time measured airborne particles. Aerosol Air Qual Res. 2017;17(9):2276–88.
38. Bragoszewska E, Pastuszka JS. Influence of meteorological factors on the level and characteristics of culturable bacteria in the air in Gliwice, upper Silesia (Poland). Aerobiologia. 2018;34(2):241–55.