RESEARCH
Cost-effectiveness of nivolumab
in patients with advanced renal cell carcinoma
treated in the United States
Charles McCrea
1*, Sukhvinder Johal
1, Shuo Yang
2and Justin Doan
2Abstract
Background: We evaluated the cost-effectiveness of nivolumab versus everolimus in patients with advanced renal cell carcinoma (RCC) from a US payer perspective.
Methods: A partitioned survival model consisting of three health states, progression-free survival (PFS), progressive disease, and death, was developed to evaluate the cost-effectiveness of intravenous nivolumab versus oral everoli-mus over a lifetime. The proportion of patients in each state was calculated based on parametric distributions fitted to PFS and overall survival (OS) data from CheckMate 025 (N = 821), a large randomized phase 3 trial of nivolumab versus everolimus for advanced RCC. Health state utility data were derived from CheckMate 025 EQ-5D data. Scenario analyses and deterministic and probabilistic sensitivity analyses assessed the impact of uncertainty in model inputs on outcomes.
Results: Over a 25-year lifetime horizon, treatment with nivolumab resulted in a gain of 0.64 quality-adjusted life-years (QALYs) versus everolimus. Nivolumab had greater total costs versus everolimus ($US197,089 vs. $US163,902), mainly due to higher acquisition costs. The incremental cost-utility ratio (ICUR), a measure of incremental costs divided by incremental QALYs, was $US51,714 per QALY gained for nivolumab versus everolimus, and an incremental cost-effectiveness ratio was $US44,576 per life-year gained for nivolumab versus everolimus. In sensitivity analyses, average body weight had the greatest impact on the ICUR for nivolumab versus everolimus (base case $US51,714; range $US8863–$US94,566). At a $US150,000 willingness-to-pay (WTP) threshold, nivolumab had a 91.7% probability of being cost-effective versus everolimus.
Conclusions: In the United States, at a WTP threshold of $US150,000 per QALY, nivolumab was found to be cost-effective. Key drivers of cost-effectiveness were survival inputs for OS and the average weight of patients; the latter directly affects nivolumab drug acquisition cost.
Keywords: Cost-effectiveness, Everolimus, Nivolumab, Renal cell carcinoma, Survival model
© The Author(s) 2018. This article is distributed under the terms of the Creative Commons Attribution 4.0 International License (http://creativecommons.org/licenses/by/4.0/), which permits unrestricted use, distribution, and reproduction in any medium, provided you give appropriate credit to the original author(s) and the source, provide a link to the Creative Commons license, and indicate if changes were made. The Creative Commons Public Domain Dedication waiver (http://creativecommons.org/ publicdomain/zero/1.0/) applies to the data made available in this article, unless otherwise stated.
Background
In the United States, kidney cancer is the sixth most common cancer in men and tenth most common cancer in women [1]. In 2017, there were ~ 64,000 new cases and ~ 14,500 deaths as a result of kidney cancer [1]. Renal cell carcinoma (RCC) accounts for ~ 80% of all kidney can-cers [2]. In addition to low survival rates for advanced
disease [3], there is also a substantial economic burden due to kidney cancer in the United States [4].
Nivolumab is a first-in-class programmed death-1 immune checkpoint inhibitor approved for use in patients with advanced RCC who have received prior antiangiogenic therapy. Approval was based on results from CheckMate 025, a randomized phase 3 trial of
nivolumab 3 mg/kg every 2 weeks (N = 410) versus
everolimus 10 mg once daily (N = 411) in patients with previously treated advanced RCC [5]. The study met its primary endpoint of overall survival (OS), achieving
Open Access
*Correspondence: Charles.McCrea@parexel.com
1 Health Economic Modelling Unit, PAREXEL Access Consulting, Evergreen Building North, 160 Euston Road, London NW1 2DX, UK
a median OS of 25.0 months with nivolumab versus 19.6 months with everolimus [5]. Nivolumab was asso-ciated with a significantly improved adverse event (AE) profile. Grade 3–4 treatment-related AEs were 19% for
nivolumab versus 37% for everolimus [5]. Longer-term
survival data are available for a phase 1 (CA209-003) study of nivolumab, which demonstrated a median OS of 22.4 months and a 5-year OS rate of 34% (minimum fol-low-up, 50.5 months) in patients with advanced RCC [6].
With the increased use of nivolumab as a standard of care in second-line RCC, there is a need to inform US payers on the value of nivolumab. Although cost-effec-tiveness analyses have been conducted for nivolumab in melanoma and non-small cell lung cancer in a number of countries [7–11], few analyses have been reported for RCC [12, 13].
The objectives of the current study were to evaluate the cost-effectiveness of nivolumab compared with everoli-mus in patients with advanced RCC from a US payer perspective. To this end, a decision analytical model was developed and validated to estimate the lifetime costs and outcomes of treatments for this patient population.
Patients and methods Health state model structure
Consistent with the approaches adopted in previous eco-nomic evaluations and technology appraisals for RCC treatment that were submitted to the Scottish Medicines Consortium and the National Institute for Health and Care Excellence, a 3-state partitioned survival model was developed to evaluate the incremental cost-utility ratio (ICUR) and incremental cost-effectiveness ratio (ICER) of nivolumab versus everolimus. The model comprised 3 key health states representing the primary stages of dis-ease in advanced or metastatic RCC: progression-free (PF), progressive disease (PD), and death. Each state rep-resents a point in the disease pathway at which health-related quality of life (HRQoL) is expected to vary.
The partitioned survival model estimated occupancy of health states using an area-under-the-curve approach from OS and progression-free survival (PFS) parametric curves derived from CheckMate 025. Patient-level data from CheckMate 025 (minimum follow-up, 26 months) were used in the development and validation of the eco-nomic model outputs. CheckMate 025 was a large, ran-domized phase 3 study of nivolumab versus everolimus for previously treated advanced RCC. The time horizon of the analysis was defined as a lifetime (25 years), and a 4-week cycle length (a fixed unit of time by which the model moves forward in time) was selected to accommo-date the dosing regimens for nivolumab and everolimus.
Survival estimates
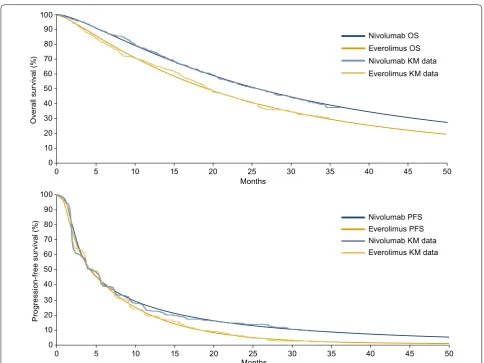
CheckMate 025 provided data up to a limited time period (minimum follow-up, 26 months; median follow-up, 33.6 months). In order to adopt a lifetime perspective, extrapolation beyond the trial period was required to estimate disease progression and OS over a lifetime. A number of models exist for extrapolating survival. Each model has a different functional form and makes differ-ent underlying assumptions on the long-term behavior of survival data, resulting in different survival estimates (and hence ICURs/ICERs). The National Institute for Health and Care Excellence Decision Support Unit has issued guidance on appropriate selection of the extrapolation method, and we followed this selection process to iden-tify appropriate models for nivolumab and everolimus [14]. The fitted curves were assessed in terms of visual inspection of survival curve fit to clinical trial Kaplan– Meier data, inspection of log-cumulative hazard plots (to assess the behavior of the hazards over time), statistical model fit via measures such as Akaike’s information cri-terion (AIC)/Bayesian information cricri-terion (BIC), and long-term extrapolation estimates versus longer-term data from the phase 1 CA209-003 study (60-month OS time point) of nivolumab for previously treated advanced RCC [6]. Based on the goodness of fit, OS was modeled using the dependent 1-knot spline normal survival func-tion for nivolumab and everolimus (Fig. 1, top panel). PFS was modeled using the dependent 2-knot spline hazard for nivolumab and everolimus, with an adjustment on the shape parameter at gamma 1 and 2 for nivolumab (Fig. 1, bottom panel). Parametric spline models are “structurally flexible” extensions of the standard parametric distribu-tions such as the Weibull, log-normal, and log-logistic functions. They are similar to piecewise modeling as they are flexible mathematical functions defined by piece-wise polynomials joined at time points along the curve known as knots. They are particularly useful in cost-util-ity modeling as they are more flexible models that can better fit the estimated Kaplan–Meier data from clinical trials, particularly when the Kaplan–Meier curves are “unique” and difficult to fit with standard distributions, or when several clinical processes influence the shape of the curve. In the case of nivolumab, spline-based models provided a better fit to the observed data compared with other, more standard parametric models. Other models were tested in a sensitivity analysis.
Health‑related quality of life (utility) estimates
and everolimus were weighted according to the objective response rate estimated for each treatment from Check-Mate 025. The odds ratio for treatment response was 5.93 for nivolumab versus everolimus. It was assumed in the economic model that all patients remaining in the PF health state beyond 22 months were considered to have the health state utility of responders. The utility values assigned to each health state were as follows: PF (complete response/partial response), 0.895; PF (stable disease), 0.846; and PD, 0.817. Additional one-off utility decrements were ascribed to patients who experienced AEs.
Cost estimates
Cost estimates were derived based on the US health-care system. Only direct medical costs were included in the analysis. These included the cost of drug acquisition, drug administration, monitoring (routine scans), disease management, end-of-life care, and the management of
AEs. Patients were treated until progression, although this assumption was tested in a sensitivity analysis. The drug acquisition cost for 10 mg/mL nivolumab was $US2545.15 per vial for 100 mg, and $US13,233.17 for 10 mg of everolimus in 28 tablets [15]. The drug acquisi-tion cost per administraacquisi-tion of nivolumab without wast-age was $US5451.71. The incidence rates of AEs in the model were derived from CheckMate 025 and included any drug-related grade 3 or higher events with a > 5% incidence in either the nivolumab or everolimus arm. AEs included in the model were hypertriglyceridemia and anemia; the unit cost per event was $US73.06 and $US3237.89, respectively [16, 17]. US-specific inputs related to costs (cost year, 2017) were disease manage-ment costs, drug acquisition costs, and unit adminis-tration costs ($US139.61 for nivolumab [18]; zero for everolimus because it is orally administered) and routine monitoring costs with the assumption of 1 oncologist visit every 4 weeks ($US79.67) (Additional file 1: Tables
80 90 100
40 50 60 70
0 10 20 30
Months
0 5 10 15 20 25 30 35 40 45 50
Nivolumab OS Everolimus OS Nivolumab KM data Everolimus KM data
Ov
erall su
rv
iv
al
(%
)
80 90 100
40 50 60 70
0 10 20 30
Months
Nivolumab PFS Everolimus PFS
Everolimus KM data Nivolumab KM data
Pr
ogressio
n-free
sur
vi
val (%
)
0 5 10 15 20 25 30 35 40 45 50
S1, S2) [19]. In CheckMate 025, 55% of patients treated with nivolumab and 63% of patients treated with everoli-mus received subsequent systemic therapy [5]. A sub-sequent treatment cost was applied as a one-off cost to patients entering the PD health state and was calculated based on therapies received by > 10 patients in Check-Mate 025 and an average of 3.65 months’ duration of treatment (Additional file 1: Table S3) [20].
Scenario and sensitivity analyses
Scenario, deterministic sensitivity, and probabilistic sen-sitivity analyses were conducted to assess the impact of uncertainty in model inputs on the outcomes. Two sce-nario analyses were carried out. First, a commonly used standard parametric distribution, a Weibull model, was independently fitted to everolimus and nivolumab OS data. Second, because CheckMate 025 had a significant number of patients treated post progression, the time to treatment discontinuation (TTD) data derived from CheckMate 025 were used in lieu of PFS data in the nivolumab arm to account for differences in PFS and observed TTD which may have resulted due to issues of pseudoprogression in the nivolumab cohort [21]. One-way deterministic sensitivity analyses were conducted with means and plausible ranges for each parameter
(Table 1). The following parameters were used: discount rate, body weight, costs, utilities, and clinical data.
Probabilistic sensitivity analysis was used to assess the variation in the model results from the uncertainty around each parameter in the model. Model param-eters were sampled from parametric distributions to generate 1000 estimates of the costs and effects in each treatment arm. A gamma distribution was adopted for all costs and resource utilization parameters and a beta distribution was used for the utilities and all prob-abilities [22]. Drug acquisition costs were exempt from the probabilistic analysis. For the parametric survival curves for PFS and OS, a multivariate normal distribu-tion with correladistribu-tion between curve parameters was used [22].
Results
Base‑case results
Over a 25-year horizon, treatment with nivolumab resulted in a quality-adjusted life-year (QALY) gain of 0.64 versus everolimus (Table 2).
Patients treated with nivolumab incurred higher costs, mainly associated with treatment acquisition, in part due to the increased time spent in the PF health state
(Table 2). The ICUR of $US51,714 per QALY gained
Table 1 Inputs for deterministic sensitivity analysis
PD, progressive disease health state; PF, progression-free health state a No associated infusion costs, as everolimus is administered orally
Parameter Mean (range)
Discount rate—costs, % 3 (0–6) Discount rate—outcomes, % 3 (0–6) Average body weight, kg 71.4 (57.1–85.7) Cost—PF state, $US 65.67 (52.53–78.80) Cost—PD state, $US 91.61 (73.29–109.93) Terminal cost, $US 10,713.01 (8570.41–12,855.61) Administration cost, $US
Nivolumab 139.61 (111.69–167.53) Everolimus Not applicablea Monitoring cost, $US
Nivolumab 79.67 (63.74–95.60) Everolimus 79.67 (63.74–95.60) Utility weight, PF, response
Nivolumab 0.895 (0.889–0.901) Everolimus 0.895 (0.889–0.901) Utility weight, PF, no response
Nivolumab 0.846 (0.840–0.852) Everolimus 0.846 (0.840–0.852) Utility weight, PD
Nivolumab 0.817 (0.811–0.823) Everolimus 0.817 (0.811–0.823)
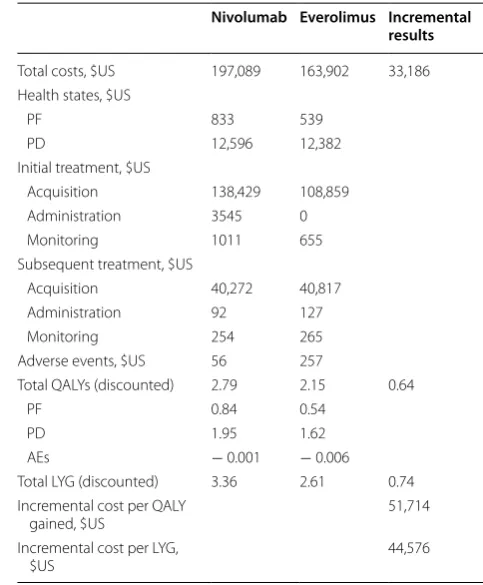
Table 2 Base-case results for the United States
AE, adverse event; LYG, life-year gained, PD; progressive disease health state; PF, progression-free health state; QALY, quality-adjusted life-year
Nivolumab Everolimus Incremental results
Total costs, $US 197,089 163,902 33,186 Health states, $US
PF 833 539
PD 12,596 12,382
Initial treatment, $US
Acquisition 138,429 108,859 Administration 3545 0 Monitoring 1011 655 Subsequent treatment, $US
Acquisition 40,272 40,817 Administration 92 127
Monitoring 254 265
Adverse events, $US 56 257
Total QALYs (discounted) 2.79 2.15 0.64
PF 0.84 0.54
PD 1.95 1.62
AEs − 0.001 − 0.006 Total LYG (discounted) 3.36 2.61 0.74 Incremental cost per QALY
gained, $US 51,714
Incremental cost per LYG,
versus everolimus, and an ICER of $US44,576 per life-years gained (LYG) versus everolimus, were estimated (Table 2). AE treatment costs were lower with nivolumab versus everolimus (Table 2).
Scenario analyses
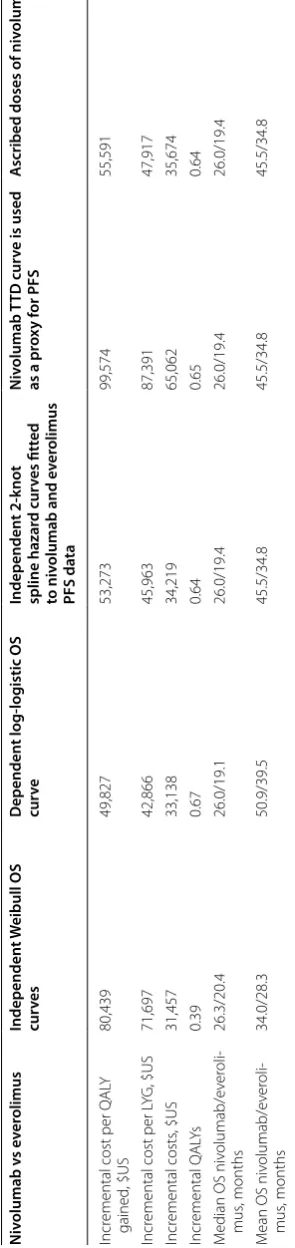
An investigation into the effect of parametric curve selection on costs, HRQoL, and survival was conducted using Weibull curves fitted separately to nivolumab and everolimus data. The incremental cost per QALY for nivolumab versus everolimus was $US80,439, and the incremental cost per LYG was $US71,697. Incremental costs for nivolumab versus everolimus were $US31,457 and incremental QALYs were 0.39 (Table 3). In a second scenario analysis, a TTD curve was used as proxy for PFS in the nivolumab arm only. When both costs and QALYs were calculated using TTD instead of PFS for nivolumab, the incremental cost per QALY for nivolumab versus everolimus was $US99,574 and the incremental cost per LYG was $US87,391. Incremental costs were $US65,062 and incremental QALYs were 0.65 (Table 3).
Deterministic and probabilistic sensitivity analyses
The average body weight had the greatest impact on the ICUR for nivolumab versus everolimus (base case
$US51,714; range $US8863–$US94,566; Fig. 2). The
ICUR was also sensitive to the discount rate for costs and outcomes (range $US42,771–$US63,179 and $US43,288– $US60,077, respectively). The ICUR did not change sub-stantially across the other parameters tested.
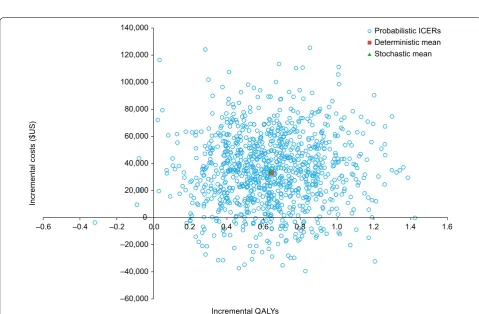
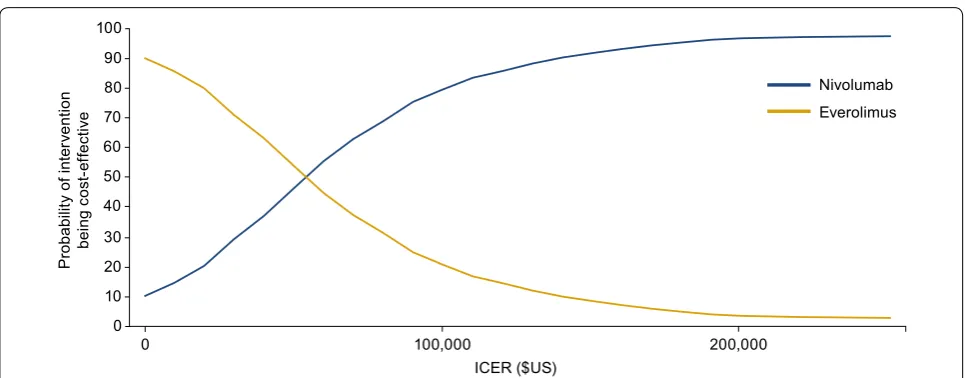
Probabilistic sensitivity analysis was conducted to assess the variation in the model results from the uncer-tainty around each parameter tested. The cost-effec-tiveness scatterplot for nivolumab versus everolimus is shown in Fig. 3.
At a willingness-to-pay threshold of $US150,000, nivolumab had a 91.7% probability of being cost-effective compared with everolimus alone in the base-case set-ting. At a willingness-to-pay threshold of $US200,000, nivolumab had a 96.7% probability of being cost-effective compared with everolimus (Fig. 4).
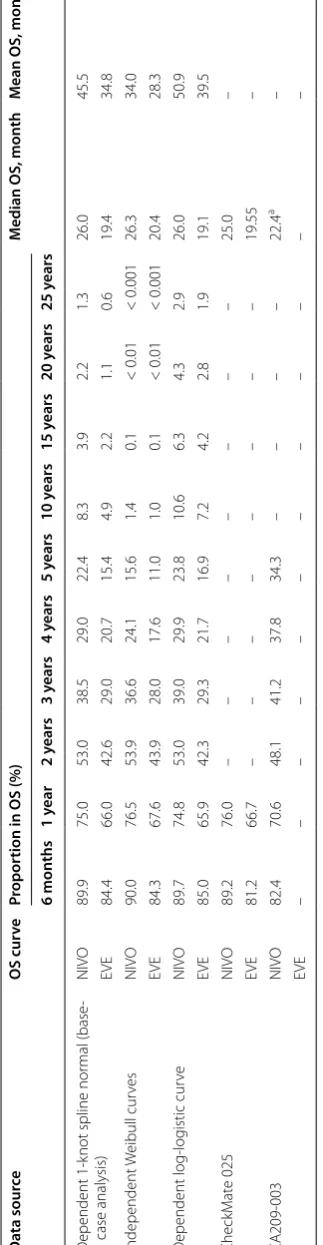
The best-fitting parametric survival models were vali-dated against observed data from CheckMate 025 (mini-mum follow-up, 26 months) and 60-month survival rates derived from the phase 1 CA209-003 study [5, 6]. Para-metric survival models match the Kaplan–Meier data from the clinical trials closely (Table 4).
Based on the observed 60-month OS rate with
nivolumab in CA209-003 (34.3%) [6], the 60-month OS
rate estimated using the base-case scenario (depend-ent 1-knot spline normal) may underestimate survival (22.4%) (Table 4). Scenarios using the dependent log-logistic (23.8%) and independent Weibull distributions
may also underestimate survival (15.6 and 11.0% for nivolumab and everolimus, respectively) compared with the observed 60-month OS rate in CA209-003 (Table 4).
Discussion
The results of the economic evaluation described here indicate that at a cost of $US2545.15 per 100-mg vial, nivolumab has an ICUR of $US51,714 per QALY gained over everolimus and an ICER of $US44,576 per LYG over everolimus. At a willingness-to-pay threshold of $US150,000, nivolumab had a 91.7% probability of being cost-effective compared with everolimus. The key drivers of cost-effectiveness were the survival inputs for OS and the average weight of patients, the latter having a direct effect on the drug acquisition cost of nivolumab. Valida-tion with long-term RCC survival data in the real-world setting is limited due to lack of data beyond 5 years. Although the dependent 1-knot spline normal is the best-fitting curve for OS observed in CheckMate 025 based on AIC and BIC criteria, the long-term projections indi-cate that the dependent log-logistic curves may provide a better fit, but are still a conservative assumption com-pared with CA209-003 5-year data. However, it should be noted that although CA209-003 provides long-term survival estimates, the trial population included previ-ously treated patients who received a range of doses of nivolumab [6], which may explain some of the differences in long-term survival versus CheckMate 025 projections.
For this economic evaluation, the wholesale acquisition cost of nivolumab was used. However, the actual price of nivolumab in the United States may be lower, accord-ing to price negotiations with pharmacies. Therefore, the results presented may be considered conservative.
Table
3
S
cenario analy
ses f
or
niv
olumab v
s e
ver
olimus
LY
G, lif
e-year gained; OS, o
ver
all sur
viv
al; PFS, pr
og
ression-fr
ee sur
viv
al; Q
AL
Y, qualit
y-adjust
ed lif
e-year
; T
TD
, time t
o tr
ea
tmen
t disc
on
tinua
tion
N
iv
olumab v
s ev
er
olimus
Independen
t W
eibull
OS
cur
ves
Dependen
t log
‑log
istic OS
cur
ve
Independen
t 2
‑k
not
spline hazar
d cur
ves fitt
ed
to
niv
olumab and
ev
er
olimus
PFS da
ta
N
iv
olumab
TTD cur
ve is used
as
a pr
ox
y f
or
PFS
A
scribed doses of
niv
olumab
Incr
emental cost per Q
AL
Y
gained
, $US
80,439
49,827
53,273
99,574
55,591
Incr
emental cost per L
YG, $US
71,697
42,866
45,963
87,391
47,917
Incr
emental costs
, $US
31,457
33,138
34,219
65,062
35,674
Incr
emental Q
AL
Ys
0.39
0.67
0.64
0.65
0.64
M
edian OS niv
olumab/e
ver
oli
-mus
, months
26.3/20.4
26.0/19.1
26.0/19.4
26.0/19.4
26.0/19.4
M
ean OS niv
olumab/e
ver
oli
-mus
, months
34.0/28.3
50.9/39.5
45.5/34.8
45.5/34.8
independent Weibull distributions for OS. The Weibull distribution resulted in a lower mean OS for nivolumab and everolimus and did not reflect the long-term sur-vival benefit of nivolumab observed in CA209-003, pro-viding much lower 60-month survival estimates versus
the dependent 1-knot spline normal survival function used in the base-case analysis. Wan et al. also used a less mature dataset from CheckMate 025, which may have resulted in a higher degree of uncertainty in longer-term OS extrapolations.
ICER ($US)
0 10,000 20,000 30,000 40,000 50,000 60,000 70,000 80,000 90,000 100,000
Terminal cost Cost - PF state Cost - PD state Monitoring cost - everolimus PF health-state utility, response - nivolumab PF health-state utility, no response - nivolumab Monitoring cost - nivolumab Administration cost - nivolumab PD health-state utility - nivolumab Discount rate - outcomes Discount rate - costs Average body weight
Higher Lower
Fig. 2 Deterministic sensitivity analysis. Orange bars represent the upper bound of each parameter varied. Blue bars represent the lower bound of each parameter varied. ICER, incremental cost-effectiveness ratio; PD, progressive disease; PF, progression-free
–60,000 –40,000 –20,000 0 20,000 40,000 60,000 80,000 100,000 120,000 140,000
–0.6 –0.4 –0.2 0.0 0.2 0.4 0.6 0.8 1.0 1.2 1.4 1.6
Probabilistic ICERs Deterministic mean Stochastic mean
Incremental QALYs
Incremental
co
sts
($
US
)
There are several limitations to our analysis that deserve consideration. The economic model utilizes PFS as a proxy for treatment duration. However, in the nivolumab arm, there were differences in the PFS and TTD curves, indicating that a proportion of patients were treated post progression. Some of those patients may have had pseu-doprogression, an observed phenomenon caused by the unconventional immune-related response that gives the initial appearance of progression [23]. Thus, the costs and benefits of nivolumab treatment may be underes-timated in the base-case analysis. The ICUR increased substantially when the TTD curve was used to calculate drug acquisition, drug administration, and monitoring costs for nivolumab; however, it is important to consider that the quality-of-life benefits associated with increased treatment duration on nivolumab were not captured in this scenario. In addition, only AEs with > 5% incidence at grade 3 or higher severity were included. This could underestimate the impact of AEs in the model because nivolumab has a more favorable tolerability profile than everolimus. However, it should be noted that AEs con-tributed to < 1% of the incremental costs of nivolumab versus everolimus. Finally, long-term extrapolation of OS curves from short-term clinical trials is always sub-ject to uncertainty, and hence should be validated against long-term data from other sources. However, long-term validation proved difficult due to a lack of real-world evi-dence for advanced RCC. Where data were available, the model was validated against long-term survival data and different parametric distributions for OS were tested in scenario analyses.
The standard dose of nivolumab for RCC was recently modified from 3 mg/kg every 2 weeks to 240 mg every 2 weeks [24] based on population pharmacokinetics and
dose/exposure–response analyses. A dose and sched-ule of 480 mg every 4 weeks is currently being explored, which may improve the cost-effectiveness of nivolumab in this patient population because fewer office visits would be needed for drug administration.
The results of the economic evaluation need to be con-sidered in the context of the high unmet need/poor sur-vival within previously treated advanced RCC [2]. The 5-year survival for metastatic RCC is 11.7% [3]. There is also a substantial cost of illness for metastatic RCC, with patients experiencing high out-of-pocket costs [25–27]. Effective strategies to reduce the prevalence and progres-sion of RCC have the potential to considerably reduce the economic burden. Studies on treatment sequence and schedule that may help to maximize benefit and optimize cost-effectiveness should be explored. Clinical data of nivolumab in previously treated patients with advanced RCC presents a compelling case that nivolumab rep-resents a “step-change” in disease management with improved OS, favorable tolerability, and improved quality of life compared with everolimus [5, 28].
At this juncture, physicians and payers alike are making second-line treatment decisions for patients with RCC with nivolumab and cabozantinib in mind. This analysis may be extended to an indirect comparison of cost-effec-tiveness of these two agents.
Conclusions
In addition to the known survival benefit, improved HRQoL, and favorable tolerability profile of nivolumab compared with everolimus, we also found nivolumab to be cost-effective for patients with advanced RCC at a $US150,000 per QALY threshold in the United States, even when taking into account the higher costs of initial
Probabilit
y of inte
rv
ention
bein
g
co
st
-e
ffecti
ve
80 90 100
40 50 60 70
0 10 20 30
ICER ($US)
0 100,000 200,000
Nivolumab Everolimus
Table 4 V alida tion of par ametric sur viv
al models f
or
OS
The median OS f
or 1 mg/kg dosing g
roup w
as 29.3 mon
ths; f
or 10 mg/kg dosing g
roup
, the median OS w
as 18.8 mon
ths EVE , ev er olimus; NIVO , niv
olumab; OS, o
ver
all sur
viv
al
a B
oth 1 and 10 mg/kg
Da ta sour ce OS cur ve Pr opor tion in OS (%) M
edian OS, mon
th
M
ean OS, mon
th 6 mon ths 1 y ear 2 y ears 3 y ears 4 y ears 5 y ears 10 y ears 15 y ears 20 y ears 25 y ears D ependent 1-k
not spline nor
treatment acquisition, administration, and monitoring. The model structure developed here may serve as a tem-plate for assessing cost-effectiveness of nivolumab in other countries and for comparison with other relevant treatments for second-line RCC.
Abbreviations
AE: adverse event; AIC: Akaike’s information criterion; BIC: Bayesian informa-tion criterion; EQ-5D: EuroQol-5 Dimensions; HRQoL: health-related quality of life; ICER: incremental cost-effectiveness ratio; ICUR: incremental cost-utility ratio; LYG: life-years gained; OS: overall survival; PD: progressive disease; PF: progression-free; PFS: progression-free survival; QALY: quality-adjusted life-year; RCC: renal cell carcinoma; TTD: time to treatment discontinuation.
Authors’ contributions
Conceptualization; formulation of overarching research goals and aims: JD and SY. Methodology; development or design of methodology, creation of models: CMC, SJ, SY and JD. Software; programming, software development; designing computer programs; implementation of the computer code and supporting algorithms; testing of existing code components: CMC and SJ. Validation; verification, whether as a part of the activity or separate, of the overall replication/reproducibility of results/experiments and other research outputs: CMC and SJ. Formal analysis; application of statistical, mathematical, computational, or other formal techniques to analyze or synthesize study data: CMC and SJ. Investigation; research and investigation process, specifically per-forming the experiments, or data/evidence collection: CMC and SJ. Resources; provision of study materials, reagents, materials, patients, laboratory samples, animals, instrumentation, computing resources, or other analysis tools: CMC, SJ, SY and JD. Data curation; management activities to annotate (produce metadata), scrub data and maintain research data (including software code, where it is necessary for interpreting the data itself ) for initial use and later re-use: CMC and SJ. Writing, original draft; preparation, creation and/or pres-entation of the published work, specifically writing the initial draft (including substantive translation): CMC and SJ. Writing, review and editing; preparation, creation and/or presentation of the published work by those from the original research group, specifically critical review, commentary or revision—including pre- or post-publication stages: CMC, SJ, SY and JD. Visualization; preparation, creation, and/or presentation of the published work, specifically visualization/ data presentation: CMC, SJ, SY and JD. Supervision; oversight and leadership responsibility for the research activity planning and execution, including men-torship external to the core team: JD and SY. Project administration; manage-ment and coordination responsibility for the research activity planning and execution: JD and SY. Funding acquisition; acquisition of the financial support for the project leading to this publication: JD and SY. All authors contributed to the manuscript. All authors read and approved the final manuscript.
Author details
1 Health Economic Modelling Unit, PAREXEL Access Consulting, Evergreen Building North, 160 Euston Road, London NW1 2DX, UK. 2 Bristol-Myers Squibb, Princeton, NJ, USA.
Acknowledgements
Medical writing assistance was provided by Jennifer Granit, Ph.D., of PPSI (a PAREXEL company), funded by Bristol-Myers Squibb.
Competing interests
Sukhvinder Johal and Charles McCrea are employees of PAREXEL Access Consulting. PAREXEL Access Consulting received consultancy fees from Bristol-Myers Squibb to develop the economic model and conduct analyses. Justin Doan and Shuo Yang are employees of and hold stock options in Bristol-Myers Squibb.
Additional file
Additional file 1. Additional tables.
Availability of data and materials
The model underlying this paper was developed in Excel. The model file is not publicly available as it contains additional calculations and results that are not yet in the public domain, but which will feature in future publications that build on this work. The full details of the model structure and derivation of inputs are presented in the paper and additional file.
Consent for publication
Not applicable.
Ethics approval and consent to participate
The CheckMate 025 study was approved by the institutional review board or an independent ethics committee at each center. Ethics approval was not required for the portion of the study described herein. Bristol-Myers Squibb acts as the overall guarantor for this work.
Funding
This work was sponsored by Bristol-Myers Squibb. The funders contributed to the design and conduct of the study; collection, management, analysis, and interpretation of the data; and preparation, review, and approval of the manuscript in collaboration with the authors of this report.
Publisher’s Note
Springer Nature remains neutral with regard to jurisdictional claims in pub-lished maps and institutional affiliations.
Received: 22 November 2017 Accepted: 2 February 2018
References
1. Siegel RL, Miller KD, Jemal A. Cancer statistics, 2017. CA Cancer J Clin. 2017;67:7–30.
2. Escudier B, Porta C, Schmidinger M, et al. Renal cell carcinoma: ESMO clinical practice guidelines for diagnosis, treatment and follow-up. Ann Oncol. 2016;27:v58–68.
3. Surveillance, Epidemiology, and End Results Program. SEER cancer stat facts: kidney and renal pelvis cancer. https://seer.cancer.gov/statfacts/ html/kidrp.html. Accessed 1 May 2017.
4. Shih YC, Chien CR, Xu Y, et al. Economic burden of renal cell carcinoma: part I—an updated review. Pharmacoeconomics. 2011;29:315–29. 5. Motzer RJ, Escudier B, McDermott DF, et al. Nivolumab versus everolimus
in advanced renal-cell carcinoma. N Engl J Med. 2015;373:1803–13. 6. McDermott DF, Motzer RJ, Atkins MB, et al. Long-term overall survival (OS)
with nivolumab in previously treated patients with advanced renal cell carcinoma (aRCC) from phase I and phase II studies. Presented at: 52nd Annual American Society of Clinical Oncology (ASCO) Meeting, 3–7 June 2016, Chicago, IL, USA, Abstract 4507.
7. Bohensky MA, Pasupathi K, Gorelik A, et al. A cost-effectiveness analysis of nivolumab compared with ipilimumab for the treatment of BRAF wild-type advanced melanoma in Australia. Value Health. 2016;19:1009–15. 8. Goeree R, Villeneuve J, Goeree J, et al. Economic evaluation of nivolumab
for the treatment of second-line advanced squamous NSCLC in Canada: a comparison of modeling approaches to estimate and extrapolate survival outcomes. J Med Econ. 2016;19:630–44.
9. Kohn CG, Zeichner SB, Chen Q, et al. Cost-effectiveness of immune check-point inhibition in BRAF wild-type advanced melanoma. J Clin Oncol. 2017;35:1194–202.
10. Matter-Walstra K, Schwenkglenks M, Aebi S, et al. A cost-effectiveness analysis of nivolumab versus docetaxel for advanced nonsquamous NSCLC including PD-L1 testing. J Thorac Oncol. 2016;11:1846–55. 11. Oh A, Tran DM, McDowell LC, et al. Cost-effectiveness of
nivolumab-ipili-mumab combination therapy compared with monotherapy for first-line treatment of metastatic melanoma in the United States. J Manag Care Spec Pharm. 2017;23:653–64.
• We accept pre-submission inquiries
• Our selector tool helps you to find the most relevant journal
• We provide round the clock customer support • Convenient online submission
• Thorough peer review
• Inclusion in PubMed and all major indexing services
• Maximum visibility for your research
Submit your manuscript at www.biomedcentral.com/submit
Submit your next manuscript to BioMed Central
and we will help you at every step:
Presented at: European Society for Medical Oncology (ESMO) Congress, 7–11 October 2016; Copenhagen, Denmark. Abstract 3163.
13. Wan XM, Peng LB, Ma JA, et al. Economic evaluation of nivolumab as a second-line treatment for advanced renal cell carcinoma from US and Chinese perspectives. Cancer. 2017;123:2634–41.
14. Latimer N. NICE DSU technical support document 14: survival analysis for economic evaluations alongside clinical trials—extrapolation with patient-level data. Sheffield: National Institute for Health and Clinical Excellence Decision Support Unit; 2014.
15. Wolters Kluwer Medi-Span PriceRx® database. https://pricerx.medispan. com/. Accessed July 2017.
16. Perrin A, Sherman S, Pal S, et al. Lifetime cost of everolimus vs axitinib in patients with advanced renal cell carcinoma who failed prior sunitinib therapy in the US. J Med Econ. 2015;18:200–9.
17. US Department of Labor. Consumer price index. https://www.bls.gov/ cpi/detailed-report.htm. Accessed July 2017.
18. Centers for Medicare and Medicaid Services. Physician fee schedule. HCPCS code: 96413, chemo IV infusion (1 hour)—non-facility price, national payment amount. 2015.
19. Centers for Medicare and Medicaid Services. Physician fee schedule. HCPCS code: 99205, office/outpatient visit new (facility price), national payment amount. 2015.
20. Motzer RJ, Porta C, Vogelzang NJ, et al. Dovitinib versus sorafenib for third-line targeted treatment of patients with metastatic renal cell carcinoma: an open-label, randomised phase 3 trial. Lancet Oncol. 2014;15:286–96.
21. Johal S, Santi I, Doan J, et al. Is RECIST-defined progression-free survival a meaningful endpoint in the era of immunotherapy? Presented at: Annual American Society of Clinical Oncology (ASCO) Genitourinary Cancers Symposium, 16–18 February 2017; Miami, FL, USA. Abstract 488. 22. Briggs AH, Claxton K, Sculpher MJ. Decision modelling for health
eco-nomic evaluation. Oxford: Oxford University Press; 2006.
23. Chiou VL, Burotto M. Pseudoprogression and immune-related response in solid tumors. J Clin Oncol. 2015;33:3541–3.
24. Opdivo (nivolumab) injection [prescribing information], revised July 2017. Princeton, NJ: Bristol-Myers Squibb Company; 2017.
25. Henk HJ, Chen C, Benedict A, et al. Retrospective claims analysis of best supportive care costs and survival in a US metastatic renal cell popula-tion. Clinicoecon Outcomes Res. 2013;5:347–54.
26. Hollenbeak CS, Nikkel LE, Schaefer EW, et al. Determinants of medicare all-cause costs among elderly patients with renal cell carcinoma. J Manag Care Pharm. 2011;17:610–20.
27. Kim SP, Gross C, Abouassaly R, et al. Out-of-pockets costs for patients receiving targeted agents for metastatic renal cell carcinoma. J Clin Oncol. 2014;32. Abstract e15598.