R E S E A R C H
Open Access
Availability of healthcare resources and
epithelial ovarian cancer stage of diagnosis
and mortality among Blacks and Whites
Swati Sakhuja
1, Huifeng Yun
1,2, Maria Pisu
2,3and Tomi Akinyemiju
1,2,4*Abstract
Background:The purpose of this study is to examine whether racial disparities in epithelial ovarian cancer stage at diagnosis and survival may be explained by geographic availability of healthcare resources among Blacks and Whites.
Methods:Data from the Surveillance, Epidemiology and End Results (SEER) database was used to identify White and Black women ages 40 years and above diagnosed with epithelial ovarian cancer between 2000 and 2010. Data on county-level availability of healthcare resources was obtained from the Area Resource File. Multi-level regression models, overall and stratified by race and age, were used to examine the associations of health care access (HCA) and socioeconomic status (SES) with stage at diagnosis while Cox proportional hazards models were used to examine the association with survival.
Results:Among 46,423 women diagnosed with epithelial ovarian cancer, Blacks were more likely to reside in counties with fewer average number of oncology hospitals (p< 0.05) and hospitals with ultrasound (p< 0.001), but higher number of medical doctors (p< 0.0001) and Ob/Gyn (p< 0.001). Black patients had higher odds of late stage diagnosis of epithelial ovarian cancer (OR: 1.13, 95% CI: 1.04–1.25) and higher risk of epithelial ovarian cancer mortality (HR: 1.25, 95% CI: 1.19–1.32) compared with White patients after accounting for differential availability of healthcare resources. Among Black patients, residing in counties with fewer medical doctors was associated with increased odds of late stage diagnosis (OR: 1.86, 95% CI: 1.10–3.13), and the racial disparity in late stage diagnosis and mortality was larger among patients ages <65 years compared with older patients.
Conclusion:Racial disparities in availability and utilization of healthcare resources likely contributes to adverse epithelial ovarian cancer outcomes among Black women in the US.
Keywords:Racial disparities, Ovarian cancer, Survival, Healthcare
Background
Ovarian cancer is the leading cause of death from gynecological malignancies in the US [1, 2] and the fifth most common cause of death among all cancer sites. [3, 4] There are over 22,000 incident cases and 15,000 deaths annually in the US, making it one of the most lethal cancers for women. [3] Prognosis of ovarian cancer mainly depends on stage at diagnosis, however screening
for ovarian cancer has not been proven to be an effective method for early detection. [5–7] Persistent racial, socio-economic (SES) and healthcare access (HCA) disparities exist in ovarian cancer outcomes, [8–10] suggesting that there may be differential access to potentially life-saving treatment strategies [11].
Studies examining disparities in ovarian cancer outcomes have observed that while SES is significantly associated with mortality, it does not fully explain racial disparities in receipt of treatment or mortality. [12, 13] Beyond SES, access to healthcare is another critical predictor of cancer treatment and survival. Healthcare access comprehensively defined incorporates aspects of availability, affordability, * Correspondence:tomiakin@uky.edu
1
Department of Epidemiology, University of Alabama at Birmingham, Birmingham, Alabama, USA
2Comprehensive Cancer Center, University of Alabama at Birmingham,
Birmingham, Alabama, USA
Full list of author information is available at the end of the article
accommodation, acceptability and accessibility. [14] Disparities in these components are also influenced by other socio-cultural factors, and even in equal access settings such as the Veteran’s Administration, racial disparities in accessibility and utilization of cancer care have been documented, [15–17] with Blacks more likely to experience barriers to care and worse health outcomes [17]. Geographic access to healthcare and utilization of care in relation to cancer outcomes is a relatively understud-ied and highly complex area of disparities research. It is also an essential factor for early diagnosis and receipt of high quality and timely treatment, elements critical for the survival of women with ovarian cancer. [11, 18] Prior studies have shown that the availability of healthcare resources has significant influence on health outcomes, including breast and colorectal cancer survival. [19–21] The influence of healthcare availability on health out-comes also appears to vary by race; a higher number of medical personnel and health facilities in US counties was observed not to be significantly associated with re-duced late stage presentation and longer survival for Black colorectal cancer patients, but was associated with improved outcomes for White colorectal cancer patients. [19, 21] Since Black women are more likely to present with late stage of disease and have higher mor-tality, despite lower ovarian cancer incidence compared with Whites, [22–25] examining if and how availability of healthcare resources influences ovarian cancer stage and mortality among Blacks and Whites may improve understanding of the causes of persistent racial dispar-ities, while highlighting potential areas for targeted intervention strategies.
In this paper, we examine racial disparities in availabil-ity of healthcare resources and association with epithelial ovarian cancer stage at diagnosis and survival among Blacks and Whites in the US.
Methods
Data Source and Study population: Data for this study was obtained from the National Cancer Institute Surveil-lance, Epidemiology and End Results (SEER) program using the SEER 18 Registries (excluding AK and Louisiana), Nov 2012 Submission - linked To County Attributes - Total U.S., 1969–2011 Counties plus Area Resource File (ARF-2008). SEER covers about 28% of the U.S. population, and includes detailed information for each cancer diagnosis on demographics, disease stage, histology, surgery of primary site, vital status and survival months. Eligibility criteria for this study includes White and Black adult women ages 40 years and above with a primary diagnosis of epithelial ovarian cancer represented in the registry and diagnosed between 2000 and 2010.
Outcome Variables:There were two primary outcomes of interest in this study: 1) Stage at diagnosis (excluding
in situ cases), defined as late stage (if distant) or early stage (if localized or regional) using SEER summary stage 2000 (1998+) variable; and 2) Survival defined as time in months from diagnosis to death due to epithelial ovarian cancer as identified in the SEER database.
Health Care Availability (HCA): Data on county level healthcare resources was obtained from the Area Health Resource File (AHRF) developed by the U.S Health Re-sources and Services Administration. Details can be ob-tained from: http://ahrf.hrsa.gov. We defined HCA using the following variables for the year 2005 per million population: number of hospitals, number of hospitals with oncology services, number of hospitals with ultra-sound services, number of Obstetricians/Gynecologists (OB/GYN), and number of physicians. The percent of individuals who have no health insurance was also in-cluded in the analysis, as this may influence the concentra-tion of hospitals, clinics or medical personnel in particular neighborhoods. County level data was utilized for this study since decisions on the location of healthcare re-sources such as hospitals and clinics often are often made at the county and/or municipal level.
Study Covariates: County level SES was included in the analysis and defined based on:percent of population with less than a 9th grade education and percent of fam-ilies living below the federal poverty level for the year 2000. Individual level data on histologic type using Inter-national Classification of Diseases for Oncology, Third Edition (ICD-O-3) codes [26]) and primary site-specific surgery were also included in the analysis as dichotomous variables based on information in the SEER database. The analysis focused on epithelial ovarian cancer, and other less common subtypes were excluded for analysis based on ICD-O-3 codes (i.e., 8000–8004, 8240–8245, 8590– 8670, 8800–8951 and 9060–9975).
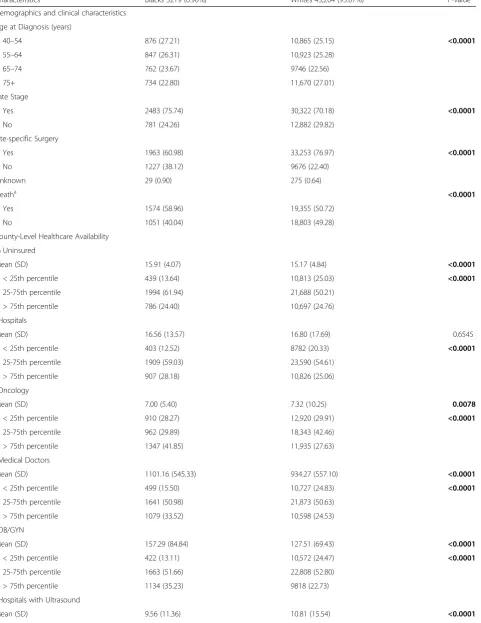
Table 1Socio-demographic and healthcare access characteristics of epithelial ovarian cancer patients by race/ethnicity, SEER 2000–2010
Characteristics Blacks 3219 (6.90%) Whites 43,204 (93.07%) P-value
Demographics and clinical characteristics
Age at Diagnosis (years)
40–54 876 (27.21) 10,865 (25.15) <0.0001
55–64 847 (26.31) 10,923 (25.28)
65–74 762 (23.67) 9746 (22.56)
75+ 734 (22.80) 11,670 (27.01)
Late Stage
Yes 2483 (75.74) 30,322 (70.18) <0.0001
No 781 (24.26) 12,882 (29.82)
Site-specific Surgery
Yes 1963 (60.98) 33,253 (76.97) <0.0001
No 1227 (38.12) 9676 (22.40)
Unknown 29 (0.90) 275 (0.64)
Deatha <0.0001
Yes 1574 (58.96) 19,355 (50.72)
No 1051 (40.04) 18,803 (49.28)
County-Level Healthcare Availability
% Uninsured
Mean (SD) 15.91 (4.07) 15.17 (4.84) <0.0001
< 25th percentile 439 (13.64) 10,813 (25.03) <0.0001
25-75th percentile 1994 (61.94) 21,688 (50.21)
> 75th percentile 786 (24.40) 10,697 (24.76)
b Hospitals
Mean (SD) 16.56 (13.57) 16.80 (17.69) 0.6545
< 25th percentile 403 (12.52) 8782 (20.33) <0.0001
25-75th percentile 1909 (59.03) 23,590 (54.61)
> 75th percentile 907 (28.18) 10,826 (25.06)
b Oncology
Mean (SD) 7.00 (5.40) 7.32 (10.25) 0.0078
< 25th percentile 910 (28.27) 12,920 (29.91) <0.0001
25-75th percentile 962 (29.89) 18,343 (42.46)
> 75th percentile 1347 (41.85) 11,935 (27.63)
b
Medical Doctors
Mean (SD) 1101.16 (545.33) 934.27 (557.10) <0.0001
< 25th percentile 499 (15.50) 10,727 (24.83) <0.0001
25-75th percentile 1641 (50.98) 21,873 (50.63)
> 75th percentile 1079 (33.52) 10,598 (24.53)
b OB/GYN
Mean (SD) 157.29 (84.84) 127.51 (69.43) <0.0001
< 25th percentile 422 (13.11) 10,572 (24.47) <0.0001
25-75th percentile 1663 (51.66) 22,808 (52.80)
> 75th percentile 1134 (35.23) 9818 (22.73)
b
Hospitals with Ultrasound
conducted consecutive multilevel regression model which allowed us to include random effects into the model thereby accounting for between-county variation and within-county correlation. To examine racial differ-ences in epithelial ovarian cancer survival, we examined time to ovarian cancer-related deaths using Cox pro-portional hazards models adjusting for both individual level (demographics, clinical) and county level (HCA, SES) variables and accounted for clustering. Patients were censored at the time of death, or end of follow-up (December 2013). Further, we assessed proportionality of hazards by plotting survival curves and using a time dependent predictor in the hazards model. All statis-tical analyses were conducted using SAS version 9.4.
Results
There were 46,423 Black and White women with epithe-lial ovarian cancer diagnosed from 2000 to 2010 in the SEER registry. Among these patients, 93.1% were White and 6.9% were Black (Table 1). Blacks were more likely to be diagnosed with epithelial ovarian cancer at a youn-ger age compared with Whites (Blacks: 27.2%, Whites: 25.2% ages 40–54, p-value: < 0.0001). Blacks were less likely to undergo site-specific surgery for epithelial ovarian cancer as compared to Whites (61.0% vs. 77.0%,
p-value: <0.0001). Black patients were more likely to live in counties with greater number of medical doctors (1101 vs. 934,p-value: < 0.0001), counties with greater number of Ob/Gyn (157 vs. 127,p-value: < 0.0001), but counties with fewer numbers of hospitals with ultrasound machines (9.6 vs. 10.8,p-value: < 0.0001) compared with Whites. In
addition, Black patients were more likely to reside in counties with a higher proportion of families living below the poverty level (43.0% vs. 22.8%,p-value: < 0.0001) com-pared with White patients.
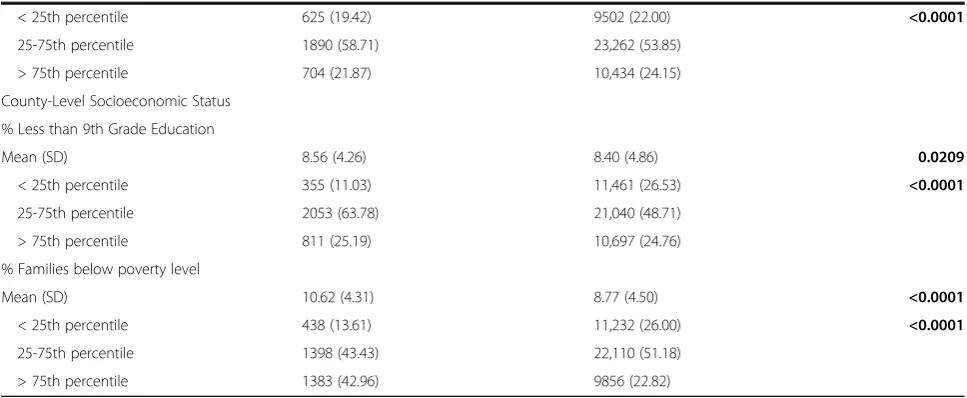
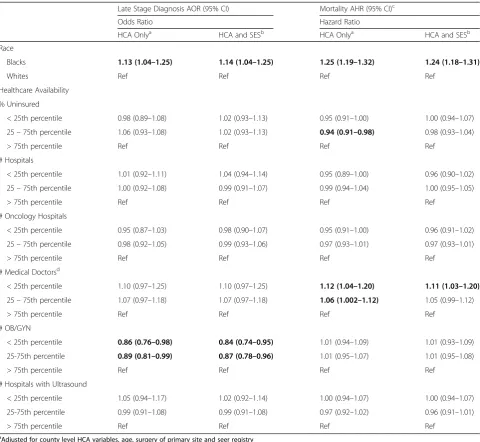
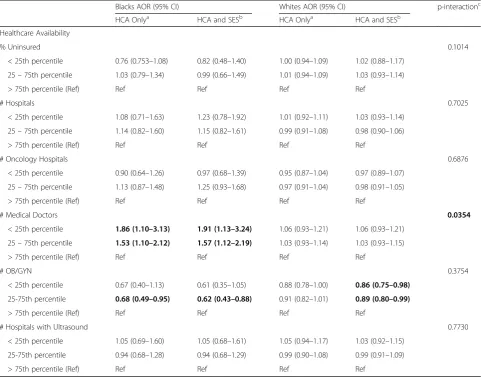
In multivariable adjusted models with HCA variables (Table 2), Blacks had 13% higher odds for late stage diagnosis of epithelial ovarian cancer (OR: 1.13, 95% CI: 1.04–1.25) compared with Whites. In the model adjust-ing for both HCA and SES, Blacks remained at 14% higher odds of late stage diagnosis (OR: 1.14, 95% CI: 1.04–1.25) and the interaction between race and number of medical doctors in the county was statistically signifi-cant (p value = 0.0354). Additionally, epithelial ovarian cancer mortality was 25% higher among Blacks compared with Whites in adjusted models with HCA variables (HR: 1.25, 95% CI: 1.19–1.32) as well as HCA and SES adjusted model (HR: 1.24, 95% CI: 1.18–1.31). Residing in counties with fewer medical doctors was independently associated with increased risk for mortality (HR: 1.12, 95% CI: 1.04– 1.20) and this association remained after additionally adjusting for SES (HR: 1.11, 95% CI: 1.03–1.20). Further, there was also a significant linear trend in the association between in-county number of medical doctors and epithe-lial ovarian cancer mortality (pvalue: <0.0001).
Among Black patients (Table 3), residing in counties with fewer medical doctors was associated with 86% in-creased odds of late stage diagnosis in the HCA only model (OR: 1.86, 95% CI: 1.10–3.13) and almost doubled the odds in the HCA and SES model (OR: 1.91, 95% CI: 1.13–3.24) compared with residing in the highest quartile. There were no significant associations between HCA and
Table 1Socio-demographic and healthcare access characteristics of epithelial ovarian cancer patients by race/ethnicity, SEER 2000–2010
(Continued)
< 25th percentile 625 (19.42) 9502 (22.00) <0.0001
25-75th percentile 1890 (58.71) 23,262 (53.85)
> 75th percentile 704 (21.87) 10,434 (24.15)
County-Level Socioeconomic Status
% Less than 9th Grade Education
Mean (SD) 8.56 (4.26) 8.40 (4.86) 0.0209
< 25th percentile 355 (11.03) 11,461 (26.53) <0.0001
25-75th percentile 2053 (63.78) 21,040 (48.71)
> 75th percentile 811 (25.19) 10,697 (24.76)
% Families below poverty level
Mean (SD) 10.62 (4.31) 8.77 (4.50) <0.0001
< 25th percentile 438 (13.61) 11,232 (26.00) <0.0001
25-75th percentile 1398 (43.43) 22,110 (51.18)
> 75th percentile 1383 (42.96) 9856 (22.82)
a
Ovarian cancer specific deaths only
b
per million population
odds of late stage diagnosis among Whites. There were also no significant associations with epithelial ovarian can-cer mortality in the HCA and SES models for Blacks. However, Whites residing in counties with fewer medical doctors experienced a 12% increased risk of epithelial ovarian cancer mortality in the HCA only (HR: 1.12, 95% CI: 1.04–1.21) and HCA and SES (HR: 1.12, 95% CI: 1.03– 1.21) models (Table 4).
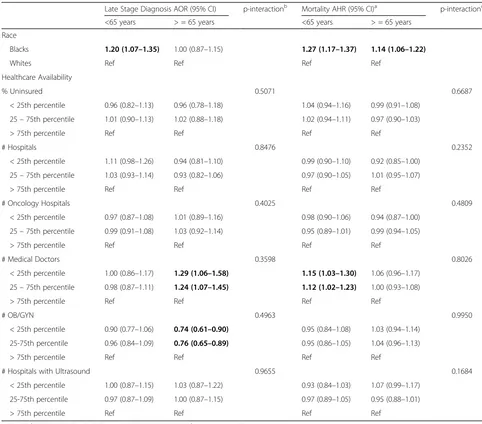
Among patients <65 years (Table 5), Blacks had a 20% higher odds of late stage diagnosis compared with Whites (OR: 1.20, 95% CI: 1.07–1.35), however, there was no ra-cial difference in stage at diagnosis observed among
patients ages 65 years and older. Although, women 65 years and older residing in county with fewer medical doctors had higher odds for late stage diagnosis compared to those living in county with higher number of medical doctors (OR: 1.29, 95% CI: 1.06–1.58), this association was reversed for those residing in counties with fewer number of Ob/Gyn (OR: 0.74, 95% CI: 0.61–0.90). Blacks had higher risk for epithelial ovarian cancer mortality than Whites in both age groups (<65 years HR: 1.27, 95% CI: 1.17–1.37) and (65 years and older HR: 1.14, 95% CI: 1.06–1.22), although the disparity was larger in the <65 years age group.
Table 2Multivariable adjusted analysis for late-stage epithelial ovarian cancer diagnosis and mortality, SEER 2000–2010
Late Stage Diagnosis AOR (95% CI) Mortality AHR (95% CI)c
Odds Ratio Hazard Ratio
HCA Onlya HCA and SESb HCA Onlya HCA and SESb
Race
Blacks 1.13 (1.04–1.25) 1.14 (1.04–1.25) 1.25 (1.19–1.32) 1.24 (1.18–1.31)
Whites Ref Ref Ref Ref
Healthcare Availability
% Uninsured
< 25th percentile 0.98 (0.89–1.08) 1.02 (0.93–1.13) 0.95 (0.91–1.00) 1.00 (0.94–1.07)
25–75th percentile 1.06 (0.93–1.08) 1.02 (0.93–1.13) 0.94 (0.91–0.98) 0.98 (0.93–1.04)
> 75th percentile Ref Ref Ref Ref
# Hospitals
< 25th percentile 1.01 (0.92–1.11) 1.04 (0.94–1.14) 0.95 (0.89–1.00) 0.96 (0.90–1.02)
25–75th percentile 1.00 (0.92–1.08) 0.99 (0.91–1.07) 0.99 (0.94–1.04) 1.00 (0.95–1.05)
> 75th percentile Ref Ref Ref Ref
# Oncology Hospitals
< 25th percentile 0.95 (0.87–1.03) 0.98 (0.90–1.07) 0.95 (0.91–1.00) 0.96 (0.91–1.02)
25–75th percentile 0.98 (0.92–1.05) 0.99 (0.93–1.06) 0.97 (0.93–1.01) 0.97 (0.93–1.01)
> 75th percentile Ref Ref Ref Ref
# Medical Doctorsd
< 25th percentile 1.10 (0.97–1.25) 1.10 (0.97–1.25) 1.12 (1.04–1.20) 1.11 (1.03–1.20)
25–75th percentile 1.07 (0.97–1.18) 1.07 (0.97–1.18) 1.06 (1.002–1.12) 1.05 (0.99–1.12)
> 75th percentile Ref Ref Ref Ref
# OB/GYN
< 25th percentile 0.86 (0.76–0.98) 0.84 (0.74–0.95) 1.01 (0.94–1.09) 1.01 (0.93–1.09)
25-75th percentile 0.89 (0.81–0.99) 0.87 (0.78–0.96) 1.01 (0.95–1.07) 1.01 (0.95–1.08)
> 75th percentile Ref Ref Ref Ref
# Hospitals with Ultrasound
< 25th percentile 1.05 (0.94–1.17) 1.02 (0.92–1.14) 1.00 (0.94–1.07) 1.00 (0.94–1.07)
25-75th percentile 0.99 (0.91–1.08) 0.99 (0.91–1.08) 0.97 (0.92–1.02) 0.96 (0.91–1.01)
> 75th percentile Ref Ref Ref Ref
a
Adjusted for county level HCA variables, age, surgery of primary site and seer registry
b
Adjusted for county level HCA and SES variables, age, surgery of primary site and seer registry
c
Additionally adjusted for late stage diagnosis
d
Discussion
Using the population-based SEER registry to analyze data on epithelial ovarian cancer patients and linked county level information on availability of healthcare resources and SES, we observed significant racial differences in the availability of healthcare resources among epithelial ovar-ian cancer patients in the US. Compared to White pa-tients, Black patients resided in counties with lower health insurance coverage, fewer numbers of oncology hospitals, and fewer numbers of hospitals with ultrasound machines. However, they resided in counties with a higher number of medical doctors and OB/Gyn specialists. We observed that accounting for these differences, in addition to clinical and histologic variables, did not eliminate racial dispar-ities in late stage diagnosis or mortality with epithelial ovarian cancer, even though timely diagnosis and
high-quality treatment of epithelial ovarian cancer are most likely dependent on specialty-trained surgeons and healthcare centers with multidisciplinary oncologic care and ultrasound equipment. [27, 28] We observed that among Blacks, residing in counties with fewer medical doctors doubled the odds of late stage diagnosis, however, none of the HCA variables were independently associated with stage at diagnosis for Whites. In contrast, none of the HCA variables independently predicted epithelial ovarian cancer mortality among Blacks, but residing in counties with fewer medical doctors was associated with increased risk of epithelial ovarian cancer mortality among Whites. These results suggest that access to healthcare is a much more complex issue beyond only availability of re-sources, and racial differences may exist in terms of other aspects of access to care, e.g., accessibility,
Table 3Multivariable adjusted odds ratios for late-stage epithelial ovarian cancer diagnosis by race, SEER 2000–2010
Blacks AOR (95% CI) Whites AOR (95% CI) p-interactionc
HCA Onlya HCA and SESb HCA Onlya HCA and SESb
Healthcare Availability
% Uninsured 0.1014
< 25th percentile 0.76 (0.753–1.08) 0.82 (0.48–1.40) 1.00 (0.94–1.09) 1.02 (0.88–1.17)
25–75th percentile 1.03 (0.79–1.34) 0.99 (0.66–1.49) 1.01 (0.94–1.09) 1.03 (0.93–1.14)
> 75th percentile (Ref) Ref Ref Ref Ref
# Hospitals 0.7025
< 25th percentile 1.08 (0.71–1.63) 1.23 (0.78–1.92) 1.01 (0.92–1.11) 1.03 (0.93–1.14)
25–75th percentile 1.14 (0.82–1.60) 1.15 (0.82–1.61) 0.99 (0.91–1.08) 0.98 (0.90–1.06)
> 75th percentile (Ref) Ref Ref Ref Ref
# Oncology Hospitals 0.6876
< 25th percentile 0.90 (0.64–1.26) 0.97 (0.68–1.39) 0.95 (0.87–1.04) 0.97 (0.89–1.07)
25–75th percentile 1.13 (0.87–1.48) 1.25 (0.93–1.68) 0.97 (0.91–1.04) 0.98 (0.91–1.05)
> 75th percentile (Ref) Ref Ref Ref Ref
# Medical Doctors 0.0354
< 25th percentile 1.86 (1.10–3.13) 1.91 (1.13–3.24) 1.06 (0.93–1.21) 1.06 (0.93–1.21)
25–75th percentile 1.53 (1.10–2.12) 1.57 (1.12–2.19) 1.03 (0.93–1.14) 1.03 (0.93–1.15)
> 75th percentile (Ref) Ref Ref Ref Ref
# OB/GYN 0.3754
< 25th percentile 0.67 (0.40–1.13) 0.61 (0.35–1.05) 0.88 (0.78–1.00) 0.86 (0.75–0.98)
25-75th percentile 0.68 (0.49–0.95) 0.62 (0.43–0.88) 0.91 (0.82–1.01) 0.89 (0.80–0.99)
> 75th percentile (Ref) Ref Ref Ref Ref
# Hospitals with Ultrasound 0.7730
< 25th percentile 1.05 (0.69–1.60) 1.05 (0.68–1.61) 1.05 (0.94–1.17) 1.03 (0.92–1.15)
25-75th percentile 0.94 (0.68–1.28) 0.94 (0.68–1.29) 0.99 (0.90–1.08) 0.99 (0.91–1.09)
> 75th percentile (Ref) Ref Ref Ref Ref
a
Adjusted for age, surgery of primary site and seer registry
b
Additionally adjusted for SES variables
c
For interaction terms between race and each HCA variable # Number per million population
availability, affordability, accommodation and acceptabil-ity, with potentially significant consequences for epithelial ovarian cancer outcomes as well as racial disparities.
Ovarian cancer is one of the most lethal gynecologic cancers [2] with 5-year survival rates of less than 50% after initial diagnosis. [4] Early diagnosis when the tumor is localized to the ovaries is the most important prognostic factor in treatment planning and improvement of survival of these patients. [4, 29] However, early diagnosis of ovarian cancer remains difficult as the disease is often asymptom-atic [30] or presents with non-specific symptoms such as back pain, fatigue, constipation or abdominal pain/bloating, which are rarely gynecologic in nature. [31–33] Routine screening for ovarian cancer is currently not recommended except for high-risk groups of women with a genetic predis-position or family history of ovarian or breast cancer. [34] However, a study by Smith et al. using the Medicare linked
California SEER database showed that women ages 68 years and older with recent diagnosis of ovarian cancer were more likely to have received clinical evaluations for non-specific abdominal symptoms 6 months before the diagnosis. [35] As ovarian cancer progresses very rapidly [36], this window may be especially crucial in early detec-tion of ovarian cancer. Despite the current lack of highly sensitive screening approaches, improved access to health-care resources is still a critical factor in early diagnosis and timely and accurate treatment of ovarian cancer, as specialized physicians and ultrasound imaging will be required for definitive diagnosis, timely treatment and improved outcomes.
Differential access to high quality healthcare remains a significant public health issue and contributes to sus-tained racial differences in cancer outcomes. Other stud-ies have shown that multiple factors beyond individual
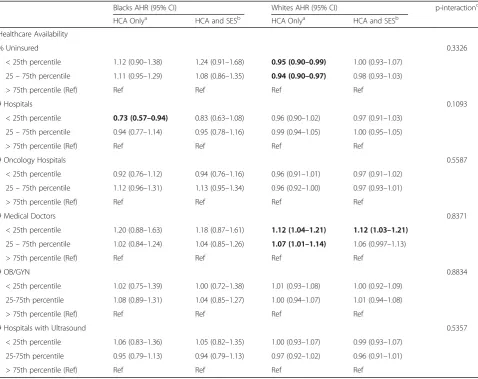
Table 4Multivariable adjusted hazards ratios for epithelial ovarian cancer mortality by race, SEER 2000–2010
Blacks AHR (95% CI) Whites AHR (95% CI) p-interactionc
HCA Onlya HCA and SESb HCA Onlya HCA and SESb
Healthcare Availability
% Uninsured 0.3326
< 25th percentile 1.12 (0.90–1.38) 1.24 (0.91–1.68) 0.95 (0.90–0.99) 1.00 (0.93–1.07)
25–75th percentile 1.11 (0.95–1.29) 1.08 (0.86–1.35) 0.94 (0.90–0.97) 0.98 (0.93–1.03)
> 75th percentile (Ref) Ref Ref Ref Ref
# Hospitals 0.1093
< 25th percentile 0.73 (0.57–0.94) 0.83 (0.63–1.08) 0.96 (0.90–1.02) 0.97 (0.91–1.03)
25–75th percentile 0.94 (0.77–1.14) 0.95 (0.78–1.16) 0.99 (0.94–1.05) 1.00 (0.95–1.05)
> 75th percentile (Ref) Ref Ref Ref Ref
# Oncology Hospitals 0.5587
< 25th percentile 0.92 (0.76–1.12) 0.94 (0.76–1.16) 0.96 (0.91–1.01) 0.97 (0.91–1.02)
25–75th percentile 1.12 (0.96–1.31) 1.13 (0.95–1.34) 0.96 (0.92–1.00) 0.97 (0.93–1.01)
> 75th percentile (Ref) Ref Ref Ref Ref
# Medical Doctors 0.8371
< 25th percentile 1.20 (0.88–1.63) 1.18 (0.87–1.61) 1.12 (1.04–1.21) 1.12 (1.03–1.21)
25–75th percentile 1.02 (0.84–1.24) 1.04 (0.85–1.26) 1.07 (1.01–1.14) 1.06 (0.997–1.13)
> 75th percentile (Ref) Ref Ref Ref Ref
# OB/GYN 0.8834
< 25th percentile 1.02 (0.75–1.39) 1.00 (0.72–1.38) 1.01 (0.93–1.08) 1.00 (0.92–1.09)
25-75th percentile 1.08 (0.89–1.31) 1.04 (0.85–1.27) 1.00 (0.94–1.07) 1.01 (0.94–1.08)
> 75th percentile (Ref) Ref Ref Ref Ref
# Hospitals with Ultrasound 0.5357
< 25th percentile 1.06 (0.83–1.36) 1.05 (0.82–1.35) 1.00 (0.93–1.07) 0.99 (0.93–1.07)
25-75th percentile 0.95 (0.79–1.13) 0.94 (0.79–1.13) 0.97 (0.92–1.02) 0.96 (0.91–1.01)
> 75th percentile (Ref) Ref Ref Ref Ref
a
Adjusted for age, surgery of primary site, late stage diagnosis and seer registry
b
Additionally adjusted for county level SES variables
c
For interaction terms between race and each HCA variable # Number per million population
health insurance status contribute to healthcare accessibil-ity and utilization, including factors relating to quantaccessibil-ity, quality, distance, as well as cultural attitudes towards healthcare. [37–40] Tracey et al. showed that that women with ovarian cancer treated in public general hospitals had higher mortality rates compared to those who were treated at a gynecological oncology service, and that distance from the specialized hospital played an important role in the de-cision making process for where to receive treatment. [41] Other studies have also demonstrated persistent racial dis-parities in equal access settings such as the VA system and other population based cohorts like Kaiser
Permanente-Research on Ovarian Cancer Survival (KP-ROCS) Cohort Study, with Blacks less likely to receive cancer treatment and more likely to die due to their disease compared with other racial groups. [17, 42] In the current study, we found that epithelial ovarian cancer mortality in Blacks was sig-nificantly higher than in Whites, consistent with previous studies. [13, 43] However, we did not find significant asso-ciations between any HCA variable and epithelial ovarian cancer mortality among Blacks, although reduced number of medical personnel at the county level was associated with higher mortality among Whites. This suggests that interventions to increase availability of medical doctors
Table 5Age-stratified multivariable adjusted analysis for late-stage epithelial ovarian cancer diagnosis and mortality, SEER 2000–2010
Late Stage Diagnosis AOR (95% CI) p-interactionb Mortality AHR (95% CI)a p-interactionc
<65 years > = 65 years <65 years > = 65 years
Race
Blacks 1.20 (1.07–1.35) 1.00 (0.87–1.15) 1.27 (1.17–1.37) 1.14 (1.06–1.22)
Whites Ref Ref Ref Ref
Healthcare Availability
% Uninsured 0.5071 0.6687
< 25th percentile 0.96 (0.82–1.13) 0.96 (0.78–1.18) 1.04 (0.94–1.16) 0.99 (0.91–1.08)
25–75th percentile 1.01 (0.90–1.13) 1.02 (0.88–1.18) 1.02 (0.94–1.11) 0.97 (0.90–1.03)
> 75th percentile Ref Ref Ref Ref
# Hospitals 0.8476 0.2352
< 25th percentile 1.11 (0.98–1.26) 0.94 (0.81–1.10) 0.99 (0.90–1.10) 0.92 (0.85–1.00)
25–75th percentile 1.03 (0.93–1.14) 0.93 (0.82–1.06) 0.97 (0.90–1.05) 1.01 (0.95–1.07)
> 75th percentile Ref Ref Ref Ref
# Oncology Hospitals 0.4025 0.4809
< 25th percentile 0.97 (0.87–1.08) 1.01 (0.89–1.16) 0.98 (0.90–1.06) 0.94 (0.87–1.00)
25–75th percentile 0.99 (0.91–1.08) 1.03 (0.92–1.14) 0.95 (0.89–1.01) 0.99 (0.94–1.05)
> 75th percentile Ref Ref Ref Ref
# Medical Doctors 0.3598 0.8026
< 25th percentile 1.00 (0.86–1.17) 1.29 (1.06–1.58) 1.15 (1.03–1.30) 1.06 (0.96–1.17)
25–75th percentile 0.98 (0.87–1.11) 1.24 (1.07–1.45) 1.12 (1.02–1.23) 1.00 (0.93–1.08)
> 75th percentile Ref Ref Ref Ref
# OB/GYN 0.4963 0.9950
< 25th percentile 0.90 (0.77–1.06) 0.74 (0.61–0.90) 0.95 (0.84–1.08) 1.03 (0.94–1.14)
25-75th percentile 0.96 (0.84–1.09) 0.76 (0.65–0.89) 0.95 (0.86–1.05) 1.04 (0.96–1.13)
> 75th percentile Ref Ref Ref Ref
# Hospitals with Ultrasound 0.9655 0.1684
< 25th percentile 1.00 (0.87–1.15) 1.03 (0.87–1.22) 0.93 (0.84–1.03) 1.07 (0.99–1.17)
25-75th percentile 0.97 (0.87–1.09) 1.00 (0.87–1.15) 0.97 (0.89–1.05) 0.95 (0.88–1.01)
> 75th percentile Ref Ref Ref Ref
Adjusted for county level HCA and SES variables, age, surgery of primary site and seer registry
a
Additionally adjusted for late stage diagnosis
b
For interaction terms between age and each HCA variable with late stage diagnosis as outcome
c
For interaction terms between age and each HCA variable with ovarian cancer mortality as outcome # Number per million population
may help to improve epithelial ovarian cancer outcomes among Whites, while more work is needed to identify factors that mediate the association between availability of healthcare resources, utilization of such resources and epithelial ovarian cancer outcomes among Blacks.
The strength of the study is the use of the population-based SEER registry to assess epithelial ovarian cancer outcomes and examination of county-level availability of healthcare resources and socio-economic status among Black and White women, the two racial groups with the largest disparity. The analysis is strengthened by the use of multi-level modeling to account for correlations between individuals residing in the same county. The analysis focused on the most common subtype of ovar-ian cancer- epithelial ovarovar-ian cancer- which accounted for 86% of cases in Blacks and 90% of cases in Whites, and we observed consistent results when additionally adjusted for histology. There are also several limitations in this study. First, the use of a county as a geographic unit, which is a relatively large geographical area may have resulted in residual confounding if county availability of health care resources does not fully capture the vari-ation in HCA available to individuals. However, analysis of major community resources such as hospitals usually requires larger geographic units of analysis, as they are primarily considered at the municipal, county or state level, and considering smaller geographic areas would have resulted in a large number of geographic regions with missing data. Second, we were unable to adjust for individual level SES variables since these are not present in the SEER database, and instead included area level SES in our models. Further, SEER does not include data on comorbidities, which precluded us from accounting for differential health status of patients at diagnosis which may impact mortality. Lastly, the SEER registry does not provide detailed data on adjuvant chemotherapy or detailed information on timing of sur-gery, and we also lacked data on the presence of re-sidual disease following debulking or cytoreductive surgery. Due to these limitations, we were unable to ac-count for potential racial differences in the quality of actual treatment received, another important factor for survival although we were able to adjust for the receipt of site-specific surgery.
Conclusion
In conclusion, this study provides evidence that racial/ ethnic disparities exist in the availability of healthcare re-sources among epithelial ovarian cancer patients, and these influence stage of diagnosis and survival. For Black patients, more research is needed to better understand the factors predicting utilization of existing healthcare resources, and if these influence healthcare outcomes. Further research on other dimensions of healthcare
access such as acceptability, accessibility and affordabil-ity may inform efforts to increase utilization of existing re-sources among Black and White cancer patients, eliminating the persistent racial disparity in late stage diag-nosis, and ultimately improving survival for all patients.
Abbreviations
AHRF:Area Health Resource File; ANOVA: Analysis of variance test; HCA: Healthcare access; NH: Non-Hispanic; OB/GYN: Obstetricians/ Gynecologists; SEER: Surveillance, Epidemiology and End Results; SES: Socio-economic status; VA: Veteran Administration
Acknowledgements None
Funding Not applicable
Availability of data and materials
The datasets analyzed during the current study are available in the SEER repository, and can be obtained from: https://seer.cancer.gov. Data on county level healthcare resources was obtained from the Area Health Resource File (AHRF) developed by the U.S Health Resources and Services Administration. Details can be obtained from: http://ahrf.hrsa.gov.
Authors’contributions
SS conducted statistical analysis and drafted the manuscript. HY and MP contributed to the conceptualization and drafting of the manuscript. TA oversaw the study conceptualization, statistical analysis and manuscript writing. All authors read and approved the final manuscript.
Ethics approval and consent to participate
This study was considered exempt by the Institutional Review Board at the University of Alabama at Birmingham, as the SEER database is a publicly available and non-identifiable secondary data source.
Consent for publication Not applicable
Competing interests
The authors declare that they have no competing interests.
Publisher’s Note
Springer Nature remains neutral with regard to jurisdictional claims in published maps and institutional affiliations.
Author details 1
Department of Epidemiology, University of Alabama at Birmingham, Birmingham, Alabama, USA.2Comprehensive Cancer Center, University of Alabama at Birmingham, Birmingham, Alabama, USA.3Division of Preventive Medicine, University of Alabama at Birmingham, Birmingham, Alabama, USA. 4
Department of Epidemiology, University of Kentucky, Lexington, Kentucky, USA.
Received: 26 April 2017 Accepted: 7 August 2017
References
1. CDC: Ovarian Cancer Statistics. In.; 2016.
2. Cancer facts & figures 2016. In.: American Cancer Society; 2016.
3. Siegel RL, Miller KD, Jemal A. Cancer statistics, 2016. CA Cancer J Clin. 2016; 66(1):7–30.
4. Lo Nigro C, Ricci V, Vivenza D, Granetto C, Fabozzi T, Miraglio E, Merlano MC. Prognostic and predictive biomarkers in metastatic colorectal cancer anti-EGFR therapy. World J Gastroenterol. 2016;22(30):6944–54. 5. Liede A, Karlan BY, Baldwin RL, Platt LD, Kuperstein G, Narod SA. Cancer
6. NIH consensus conference. Ovarian cancer. Screening, treatment, and follow-up. NIH consensus development panel on ovarian cancer. JAMA. 1995;273(6):491–7.
7. Paley PJ. Screening for the major malignancies affecting women: current guidelines. Am J Obstet Gynecol. 2001;184(5):1021–30.
8. Collins Y, Holcomb K, Chapman-Davis E, Khabele D, Farley JH. Gynecologic cancer disparities: a report from the health disparities taskforce of the Society of Gynecologic Oncology. Gynecol Oncol. 2014;133(2):353–61. 9. Chatterjee S, Gupta D, Caputo TA, Holcomb K. Disparities in Gynecological
Malignancies. Frontiers Oncol. 2016;6.
10. O’Keefe EB, Meltzer JP, Bethea TN, et al. Health Disparities and Cancer: Racial Disparities in Cancer Mortality in the United States, 2000–2010. Frontiers Public Health. 2015;3.
11. Barnholtz-Sloan JS, Schwartz AG, Qureshi F, Jacques S, Malone J, Munkarah AR. Ovarian cancer: changes in patterns at diagnosis and relative survival over the last three decades. Am J Obstet Gynecol. 2003;189(4):1120–7. 12. Harlan LC, Clegg LX, Trimble EL. Trends in surgery and chemotherapy for
women diagnosed with ovarian cancer in the United States. J Clin Oncol. 2003;21(18):3488–94.
13. Harlan LC, Greene AL, Clegg LX, Mooney M, Stevens JL, Brown ML. Insurance status and the use of guideline therapy in the treatment of selected cancers. J Clin Oncol. 2005;23(36):9079–88.
14. Penchansky R, Thomas JW. The concept of access: definition and relationship to consumer satisfaction. Med Care. 1981;19(2):127–40. 15. Saha S, Freeman M, Toure J, Tippens KM, Weeks C, Ibrahim S. Racial and
ethnic disparities in the VA health care system: a systematic review. J Gen Intern Med. 2008;23(5):654–71.
16. Dominitz JA, Maynard C, Billingsley KG, Boyko EJ. Race, treatment, and survival of veterans with cancer of the distal esophagus and gastric cardia. Med Care. 2002;40(1 Suppl):I14–26.
17. Samuel CA, Landrum MB, McNeil BJ, Bozeman SR, Williams CD, Keating NL. Racial disparities in cancer Care in the Veterans Affairs Health Care System and the role of site of care. Am J Public Health. 2014;104(Suppl 4):S562–71. 18. Schulz AJ, Israel BA, Zenk SN, Parker EA, Lichtenstein R, Shellman-Weir S,
Klem AB. Psychosocial stress and social support as mediators of relationships between income, length of residence and depressive symptoms among African American women on Detroit's eastside. Soc Scie Med (1982). 2006;62(2):510–22.
19. Akinyemiju T, Moore JX, Altekruse SF. Breast cancer survival in African-American women by hormone receptor subtypes. Breast Cancer Res Treat. 2015;153(1):211–8.
20. Keegan TH, Kurian AW, Gali K, Tao L, Lichtensztajn DY, Hershman DL, Habel LA, Caan BJ, Gomez SL. Racial/ethnic and socioeconomic differences in short-term breast cancer survival among women in an integrated health system. Am J Public Health. 2015;105(5):938–46.
21. Akinyemiju T, Waterbor JW, Pisu M, Moore JX, Altekruse SF. Availability of healthcare resources and colorectal cancer outcomes among non-Hispanic white and non-Hispanic black adults. J Community Health. 2016;41(2):296–304. 22. Chan JK, Zhang M, Hu JM, Shin JY, Osann K, Kapp DS. Racial disparities in
surgical treatment and survival of epithelial ovarian cancer in United States. J Surg Oncol. 2008;97(2):103–7.
23. Cress RD, O'Malley CD, Leiserowitz GS, Campleman SL. Patterns of chemotherapy use for women with ovarian cancer: a population-based study. J Clin Oncol. 2003;21(8):1530–5.
24. Morris CR, Sands MT, Smith LH. Ovarian cancer: predictors of early-stage diagnosis. Cancer Causes Control. 2010;21(8):1203–11.
25. Moorman PG, Palmieri RT, Akushevich L, Berchuck A, Schildkraut JM. Ovarian cancer risk factors in African-American and white women. Am J Epidemiol. 2009;170(5):598–606.
26. ICD-0-3 SEER Site/Histology Validation List [http://seer.cancer.gov/icd-o-3/]. Accessed 24 July 2017.
27. Kumpulainen S, Sankila R, Leminen A, Kuoppala T, Komulainen M, Puistola U, Hurme S, Hiekkanen H, Makinen J, Grenman S. The effect of hospital operative volume, residual tumor and first-line chemotherapy on survival of ovarian cancer - a prospective nation-wide study in Finland. Gynecol Oncol. 2009;115(2):199–203.
28. Cohen L, Fishman DA. Ultrasound and ovarian cancer. Cancer Treat Res. 2002;107:119–32.
29. Prat J. Staging classification for cancer of the ovary, fallopian tube, and peritoneum. Int J Gynaecol Obstet. 2014;124(1):1–5.
30. Clement KD, Connor PD. Tumors of the female reproductive organs. In: Taylor RB, David AK, Johnson TA, Phillips DM, Scherger JE, editors. Family medicine: principles and practice. New York: Springer New York; 1998. p. 916–24.
31. Olson SH, Mignone L, Nakraseive C, Caputo TA, Barakat RR, Harlap S. Symptoms of ovarian cancer. Obstet Gynecol. 2001;98(2):212–7. 32. Goff BA, Mandel LS, Drescher CW, Urban N, Gough S, Schurman KM, Patras
J, Mahony BS, Andersen MR. Development of an ovarian cancer symptom index: possibilities for earlier detection. Cancer. 2007;109(2):221–7. 33. Goff BA, Mandel LS, Melancon CH, Muntz HG. Frequency of symptoms of
ovarian cancer in women presenting to primary care clinics. JAMA. 2004; 291(22):2705–12.
34. Doubeni CA, Doubeni AR, Myers AE. Diagnosis and Management of Ovarian Cancer. Am Fam Physician. 2016;93(11):937–44.
35. Smith LH, Morris CR, Yasmeen S, Parikh-Patel A, Cress RD, Romano PS. Ovarian cancer: can we make the clinical diagnosis earlier? Cancer. 2005; 104(7):1398–407.
36. Lengyel E. Ovarian cancer development and metastasis. Am J Pathol. 2010;177(3):1053–64.
37. Vaughan Sarrazin MS, Campbell ME, Richardson KK, Rosenthal GE. Racial segregation and disparities in health care delivery: conceptual model and empirical assessment. Health Sers Res. 2009;44(4):1424–44.
38. Thomas SB, Fine MJ, Ibrahim SA. Health disparities: the importance of culture and health communication. Am J Public Health. 2004;94(12):2050. 39. Syed ST, Gerber BS, Sharp LK. Traveling towards disease: transportation
barriers to health care access. J Community Health. 2013;38(5):976–93. 40. Becker G, Newsom E. Socioeconomic status and dissatisfaction with
health care among chronically ill African Americans. Am J Public Health. 2003;93(5):742–8.
41. Tracey E, Hacker NF, Young J, Armstrong BK. Effects of access to and treatment in specialist facilities on survival from epithelial ovarian cancer in Australian women: a data linkage study. Int J Gynecol Cancer. 2014;24(7):1232–40.
42. Bandera EV, Lee VS, Rodriguez-Rodriguez L, Powell CB, Kushi LH. Racial/ ethnic disparities in ovarian cancer treatment and survival. Clin Cancer Res. 2016;22(23):5909–14.
43. Bristow RE, Powell MA, Al-Hammadi N, Chen L, Miller JP, Roland PY, Mutch DG, Cliby WA. Disparities in ovarian cancer care quality and survival according to race and socioeconomic status. JNCI Journal of the National Cancer Institute. 2013;105(11):823–32.
• We accept pre-submission inquiries
• Our selector tool helps you to find the most relevant journal
• We provide round the clock customer support
• Convenient online submission
• Thorough peer review
• Inclusion in PubMed and all major indexing services • Maximum visibility for your research
Submit your manuscript at www.biomedcentral.com/submit