R E S E A R C H A R T I C L E
Open Access
Dioxins levels in human blood after
implementation of measures against dioxin
exposure in Japan
Basilua Andre Muzembo
1,5, Miyuki Iwai-shimada
1, Tomohiko Isobe
1, Kokichi Arisawa
2, Masayuki Shima
3,
Tetsuhito Fukushima
4and Shoji F. Nakayama
1*Abstract
Background:Over the past few decades, the Japanese Ministry of the Environment has been biomonitoring dioxins in the general Japanese population and, in response to public concerns, has taken measures to reduce dioxin exposure. The objectives of this study were to assess the current dioxin dietary intake and corresponding body burden in the Japanese and compare Japanese dioxin data from 2011 to 2016 and 2002–2010 surveys. We also examined the relationship between blood dioxins and health parameters/clinical biomarkers.
Methods:From 2011 to 2016, cross-sectional dioxin surveys were conducted on 490 Japanese (242 males and 248 females, aged 49.9 ± 7.6 years) from 15 Japanese prefectures. Blood (n= 490) and food samples (n= 90) were measured for 29 dioxin congeners including polychlorinated dibenzo-para-dioxins (PCDDs), polychlorinated dibenzofurans (PCDFs), and coplanar polychlorinated biphenyls (Co-PCBs) using gas chromatography coupled with high-resolution mass spectrometry. Using the 2006 World Health Organization toxic equivalence factors, the toxic equivalents (TEQs) were calculated. Clinical biomarkers and anthropometric parameters were also measured and information on lifestyle behaviours collected. Data imputations were applied to account for blood dioxins below the detection limit.
Results:The median (95% confidence interval or CI) blood levels and dioxin dietary intake was respectively 9.4 (8.8–9.9) pg TEQ/g lipid and 0.3 (0.2–0.4) pg TEQ/kg body weight/day. The median blood dioxin level in the 2011–2016 survey was found to have decreased by 41.3% compared to the 2002–2010 surveys. Participants who were older were found to be more likely to have higher dioxin levels. Blood dioxins were also significantly associated with body mass index, triglycerides, docosahexaenoic acid, eicosapentaenoic acid, and dihomo-gamma-linoleic acid levels in blood. Furthermore, associations between blood dioxin and dietary dioxin intake were evident in the unadjusted models. However, after adjusting for confounders, blood dioxins were not found to be associated with dietary dioxin intake. Conclusions:Blood dioxin levels declined over the past decade. This study showed that the measures and actions undertaken in Japan have possibly contributed to these reductions in the body burden of dioxins in the Japanese population.
Keywords: Coplanar polychlorinated biphenyls, Cross-sectional sample, Dietary dioxin intake, Dioxins, Polychlorinated dibenzo-p-dioxins, Polychlorinated dibenzofurans
* Correspondence:fabre@nies.go.jp
1Centre for Health and Environmental Risk Research, National Institute for
Environmental Studies, Tsukuba 305-8506, Japan
Full list of author information is available at the end of the article
© The Author(s). 2019Open AccessThis article is distributed under the terms of the Creative Commons Attribution 4.0
Introduction
Human exposure to persistent organic pollutants (POPs) such as dioxins has become a public health concern as these have been linked to serious health conditions such as cancer [1], diabetes and hypertension [2,3]. The gen-eric term 'dioxins' refers to polychlorinated dibenzo-para-dioxins (PCDDs), polychlorinated dibenzofurans (PCDFs) and dioxin-like coplanar polychlorinated biphe-nyls (Co-PCBs), all of which are by-products of waste in-cineration and chemical manufacturing processes [4]. Because of their environmental persistence and lipophi-licity, and the capacity to be carried long distances in the air before being deposited in water and soils, these environmental pollutants bio-accumulate in food and human bodies [5–7].
Most human dioxin exposure in Japan is because of food consumption and especially from the dioxins in fish and sea food [8]. Mass poisonings in Japan have been caused by dioxin-contaminated rice oil, which was called the Yusho oil disease [9], and from 1990 to 1997, ele-vated levels of dioxins from municipal solid waste incin-eration plants contaminated the soil surrounding the incinerator plants [7,10].
Recognising the public’s concerns with the high level of dioxin pollution, the Japanese government promul-gated regulations and implemented preventive mea-sures to reduce dioxin emissions from flue gases and sought to prevent the de novo formation of dioxins. These measures included a dioxins law related to
‘special measures against dioxins’ released in 1999 [11], improvements in incineration facilities, adequate waste management and recycling, the clean-up of soil contaminated with dioxins, and the detoxification and decomposition of dioxins [7, 11, 12], with most of these nationwide counter-measures being put in place by 2004. The Ministry of the Environment of Japan (MOEJ) reported that these regulatory efforts had re-sulted in a 95% decline in emitted dioxins (341 g TEQ; toxic equivalent) by 2004 and a further 98% reduction by 2010 (158–160 g TEQ) [12] compared to 1997 di-oxin emissions (7680 g TEQ) [13].
To further evaluate the effectiveness of its actions, the MOEJ has been biomonitoring dioxins in non-oc-cupationally exposed individuals. The main problem with dioxins is that they are lipophilic and can easily enter the food chain and, as they are resistant to deg-radation, remain in the environment. Because the public was concerned about the heightened dioxin levels found in Japan, the biomonitoring of dioxins and other chemicals was undertaken to evaluate the exposure and to prevent potentially adverse effects. From 2002 to 2010, the MOEJ conducted ‘the survey on the exposure to dioxins and other chemical compounds (including pesticides and plasticizers) in
humans’ (SEDOCCH) [2, 3, 8, 14–20] nationwide (SEDOCCH 2002–2010). The latter aimed to clarify the relationship between the dioxin dietary intake and corresponding body burden and other POPs in the Japanese general population. The results revealed that the dioxin dietary intake and corresponding TEQ di-oxins in the blood (median = 16 pg TEQ/g lipid) were associated with adverse health effects such as diabetes [2]. SEDOCCH 2002–2010 also found that blood and food dioxins had had an almost twofold decrease be-tween 2002 and 2010 and provided evidence-based data for MOEJ and researcher dioxins surveillance evaluations. Because of the public concern, the di-oxins biomonitoring project was continued every year from 2011 to 2016 (SEDOCCH 2011–2016).
The objectives of this study were to assess current blood dioxin levels and dietary intake of dioxins in Japa-nese from the 2011–2016 SEDOCCH data. We also sought to examine the relationship between blood di-oxins and health parameters/clinical biomarkers. In addition, data from the dioxins biomonitoring conducted from 2011 and 2016 (SEDOCCH 2011–2016) were com-pared to the results in the 2002–2010 SEDOCCH.
Methods Study population
Questionnaire
This study used the same health, lifestyle and food fre-quency questionnaires as used in the 2002–2010 SEDOCCH survey [16, 19, 20]. Briefly, a trained public health nurse or nutritionist administered the question-naire face-to-face. The questionquestion-naire had been sent to participants in advance for completion at home, after which the participants were invited to the local commu-nity centres for the interview. The core questionnaire gathered sociodemographic information, current health status and personal medical history (including medica-tion and diseases diagnoses such as cancer, diabetes, hypertension and hyperlipidaemia, residential history, occupational history, tobacco use and alcohol consump-tion). A semi-structured and open-ended question food frequency questionnaire was also used to collect infor-mation on food group intake frequency, in which the frequencies for 41 foods, food groups, menus and bever-ages during the previous month were recorded. For ex-ample, fish consumption frequency was reported in categorical format using the following eight choices: (1) Not at all, (2) 1–3 times per month, (3) 1–2 times per week, (4) 3–4 times per week, (5) 5–6 times per week, (6) once per week, (7) twice per day and (8) 3 times or greater per day.
Blood and duplicate diet sampling
Blood drawing was performed on the same day as the interview survey. The blood collection, processing and analytical procedures were a revised version of those in the 2002–2010 SEDOCCH, which have been published elsewhere [18]. Nearly 50 ml (vs. 20 ml in the 2002–2010 SEDOCCH) of fasting venous blood was drawn by a nurse or a clinical laboratory technician under the super-vision of a physician using different vacutainer tubes: Tubes for blood count and chemical analysis contained ethylenediaminetetraacetic acid disodium salt (EDTA-2NA); one for blood glucose, insulin and haemoglobin A1c (HbA1c) carried sodium fluoride, EDTA-2Na and sodium heparin, and another one for other clinical test items with coagulants. Collected blood was shipped to a contract laboratory (IDEA Consultants, Inc., Yaizu, Shizuoka, Japan).
Duplicate diet samples were primarily collected to es-timate dioxin intake, and a diet sample collection was taken from a subset of the participants during the sur-vey periods. Consecutive 3-day duplicate participants’ meals were collected by nutritionists and were kept in stainless steel containers, as previously reported by Arisawa et al. [15].
Analyses of dioxins
The analytical dioxin methods used in this study were in accordance with the guidelines published by the Ministry
of Health, Labour and Welfare as detailed in previous re-ports [14, 21, 22]. The blood and diet samples were weighed and homogenised before measurement. An ali-quot of the sample was spiked with internal standards and a solvent extracted, which was then subjected to a multi-layer silica column and an activated carbon column chromatography for purification. Then, the PCDDs, PCDFs and Co-PCBs (non-ortho PCBs and mono-ortho-PCBs) in the blood and diet samples were quanti-fied using gas chromatography coupled with a high-reso-lution mass spectrometer (IDEA Consultants, Inc.). The dietary dioxin intake in the diet samples was estimated using the following equation:
Din¼ðDdioxinDsizeÞ=3 BW
where Din, Ddioxin, Dsize and BW respectively de-noted the dietary dioxin intake, diet dioxin concentra-tions (3-day duplicate diets) in pg TEQ/g, the diet sample size (total amount over 3 days) in grams, and the body weight of each subject in kilograms. Using the 2006 World Health Organization (WHO) toxic equiva-lence factors (TEFs), the TEQs were calculated [23]. Blood dioxins were normalised for lipids and expressed as pg TEQ/g lipid, and the diet dioxin intake was expressed as pg TEQ/kg body weight/day. The detection limits for blood dioxins (pg/g lipid) were 1, 2, 4 and 10 for PCDDs/PCDFs with four or five chlorine atoms, PCDDs/PCDFs with six or seven chlorine atoms, PCDDs/PCDFs with eight chlorine atoms, and Co-PCBs, respectively.
Analyses of clinical biomarkers
The blood samples were also subjected to haemato-logical and biochemical assays. Analyses of clinical biomarkers (Health Sciences Research Institute, Inc., Kanagawa, Japan) were conducted for blood glucose, HbA1c, lipids [triglycerides and high-density lipopro-tein (HDL) cholesterol] and blood urea nitrogen, thy-roid hormones [triiodothyronine (T3) and thyroxine (T4)] and liver function tests [aspartate aminotrans-ferase (AST); alanine aminotransferase (ALT); gamma-glutamyl transpeptidase (GGT)]. Measure-ments of polyunsaturated fatty acids of eicosapenta-enoic acid (EPA), docosahexaeicosapenta-enoic acid (DHA), and dihomo-gamma-linolenic acid (DGLA) [2] were per-formed by SRL Inc. (Tokyo, Japan).
Statistical methods
significant for all statistical tests. The numerical vari-ables were assessed for normality using the Shapiro-Wilk test, and the numerical and qualitative variables were summarised using descriptive statistics. The nu-merical variables were presented as the mean ± stand-ard deviation if the distribution was normal, or as a median and interquartile range if the distribution was skewed. Categorical variables were presented as fre-quencies (percentages), and the differences evaluated using chi-square tests or Fisher’s exact tests. A Stu-dent’s t test (to compare two groups) or an ANOVA (to compare more than two groups) were used for the equal variance assessment when the data were normally distributed; however, for skewed data distri-butions, the Mann-Whitney U test (to compare two groups) or the Kruskal-Wallis test (to compare more than two groups) was used. Pearson’s correlations and multiple regression analyses were undertaken to ex-plore the relationships between the TEQs and health parameters/clinical biomarkers. If the health parame-ters/clinical biomarkers correlated with the total TEQ and showed a p value ≤0.2, they were included in the multiple regression models. The models were also ad-justed for smoking status and sex. As the PCDD, PCDF, Co-PCB and total dioxins (concentrations and TEQs) distributions were skewed to the right, they were presented as medians [95% confidence intervals (CI) or range]. To address the skewedness, the natural logs of dioxin congeners and total TEQ were used for the simple correlations and the multiple regression analyses. A value of zero was assigned to the PCDDs, PCDFs and Co-PCBs concentrations below the detec-tion limit with the consideradetec-tion that this could lead to bias [24]. A simple substitution of the non-detectable values was applied for comparison with the 2002–2010 SEDOCCH survey, in which a simple substitution approach (assignment of ‘zero’ to the congener concentrations below the detection limit) had been used [25]. In the 2002–2010 SEDO CCH survey, imputation of non-detects was not per-formed. However, in this study, to estimate the Pear-son’s r coefficient and in the multiple regression analyses, the PCDDs, PCDFs and Co-PCBs concentra-tions below the limit of detection (LOD) were treated as missing data. To account for the missing dioxin data, multiple imputations by chained equations (MICE) and predictive mean matching (PMM) were applied in Stata to impute the missing data [24, 26,
27]. For missing data exceeding 10%, we used the multiple imputation strategies following the guidelines suggested by Newman [28]. Sensitivity analyses were also conducted to compare the results of the different methods used to handle the congener concentrations below the detection limit.
Results
Study population and their health outcome variables
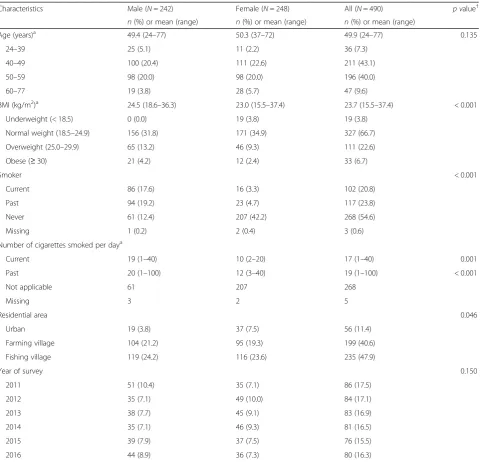
Table 1 and Figure1 give the details of the 490 partici-pants [242 males (49.4%); mean age 49.9 years with a range from 24 to 77] included in the 2011–2016 SEDOCCH surveys. A total of 63.5% of participants had been recruited from prefectures in which the dioxin levels were found to be high in the 2002–2010 SEDOCCH results. The clinical and biochemical param-eters differed in the male and female participants, with the BMI, smoking status, blood glucose, AST, alanine transferase ALT, GGT and serum triglycerides generally found to be higher in the males, and the serum HDL cholesterols higher in females (Table 1 and Additional file 1: Table S1). Current male smokers were more likely to have higher number of cigarettes smoked per day compared to current female smokers (19 versus 10, re-spectively). Furthermore, never smokers (mean age 49.9 years with a range from 36 to 72) were slightly older (t test, p= 0.047) compared with current smokers (mean age 48.5 years with a range from 24 to 63). HbA1c levels of≥5.6% were found in 29% (142 of 490) of the partici-pants indicating probably prediabetes or diabetes; how-ever, only 7.1% self-reported a history of physician-diagnosed diabetes (Additional file 1: Table S1). The fish consumption habits were found to be high in partici-pants from the fishing villages. For example, only 15.7% (37/235) of the participants from the fishing villages re-ported that they do not consume fish at all [versus 37.5% (21/56) in urban areas and 26.6% (53/199) in farming villages].
Blood dioxins
TEQ/g lipid, and the lowest being found in those from Hokkaido/Tohoku [7.7 (6.5–9.3)] pg TEQ/g lipid.
Figure 2 shows the blood dioxin trends by survey year. Overall, a significant decline in blood dioxins was observed from 2011 to 2016 (Kruskal-Wallis test, p< 0.001). As ex-pected, we observed that blood dioxins increased with age (Additional file2: Figure S1), with median blood dioxins be-ing significantly lower (Mann-Whitney test, p< 0.001) in participants aged ≤39 years (5.4 pg TEQ/g lipid) than in those ≥40 (9.7 pg TEQ/g lipid). Of the 490 participants, 106 (21.6%) with a mean age of 55 years (range, 41–75)
were found to have blood dioxins≥16 pg TEQ/g lipid (me-dian TEQ in the 2002–2010 SEDOCCH). The total blood TEQ medians (95% CI) were higher in areas in which the blood dioxin levels were reported to be high [10 (9.4–11) pg TEQ/g lipid] in the 2002–2010 SEDOCCH results (Wilcoxon rank-sum test,p< 0.001) compared with those where they were low [7.7 (6.9–8.7) pg TEQ/g lipid].
The median (95% CI) total TEQ in the blood of partic-ipants living in fishing villages [11.0 (9.7–12.0) pg TEQ/ g lipid] was relatively higher compared to those in urban [7.4 (5.8–8.8) pg TEQ/g lipid] and agricultural/farming
Table 1Characteristics of 490 participants in SEDOCCH 2011–2016
Characteristics Male (N= 242) Female (N= 248) All (N= 490) p value†
n(%) or mean (range) n(%) or mean (range) n(%) or mean (range)
Age (years)a 49.4 (24–77) 50.3 (37–72) 49.9 (24–77) 0.135
24–39 25 (5.1) 11 (2.2) 36 (7.3)
40–49 100 (20.4) 111 (22.6) 211 (43.1)
50–59 98 (20.0) 98 (20.0) 196 (40.0)
60–77 19 (3.8) 28 (5.7) 47 (9.6)
BMI (kg/m2)a 24.5 (18.6–36.3) 23.0 (15.5–37.4) 23.7 (15.5–37.4) < 0.001
Underweight (< 18.5) 0 (0.0) 19 (3.8) 19 (3.8)
Normal weight (18.5–24.9) 156 (31.8) 171 (34.9) 327 (66.7)
Overweight (25.0–29.9) 65 (13.2) 46 (9.3) 111 (22.6)
Obese (≥30) 21 (4.2) 12 (2.4) 33 (6.7)
Smoker < 0.001
Current 86 (17.6) 16 (3.3) 102 (20.8)
Past 94 (19.2) 23 (4.7) 117 (23.8)
Never 61 (12.4) 207 (42.2) 268 (54.6)
Missing 1 (0.2) 2 (0.4) 3 (0.6)
Number of cigarettes smoked per daya
Current 19 (1–40) 10 (2–20) 17 (1–40) 0.001
Past 20 (1–100) 12 (3–40) 19 (1–100) < 0.001
Not applicable 61 207 268
Missing 3 2 5
Residential area 0.046
Urban 19 (3.8) 37 (7.5) 56 (11.4)
Farming village 104 (21.2) 95 (19.3) 199 (40.6)
Fishing village 119 (24.2) 116 (23.6) 235 (47.9)
Year of survey 0.150
2011 51 (10.4) 35 (7.1) 86 (17.5)
2012 35 (7.1) 49 (10.0) 84 (17.1)
2013 38 (7.7) 45 (9.1) 83 (16.9)
2014 35 (7.1) 46 (9.3) 81 (16.5)
2015 39 (7.9) 37 (7.5) 76 (15.5)
2016 44 (8.9) 36 (7.3) 80 (16.3)
SEDOCCHsurvey on the exposure to dioxins and other chemical compounds in humans,BMIbody mass index a
Mean (range)
areas [8.3 (7.5–9.1) pg TEQ/g lipid]. The median (95% CI) total TEQ in the blood were significantly lower (Wil-coxon rank-sum test, p< 0.001) in urban participants [7.4 (5.8–8.8) pg TEQ/g lipid] than in rural participants [9.6 (9.1–10.0) pg TEQ/g lipid]. However, no significant blood dioxin differences were observed between the two smoking categories, with the median (95% CI) total TEQ in the blood of non-smokers and smokers being respect-ively 9.5 (8.8–10.0) pg TEQ/g lipid and 9.2 (7.9–10.0) pg TEQ/g lipid (Wilcoxon rank-sum test,p= 0.857).
Estimated dioxin dietary intake
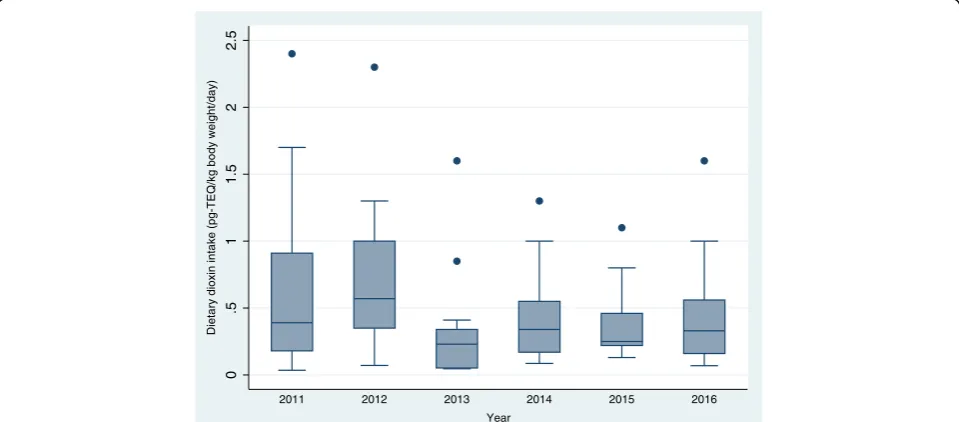
Ninety samples were used to estimate the dioxin dietary intake. Overall, we observed a decline in the dioxin diet-ary intake per year (Fig. 3). The mean (standard devi-ation) dietary total TEQ intake was estimated at 0.49 (0.48) pg TEQ/kg body weight/day, and the median (95% CI) PCDDs/PCDFs and Co-PCBs and total TEQ intake were respectively, 0.16 (0.12–0.20), 0.16 (0.12– 0.19) and 0.33 (0.25–0.40) pg/kg body weight/day (Add-itional file3: Figure S2). The median (95% CI) TEQ diet-ary intake (pg/kg body weight/day) was found to be the highest in the fishing areas [0.35 (0.25–0.52)], followed by the urban areas [0.30 (0.09–1.07)] and the agricul-tural/farming areas [0.24 (0.19–0.45)]; however, the dif-ferences were not statistically significant (Kruskal-Wallis test,p= 0.411). The data also showed that total TEQ in-take medians (95% CI) were similar in areas in which the blood dioxin levels were reported to be high [0.30 (0.24–0.38) pg/kg body weight/day] and low [0.39 (0.22–
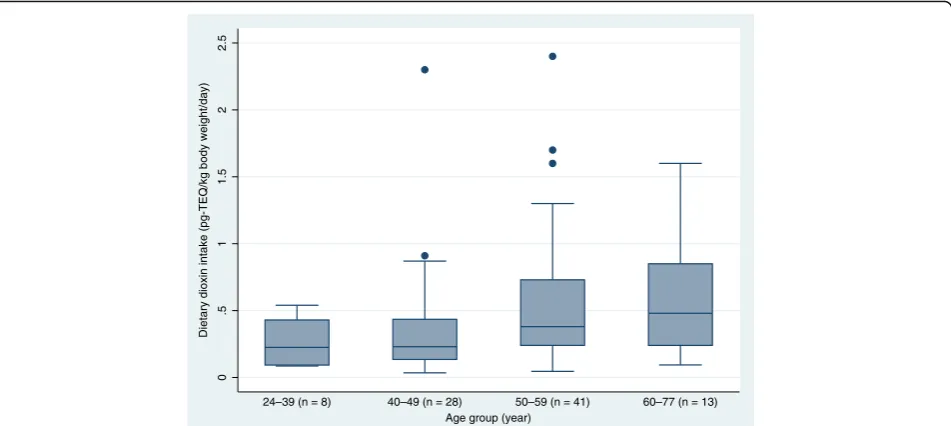
0.54) pg/kg body weight/day] in the 2002–2010 SEDOCCH results (Wilcoxon rank-sum test, p= 0.843). Total TEQ intake medians (range) were also similar (Wilcoxon rank-sum test,p= 0.739) between males [0.33 (0.35–2.30)] and females [0.32 (0.04–2.40)]. However, these medians tended to increase with age (Fig.4).
Relationship between blood dioxin TEQ and health parameters/clinical biomarkers
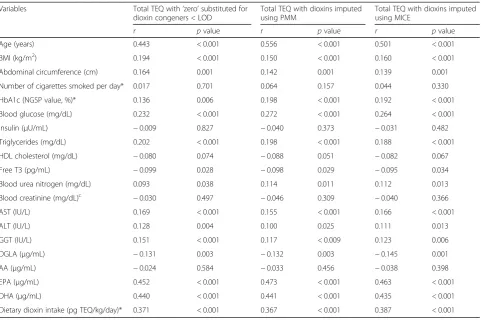
Table 3 shows the correlations between the blood total TEQ and health parameters/clinical biomarkers. Positive correlations were found between age and total TEQ in the blood, and there were also significant positive corre-lations between total TEQ in the blood and the esti-mated dietary TEQ intake, the BMI, abdominal circumferences, HbA1c, blood glucose, triglycerides, AST, ALT, GGT, EPA, and DHA. However, total TEQ in the blood had significant negative correlations with DGLA and weak negative correlations with triiodothyr-onine. Regarding the dietary dioxin intake, the results obtained without imputations of blood dioxin congeners showed that the Pearson’s correlation coefficients were similar to those with imputations. For instance, without imputations, and using the PMM and MICE, the corre-lations between total TEQ in the blood and the dietary dioxin intake had Pearson’s correlation coefficients of 0.371, 0.367 and 0.387, respectively.
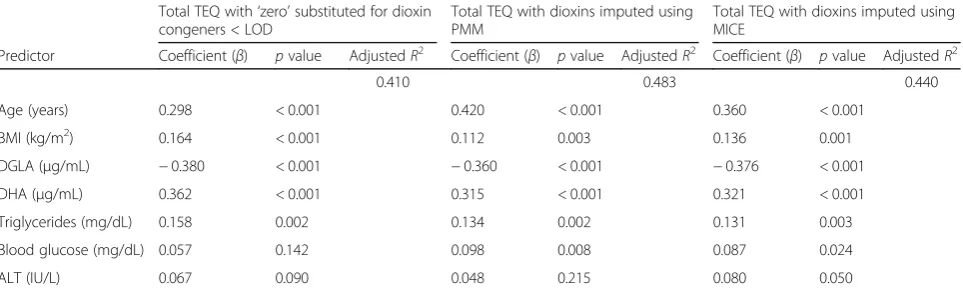
The results of the adjusted associations between the total blood dioxin TEQ and health parameters/clinical biomarkers are shown in Table 4. Consistent positive
associations were found between the TEQ in the blood and age, BMIs, DHA and triglycerides while plasma DGLA was found to have a negative association. Using multiple imputation methods for the dioxin congeners concentrations below the LOD, the relationship between blood dioxins and health parameters/clinical biomarkers
were found to be similar between the models that used imputed and non-imputed dioxin data. However, the adjustedR2from the models that used the simple sub-stitution dioxin data were different from the models that used dioxin data imputations, with the PMM (R2 = 0.480) and MICE (R2= 0.440) providing stronger
0
20
40
60
Blood PCDDs + PCDFs + Co-PCBs (pg-TEQ/g-lipid)
2011 2012 2013 2014 2015 2016
Year
Fig. 2(Showing whiskers). Box plot (median, interquartile range and range) of total TEQ in the blood (in pg TEQ/g lipid) by survey year of the ‘survey on the exposure to dioxins and other chemical compounds in humans,’2011 to 2016. The median (range) of total TEQ by survey year was 14.0 (0.8–56.0), 9.0 (0.4–40.0), 8.9 (0.4–33.0), 8.3 (1.1–34.0), 8.4 (0.3–49.0) and 9.0 (0.9–29) in 2011, 2012, 2013, 2014, 2015 and 2016, respectively. The Kruskal-Wallis test (p< 0.001) was used to compare the differences in total TEQ in blood across the survey years. Definition of abbreviations: PCDDs, polychlorinated dibenzo-dioxins; PCDFs, polychlorinated dibenzofurans; Co-PCBs, coplanar polychlorinated biphenyls; TEQ, toxic equivalent
0
.5
1
1.5
2
2.5
Dietary dioxin intake (pg-TEQ/kg body weight/day)
2011 2012 2013 2014 2015 2016
Year
Fig. 3(Showing whiskers): Estimated dioxin dietary intake by year (n= 15/year). Box plot of total TEQ in food by survey year of the‘survey on the exposure to dioxins and other chemical compounds in humans,’2011 to 2016 (N= 90)The median (range) of dioxin dietary intake (in pg TEQ/kg body weight/day) by survey year was 2011, 0.39 (0.03–2.4); 2012, 0.57 (0.07–2.3); 2013, 0.23 (0.04–1.6); 2014, 0.34 (0.08–1.3); 2015, 0.25 (0.13–1.1); and 2016, 0.33 (0.06–1.6). Kruskal-Wallis test:χ2= 11.25; d.f. = 5;
evidence compared with the simple substitution method (R2= 0.410). In adjusted linear regression models that in-cluded smoking status, we found no association between smoking status and the total blood dioxin TEQ using the simple substitution method (beta =−0.347;p= 0.420;R2= 0.410), PMM (beta = 0.073; p= 0.856; R2= 0.480), and MICE (beta =−0.011; p= 0.777; R2= 0.440). Including smoking status in the models had no effect on the signifi-cance of the models (Table 4) and increased slightly the variance inflation factor (VIF) from 1.33 to 1.42. It was also found that the VIF was 2.2 for EPA, DHA, DGLA, ALT, AST and GGT. However, VIF dropped to 1.1 when EPA, AST and GGT were excluded, indicating that there were some collinearities between clinical biomarkers [AST and GGT correlated with ALT (rho = 0.739 and rho = 0.624, re-spectively) whereas EPA with DHA (rho = 0.778)]. Using MICE, after multivariable adjustment, we also found as-sociations between total blood dioxin TEQ and EPA (beta = 0.270; p< 0.001; R2= 0.425). In the model re-stricted to the 90 participants for whom dietary dioxin intake estimations were available (listwise deletion), we could not detect an association between total blood di-oxin TEQ and dietary didi-oxin intake after multivariable adjustment (Additional file1: Table S2).
Discussion
The SEDOCCH, which were designed to assess the health risks of pollutants such as dioxins and dietary di-oxins intake in the general Japanese population, were a series of biomonitoring studies conducted by the MOEJ on non-occupationally exposed Japanese [18]. This study
evaluated the progress made by the government to decrease the dioxin dietary intake and corresponding body burden.
Current dioxin levels in Japanese from the 2011–2016
SEDOCCH data
It was found that the median concentration of blood di-oxin TEQ in the general adult Japanese population was 9.40 pg TEQ/g lipid and the dietary dioxin intake was 0.33 pg TEQ/kg body weight/day. Blood dioxins (5.4 pg TEQ/g lipid) in participants aged ≤39 years were par-ticularly striking, suggesting that dioxin exposure inten-sity and accumulation time were probably limited in this age group. However, only a small percentage (7.3%) of the participants aged ≤39 years was included in this study. Higher median blood dioxins were found in par-ticipants aged ≥40 years old, which supported findings in previous studies on the lipophilicity of dioxins and their accumulation in adipose tissues over a lifetime [29]. The national estimates of blood dioxins found in this study matched international trends and were in line with a review that reported worldwide decreasing PCDD/PCDFs TEQ values in samples collected up to 2008 [30], but were lower than the median values re-ported in Russian women in 2010 [31]. TEQ values or that of congeners reported in this study might be diffi-cult to compare between countries/studies because there is significant heterogeneity in the study designs, analyt-ical methods, handling values below the LOD and TEF utilisation. For instance, a study conducted in rural Germany reported median blood dioxins of 7.5 pg TEQ/
0
.5
1
1.5
2
2.5
Dietary dioxin intake (pg-TEQ/kg body weight/day)
24–39 (n = 8) 40–49 (n = 28) 50–59 (n = 41) 60–77 (n = 13) Age group (year)
g lipid (vs. 9.4 pg TEQ/g lipid in this study) [32]. How-ever, our study population differed considerably from the study conducted in Germany. The latter study used the 2005 WHO TEFs (vs. 2006 WHO TEFs in this study) with a sample size of 70 (vs. 490 in this study) and its participants’ age ranged from 4 to 76 years (vs. 24–77 years in this study). The fact that the German’s study included relatively younger participants might have contributed to the relatively lower reported total TEQ value. The PCDD/PCDFs and Co-PCBs values found in this study are similar to those reported in an-other recent study conducted in Germany that had looked at chlorinated dioxins in 42 blood donors [33]. The study in the German blood donors has documented a PCDD/PCDFs value of 6.2 pg TEQ/g lipid (vs. 5.7 pg TEQ/g lipid in this study) and Co-PCBs of 4.1 pg TEQ/g lipid (vs. 3.6 pg TEQ/g lipid) among participants aged 20 to 68 years [33]. Moreover, a study conducted in Ghana among individuals working at e-waste recycling sites and
controls who were not directly exposed to e-waste recyc-ling activities reported a PCDD/PCDFs value of 4.6 pg TEQ/g lipid (vs. 5.7 pg TEQ/g lipid in this study) in con-trols with a mean age of 24.4 years (vs. 49.4 years in this study) [34].
In this study, the dietary dioxin exposure was esti-mated using a duplicate diet analysis from three con-secutive days [15], from which it was found that none of the participants exceeded the tolerable daily dioxin in-take of 4 pg/kg body weight/day stipulated in the‘Act on Special Measures against Dioxins’[11]. The highest diet-ary dioxins intake was found in participants living in fishing areas (0.35 pg/kg body weight/day), which sup-ported previous data that suggested that fish and sea foods were more vulnerable to dioxin contamination [8,
35]. These findings were also consistent with a report by Arisawa et al., in which it was found that the highest dietary dioxin intake was in Japanese from fishing vil-lages; however, the previously reported value (0.98 pg/kg
Table 3Pearson’s correlation between log-transformed blood dioxins (in pg TEQ/g lipid) and health outcomes, SEDOCCH 2011– 2016
Variables Total TEQ with‘zero’substituted for
dioxin congeners < LOD
Total TEQ with dioxins imputed using PMM
Total TEQ with dioxins imputed using MICE
r pvalue r pvalue r pvalue
Age (years) 0.443 < 0.001 0.556 < 0.001 0.501 < 0.001
BMI (kg/m2) 0.194 < 0.001 0.150 < 0.001 0.160 < 0.001
Abdominal circumference (cm) 0.164 0.001 0.142 0.001 0.139 0.001
Number of cigarettes smoked per day* 0.017 0.701 0.064 0.157 0.044 0.330
HbA1c (NGSP value, %)* 0.136 0.006 0.198 < 0.001 0.192 < 0.001
Blood glucose (mg/dL) 0.232 < 0.001 0.272 < 0.001 0.264 < 0.001
Insulin (μU/mL) −0.009 0.827 −0.040 0.373 −0.031 0.482
Triglycerides (mg/dL) 0.202 < 0.001 0.198 < 0.001 0.188 < 0.001
HDL cholesterol (mg/dL) −0.080 0.074 −0.088 0.051 −0.082 0.067
Free T3 (pg/mL) −0.099 0.028 −0.098 0.029 −0.095 0.034
Blood urea nitrogen (mg/dL) 0.093 0.038 0.114 0.011 0.112 0.013
Blood creatinine (mg/dL)c −0.030 0.497 −0.046 0.309 −0.040 0.366
AST (IU/L) 0.169 < 0.001 0.155 < 0.001 0.166 < 0.001
ALT (IU/L) 0.128 0.004 0.100 0.025 0.111 0.013
GGT (IU/L) 0.151 < 0.001 0.117 < 0.009 0.123 0.006
DGLA (μg/mL) −0.131 0.003 −0.132 0.003 −0.145 0.001
AA (μg/mL) −0.024 0.584 −0.033 0.456 −0.038 0.398
EPA (μg/mL) 0.452 < 0.001 0.473 < 0.001 0.463 < 0.001
DHA (μg/mL) 0.440 < 0.001 0.441 < 0.001 0.435 < 0.001
Dietary dioxin intake (pg TEQ/kg/day)* 0.371 < 0.001 0.367 < 0.001 0.387 < 0.001
All variables were log-transformed, except age and the number of cigarettes smoked per day
SEDOCCHsurvey on the exposure to dioxins and other chemical compounds in humans,PCDDspolychlorinated dibenzo-dioxins,PCDFspolychlorinated dibenzofurans,Co-PCBscoplanar polychlorinated biphenyls,TEQtoxicity equivalent,BMIbody mass index,HbA1chaemoglobin A1c,NGSPNational
Glycohemoglobin Standardisation Programme,HDLhigh-density lipoprotein,T3triiodothyronine,ASTaspartate aminotransferase,ALTalanine aminotransferase, GGTgamma-glutamyl transpeptidase,DGLAdihomo-gamma-linolenic acid,AAarachidonic acid,EPAeicosapentaenoic acid,DHAdocosahexaenoic acid,PMM predictive mean matching,MICEmultiple chained equations
body weight/day) was higher than that found in the current study [15]. The estimated mean dietary dioxin intake (0.49 pg TEQ/kg body weight/day) found in this study was approximately three times lower that that re-ported in a French study from 2015, which rere-ported a mean of 1.3 pg TEQ/kg body weight/day [36]. However, in the latter study, the data were collected between 1993 and 2008 when dioxin levels in the environment were probably higher than now.
Comparison of the 2002–2010 and 2011–2016 SEDOCCH
data
In reference to age, it was expected that the dioxin levels would be higher in participants in this study (mean age = 49.9 years) than those in the 2002–2010 SEDOCCH (mean age = 44.5 years;N= 2264) [20]; however, this was not found. A comparison of the median blood dioxin levels reported in this study found that the blood dioxin TEQ were 41.3% lower than that those reported in the 2002–2010 SEDOCCH, which had reported a median of 16 pg TEQ/g lipid. The dietary dioxin intake was also found to be 41.1% lower in the 2011–2016 SEDOCCH than the median 0.56 pg TEQ/kg body weight/day re-ported in the 2002–2010 SEDOCCH (N= 625) [37], pro-viding evidence that the blood dioxin and dietary dioxin intake levels were decreasing nationally. The blood di-oxin and dietary didi-oxin intake were also found to have decreased in a similar way (approximately 41%), which was in line with previous findings that documented sig-nificant declines in dioxin levels in Japan [12]. A typical dioxin congener, 2,3,7,8-tetrachlorodibenzo-para- dioxin (TCDD), has a biological half-life of 6 to 11 years in adults [38, 39], and all other congeners have similar half-lives. In this study, 77.1% of the blood samples had undetectable TCDD concentrations (Table 2). The TCDD level found in this study is lower compared with
that in a previous study in Italy that has found a median of 0.68 pg TEQ/g lipid [40]. Previous studies have identi-fied diet as a major source of dioxin exposure [8, 35]; however, dioxin elimination can be influenced by several factors such as body fat, which has been found to in-crease/decrease blood dioxin levels and elimination rates [38]. Since no significant differences were found in the amount of body fat between the 2002–2010 SEDOCCH (BMI≈23 kg/m2) [20] and the 2011–2016 SEDOCCH (BMI≈23 kg/m2), it was surmised that the decrease in dietary dioxin intake had contributed to the decline in blood dioxins. Studies have shown that food dioxins come mainly from atmospheric deposition [41]; there-fore, the government’s efforts to reduce dioxin emissions may have played a significant role in decreasing the di-oxin levels in Japan.
Likewise, the upper blood dioxins range reported in this study (56 pg TEQ/g lipid) fell well below the upper range of 130 pg TEQ/g lipid [37] estimated in the 2002– 2010 SEDOCCH, providing additional evidence that the blood dioxins in the Japanese population may be de-creasing. Although other explanations might be possible, one hypothesis was that this decreasing trend could have been due to the decline of dioxins in the atmosphere be-cause of the strict Japanese government’s laws that limit incineration emissions. Even though it was found that the blood dioxins and dietary dioxin intake were declin-ing in the Japanese population sample, they should not be interpreted as meaning that people now have a zero risk of dioxin exposure [15].
In this study, 21.6% of the participants still had blood dioxins ≥16 pg TEQ/g lipid, which was the median blood dioxin TEQ reported in the 2002–2010 SEDOCCH [18, 37]. The higher blood dioxin levels re-ported in the 2002–2010 SEDOCCH were found to be linked to adverse health outcomes [2, 3, 8, 14–20].
Table 4Relationship between log-transformed total blood dioxins (in pg TEQ/g lipid) and health parameters/clinical biomarkers, 2011–2016 SEDOCCH (N= 490)
Total TEQ with‘zero’substituted for dioxin congeners < LOD
Total TEQ with dioxins imputed using PMM
Total TEQ with dioxins imputed using MICE
Predictor Coefficient (β) pvalue AdjustedR2 Coefficient (β) pvalue AdjustedR2 Coefficient (β) pvalue AdjustedR2
0.410 0.483 0.440
Age (years) 0.298 < 0.001 0.420 < 0.001 0.360 < 0.001
BMI (kg/m2) 0.164 < 0.001 0.112 0.003 0.136 0.001
DGLA (μg/mL) −0.380 < 0.001 −0.360 < 0.001 −0.376 < 0.001
DHA (μg/mL) 0.362 < 0.001 0.315 < 0.001 0.321 < 0.001
Triglycerides (mg/dL) 0.158 0.002 0.134 0.002 0.131 0.003
Blood glucose (mg/dL) 0.057 0.142 0.098 0.008 0.087 0.024
ALT (IU/L) 0.067 0.090 0.048 0.215 0.080 0.050
Variables included in the model: age, BMI, triglycerides, blood glucose, blood urea nitrogen, ALT, DGLA, DHA, and sex BMI, triglycerides, blood glucose, blood urea nitrogen, ALT, DGLA, and DHA were log-transformed
Therefore, the blood dioxins of ≥16 pg TEQ/g lipid found in this study warrant further investigation because of the potential long-term health effects. These results also have implications for the MOEJ and highlighted the critical need for longitudinal monitoring to assess long-term public exposure to dioxins and to reduce background exposure in the general population.
Relationship between blood dioxins and health parameters/clinical biomarkers
The correlations reported in the 2002–2010 SEDOCCH between blood dioxins and health parameters [2] were also found in this study (2011–2016 SEDOCCH) for data based both on non-detects equal to zero and the im-puted data (Table 3). In particular, participants with higher blood dioxin levels were more likely to have higher BMIs, more elevated triglycerides, higher DHA and EPA, and lower DGLA (Table4) and then could be explained by age, but not by smoking status. The associ-ations between age and blood dioxins found in the present study were expected, as chlorinated dioxins are known to be generally more resistant to biotransform-ation and eliminbiotransform-ation from the body. It was assumed that the total body blood dioxins burden in this group was probably due to the cumulative lifetime exposure to dioxins rather than because of recent exposures, as the dioxins half-life in the human body can exceed 7 years. Therefore, the results might have reflected the dioxins the participant had accumulated over a long time and a slower dioxin elimination [42].
Our findings that biomarkers of fish intake, DHA and EPA were associated with blood dioxins are in line with the view of marine fish intake as one of the foods that influence blood dioxins in Japan [14]. They support the hypothesis that a significant portion of blood total TEQ in Japan is from fish intake. The association between blood dioxins and fish had been reported in the existing literature [43–45]. Yet a study conducted in Russia could not find associations between fish intake and blood di-oxins in the overall participants though some partici-pants who consumed high quantities of fish showed higher serum dioxin levels [31]. While smoking status has been found to be a predictor of blood dioxins [38,
41, 46], the findings that smoking status was not a sig-nificant predictor was unexpected. Blood dioxin levels were similar between never smokers and current smokers. The relatively small number (21%, 102/490) of current smokers and their relatively low mean age (com-pared with never smokers) in this study could be the most direct explanation for these unexpected findings. Alternatively, this lack of association between blood di-oxins and smoking could mean that the dioxin levels were low in tobacco smoked by these participants.
Limitations of the study
Although this study considered all necessary factors, there were some potential limitations. First, there was possibly some bias in the participants’enrolment; specif-ically, participation was voluntary, and therefore, the participants were not randomly enrolled. The 2011 to 2016 sampling was primarily concentrated in areas where dioxin levels had been found to be high or low in the 2002–2010 SEDOCCH survey [16]. Therefore, the selection of the participants in the 2011–2016 SEDO CCH may not have been truly represented the Japanese population. Therefore, the 2011–2016 SEDOCCH sam-ple size may not have been large enough to truly repre-sent the Japanese population. However, this limitation was mitigated by recruitment in all five Japanese regions and the target number of participants recruited each year. SEDOCCH investigators are now working to im-prove the next SEDOCCH to ensure a true representa-tiveness of the Japanese population. Second, although the data on the individuals invited to participate in the study and the response rates were not available, the study succeeded in recruiting the planned number of participants for the study design. Even though the inter-views were conducted face-to-face, the absence of a bias influence on the quality of responses obtained cannot be ruled out [50]. Third, the cross-sectional design of the study limited the interpretation of the findings, espe-cially when the half-life of dioxins is known to exceed 7 years [4]. As most participants were only sampled once, it was difficult to estimate the dioxin levels over time along with the rates of decay. Previous studies have re-ported that dioxin elimination can occur faster for people with higher dioxin levels [42]. In this study, 63.5% of the participants had been recruited in areas where the dioxin levels were reported as high (median 21.5 to 40.9 pg TEQ/g lipid) in the 2002–2010 SEDO CCH results; therefore, it could be speculated that the participant group may have experienced faster dioxin elimination. This observation and the low dioxin intake might be the reason for the dramatic decline in dioxins, even though dioxins tend to have longer half-lives. The oversampling of participants from prefectures in which the blood dioxin levels had been found to be high in the 2002–2010 SEDOCCH surveys contributed to enabling the evaluation of the government action to reduce dioxins in Japan. In these areas, the median blood dioxins were 10 pg TEQ/g lipid in the 2011–2016 SEDOCCH surveys.
Fourth, comparing our dietary dioxin intake measure-ments to the values reported in the 2002–2010 SEDOCCH surveys may also have introduced some bias. This is for reasons that the 2002–2010 SEDOCCH diet-ary data are more than 10 years old and were carried out in participants who were likely to live in urban areas (vs.
rural areas in this study). However, the 2002–2010 SEDOCCH dietary dioxin intake estimations were from nationwide surveys and were set as a reference by the MOEJ for this report.
Despite these limitations, this study contributes to studies on dioxin levels. First, the findings provide in-sights into planning future epidemiological research to address dioxin-related issues and assists in public-pol-icy decisions. Second, missing data is uncommon; for example, the questionnaire answers only had a little missing data because individual interviews were carried to accompany the previously completed self-administered questionnaire.
Conclusions
Median blood dioxins and dietary dioxin intake were found to be approximately 41% lower in this study com-pared with those in the 2002–2010 SEDOCCH. It was found that the measures and actions undertaken in Japan have possibly contributed to these reductions in the body burden of dioxins in the Japanese population. In our non-occupationally exposed Japanese population, blood dioxins were found to be associated with clinical biomarkers including DHA and EPA. As fish intake may benefit health in humans, we recommend additional government actions to further reduce potential dioxin contaminants in fish.
Additional files
Additional file1:Table S1.Health parameters/clinical biomarkers of 490 participants in SEDOCCH 2011–2016.Table S2.Linear regression models of log-transformed blood dioxins (in pg TEQ/g lipid) and dietary dioxin intake (pg TEQ/kg/day), 2011–2016 SEDOCCH. (DOCX 1923 kb)
Additional file 2:Figure S1.Box plot of total TEQ in the blood (in pg TEQ/g lipid) by age group of the‘survey on the exposure to dioxins and other chemical compounds in humans,’2011 to 2016 (N= 490). The median (range) of total TEQ by age group (year) was 24–39: 5.4 (0.7–13.0); 40–49: 7.8 (0.4–34.0); 50–59: 12.0 (0.4–56.0); and 60–77: 15 (1.9–44.0). Kruskal-Wallis test:
χ2= 93.47; d.f. = 3;
p< 0.001. TEQ, toxic equivalents. (PDF 231 kb)
Additional file 3:Figure S2.Estimated dioxin dietary intake by areas. Box plot of total TEQ in food (in pg TEQ/kg body weight/day) by survey area of the‘survey on the exposure to dioxins and other chemical compounds in humans,’2011 to 2016 (N= 90). This figure shows the estimated median (range) dioxin intake for urban areas [PCDDs/ PCDFs = 0.15 (0.04–0.51); Co-PCBs = 0.15 (0.03–1.0); dietary total TEQ intake = 0.31 (0.07–1.30)], farming areas [PCDDs/PCDFs = 0.12 (0.02–0.58); Co-PCBs = 0.12 (0.02–1.10); dietary total TEQ intake = 0.24 (0.04–1.60)], and fishing areas [PCDDs/PCDFs = 0.16 (0.02–1.0); Co-PCBs = 0.17 (0.02–1.80); dietary total TEQ intake = 0.35 (0.05–2.40)]. Definition of abbreviations: PCDDs, polychlorinated dibenzo-dioxins; PCDFs, polychlorinated dibenzofurans; Co-PCBs, coplanar polychlorinated biphenyls; TEQ, toxic equivalents. (PDF 237 kb)
Abbreviations
HbA1c: Haemoglobin A1c; HDL: High-density lipoprotein; LOD: Limit of detection; MICE: Multiple imputations by chained equations; MOEJ: The Ministry of the Environment of Japan; NIES: National Institute for Environmental Studies; PCDDs: Polychlorinated dibenzo-p-dioxins; PCDFs: Polychlorinated dibenzofurans; PMM: Predictive mean matching; SEDOCCH: Survey on the exposure to dioxins and other chemical compounds in humans; T3: Triiodothyronine; T4: Thyroxine;
TCDD: Tetrachlorodibenzo-para- dioxin; TCDF: Tetrachlorodibenzofuran; TEFs: Toxic equivalence factors; TEQ: Toxic equivalent; VIF: Variance inflation factor; WHO: World Health Organization
Acknowledgements
This work was conducted as an MOEJ contract with NIES. The authors thank the participants in this study. The findings, views and conclusions expressed in this article are those of the authors and do not necessarily reflect the views of MOEJ.
Funding
The SEDOCCH was conducted directly by the MOEJ, and the SEDOCCH data analysis was performed under a contract by the MOEJ.
Availability of data and materials
The datasets generated and analysed in this study are not publicly available because this research involved human participants requiring the protection of personal information as stated in the written informed consent. Please contact the corresponding author for any data requests.
Authors’contributions
MBA, MIS, TI and SFN performed the analyses and drafted the manuscript. KA, MS, TF and SFN provided critical comments and revised the manuscript. All authors read and approved the final manuscript.
Authors’information
Not applicable.
Ethics approval and consent to participate
This study was reviewed and approved by the institutional review boards of MOEJ and the National Institute for Environmental Studies (NIES). All participants were enrolled after giving written informed consent to participate in this study.
Consent for publication Not applicable.
Competing interests
All authors declare that they have no competing interests.
Publisher’s Note
Springer Nature remains neutral with regard to jurisdictional claims in published maps and institutional affiliations.
Author details 1
Centre for Health and Environmental Risk Research, National Institute for Environmental Studies, Tsukuba 305-8506, Japan.2Institute of Biomedical Sciences, Tokushima University Graduate School, Tokushima 770-8503, Japan. 3Department of Public Health, Hyogo College of Medicine, Nishinomiya
663-8501, Japan.4Department of Hygiene and Preventive Medicine, School of Medicine, Fukushima Medical University, Fukushima 960-1295, Japan. 5
Department of Public Health, School of Medicine, International University of Health and Welfare, Narita 286-8686, Japan.
Received: 7 September 2018 Accepted: 7 December 2018
References
1. Warner M, Mocarelli P, Samuels S, Needham L, Brambilla P, Eskenazi B. Dioxin exposure and cancer risk in the Seveso Women’s health study. Environ Health Perspect. 2011;119(12):1700–5.
2. Uemura H, Arisawa K, Hiyoshi M, Satoh H, Sumiyoshi Y, Morinaga K, et al. Associations of environmental exposure to dioxins with prevalent diabetes among general inhabitants in Japan. Environ Res. 2008;108(1):63–8.
3. Uemura H, Arisawa K, Hiyoshi M, Kitayama A, Takami H, Sawachika F, et al. Prevalence of metabolic syndrome associated with body burden levels of dioxin and related compounds among Japan’s general population. Environ Health Perspect. 2009;117(4):568–73.
4. World Health Organization. Preventive disease through healthy
environments. Exposure to dioxins and dioxin-like substances. 2010.http:// www.who.int/ipcs/features/dioxins.pdf?ua=1. Accessed 14 Nov 2017. 5. Kannan K, Yun SH, Ostaszewski A, McCabe JM, Mackenzie-Taylor D, Taylor
AB. Dioxin-like toxicity in the Saginaw River watershed: polychlorinated dibenzo-p-dioxins, dibenzofurans, and biphenyls in sediments and floodplain soils from the Saginaw and Shiawassee Rivers and Saginaw Bay, Michigan, USA. Arch Environ Contam Toxicol. 2008;54(1):9–19.
6. Hilscherova K, Kannan K, Nakata H, Hanari N, Yamashita N, Bradley PW, et al. Polychlorinated dibenzo-p-dioxin and dibenzofuran concentration profiles in sediments and flood-plain soils of the Tittabawassee River, Michigan. Environ Sci Technol. 2003;37(3):468–74.
7. Hideto Y, Kazuaki T, Nobuo T, Shin-ichi S. Japan’s waste management policies for dioxins and polychlorinated biphenyls. J Mater Cycles Waste Manag 2009; 11:229–243.
8. Uemura H, Arisawa K, Hiyoshi M, Satoh H, Sumiyoshi Y, Morinaga K, et al. PCDDs/PCDFs and dioxin-like PCBs: recent body burden levels and their determinants among general inhabitants in Japan. Chemosphere. 2008; 73(1):30–7.
9. Kunita N, Hori S, Obana H, Otake T, Nishimura H, Kashimoto T, et al. Biological effect of PCBs, PCQs and PCDFs present in the oil causing yusho and yu-cheng. Environ Health Perspect. 1985;59:79–84.
10. Yamamoto K, Kudo M, Arito H, Ogawa Y, Takata T. A cross-sectional analysis of dioxins and health effects in municipal and private waste incinerator workers in Japan. Ind Health. 2015;53(5):465–79.
11. Ministry of the Environment, Government of Japan. Law concerning special measures against dioxins. 1999.https://www.env.go.jp/en/chemi/dioxins/ law.pdf. Accessed 16 Nov 2017.
12. Ministry of the Environment, Government of Japan: Dioxins. 2012.https:// www.env.go.jp/en/chemi/dioxins/brochure2012.pdf. Accessed 16 Nov 2017. 13. Ministry of the Environment, Government of Japan. Dioxin emission
inventory. 2005.http://www.env.go.jp/en/press/2005/1125a.html. Accessed 16 Nov 2017.
14. Arisawa K, Matsumura T, Tohyama C, Saito H, Satoh H, Nagai M, et al. Fish intake, plasma omega-3 polyunsaturated fatty acids, and polychlorinated dibenzo-p-dioxins/polychlorinated dibenzo-furans and co-planar
polychlorinated biphenyls in the blood of the Japanese population. Int Arch Occup Environ Health. 2003;76(3):205–15.
15. Arisawa K, Uemura H, Hiyoshi M, Satoh H, Sumiyoshi Y, Morinaga K, et al. Dietary intake of PCDDs/PCDFs and coplanar PCBs among the Japanese population estimated by duplicate portion analysis: a low proportion of adults exceed the tolerable daily intake. Environ Res. 2008;108(2):252–9. 16. Arisawa K, Uemura H, Hiyoshi M, Kitayama A, Takami H, Sawachika F, et al.
Dietary patterns and blood levels of PCDDs, PCDFs, and dioxin-like PCBs in 1656 Japanese individuals. Chemosphere. 2011;82(5):656–62.
17. Kitayama A, Arisawa K, Uemura H, Hiyoshi M, Takami H, Sawachika F, et al. Correlations of fish intake and plasma docosahexaenoic acid levels with each congener of PCDDs/PCDFs/dioxin-like PCBs in blood from the Japanese population. Int Arch Occup Environ Health. 2011;84(8):927–35. 18. Nakamoto M, Arisawa K, Uemura H, Katsuura S, Takami H, Sawachika F, et al.
Association between blood levels of PCDDs/PCDFs/dioxin-like PCBs and history of allergic and other diseases in the Japanese population. Int Arch Occup Environ Health. 2013;86(8):849–59.
19. Yamaguchi M, Arisawa K, Uemura H, Katsuura-Kamano S, Takami H, Sawachika F, et al. Consumption of seafood, serum liver enzymes, and blood levels of PFOS and PFOA in the Japanese population. J Occup Health. 2013;55(3):184–94.
20. Uemura H, Katsuura-Kamano S, Yamaguchi M, Sawachika F, Arisawa K. Serum hepatic enzyme activity and alcohol drinking status in relation to the prevalence of metabolic syndrome in the general Japanese population. PLoS One. 2014;9(4):e95981.
21. Masuzaki Y, Matsumura T, Hattori T, Kimura S, Noda H, Hashimoto S, et al. Sensitive determination method of dioxins and related compounds in human blood. Organohalogen Compd. 1999;40:227–30.
23. Recommended toxicity equivalence factors (TEFs) for human health risk assessments of 2,3,7,8-tetrachlorodibenzo-p-dioxin and dioxin-like compounds. Risk assessment forum, Washington, DC. EPA/600/R-10/005. 2010.https://rais.ornl.gov/documents/dioxin_tef.pdf. Accessed 16 Oct 2017. 24. Baccarelli A, Pfeiffer R, Consonni D, Pesatori AC, Bonzini M, Patterson DG, et al. Handling of dioxin measurement data in the presence of non-detectable values: overview of available methods and their application in the Seveso chloracne study. Chemosphere. 2005; 60(7):898-906.
25. Ministry of the Environment, Government of Japan. Report of a survey on the accumulation of dioxins and other chemical compounds in humans. 2012.https://www.env.go.jp/chemi/dioxin/pamph/cd/en_full.pdf. Accessed 16 Oct 2017.
26. White SS, Birnbaum LS. An overview of the effects of dioxins and dioxin-like compounds on vertebrates, as documented in human and ecological epidemiology. J Environ Sci Health C Environ Carcinog Ecotoxicol Rev. 2009; 27(4):197–211.
27. Azur MJ, Stuart EA, Frangakis C, Leaf PJ. Multiple imputation by chained equations: what is it and how does it work? Int J Methods Psychiatr Res. 2011;20(1):40–9.
28. Newman DA. Missing data: five practical guidelines. Organ Res Methods. 2014;17(4):372–411.
29. Schuhmacher M, Fabrega F, Kumar V, Garcia F, Nadal M, Domingo JL. A PBPK model to estimate PCDD/F levels in adipose tissue: comparison with experimental values of residents near a hazardous waste incinerator. Environ Int. 2014;73:150–7.
30. Consonni D, Sindaco R, Bertazzi PA. Blood levels of dioxins, furans, dioxin-like PCBs, and TEQs in general populations: a review, 1989-2010. Environ Int. 2012;44:151–62.
31. Humblet O, Williams PL, Korrick SA, Sergeyev O, Emond C, Birnbaum LS, et al. Predictors of serum dioxin, furan, and PCB concentrations among women from Chapaevsk, Russia. Environ Sci Technol. 2010;44(14):5633–40. 32. Fromme H, Albrecht M, Appel M, Hilger B, Volkel W, Liebl B, et al. PCBs,
PCDD/Fs, and PBDEs in blood samples of a rural population in South Germany. Int J Hyg Environ Health. 2015;218(1):41–6.
33. Fromme H, Hilger B, Albrecht M, Gries W, Leng G, Volkel W. Occurrence of chlorinated and brominated dioxins/furans, PCBs, and brominated flame retardants in blood of German adults. Int J Hyg Environ Health. 2016;219(4– 5):380–8.
34. Wittsiepe J, Fobil JN, Till H, Burchard GD, Wilhelm M, Feldt T. Levels of polychlorinated dibenzo-p-dioxins, dibenzofurans (PCDD/Fs) and biphenyls (PCBs) in blood of informal e-waste recycling workers from Agbogbloshie, Ghana, and controls. Environ Int. 2015;79:65–73.
35. Manning TM, Roach AC, Edge KJ, Ferrell DJ. Levels of PCDD/Fs and dioxin-like PCBs in seafood from Sydney Harbour, Australia. Environ Pollut. 2017; 224:590–6.
36. Danjou AM, Fervers B, Boutron-Ruault MC, Philip T, Clavel-Chapelon F, Dossus L. Estimated dietary dioxin exposure and breast cancer risk among women from the French E3N prospective cohort. Breast Cancer Res. 2015;17:39. 37. Ministry of the Environment, Government of Japan. The exposure to
chemical compounds in the Japanese people. 2017.http://www.env.go.jp/ chemi/dioxin/pamph/cd/2017en_full.pdf. Accessed 18 Oct 2017. 38. Milbrath MO, Wenger Y, Chang CW, Emond C, Garabrant D, Gillespie BW, et
al. Apparent half-lives of dioxins, furans, and polychlorinated biphenyls as a function of age, body fat, smoking status, and breast-feeding. Environ Health Perspect. 2009;117(3):417–25.
39. Aylward LL, Collins JJ, Bodner KM, Wilken M, Bodnar CM. Elimination rates of dioxin congeners in former chlorophenol workers from Midland, Michigan. Environ Health Perspect. 2013;121(1):39–45.
40. Esposito M, Serpe FP, Diletti G, Messina G, Scortichini G, La Rocca C, et al. Serum levels of polychlorinated dibenzo-p-dioxins, polychlorinated dibenzofurans and polychlorinated biphenyls in a population living in the Naples area, southern Italy. Chemosphere. 2014;94:62–9.
41. Fierens S, Eppe G, De Pauw E, Bernard A. Gender dependent accumulation of dioxins in smokers. Occup Environ Med. 2005;62(1):61–2.
42. Aylward LL, Brunet RC, Carrier G, Hays SM, Cushing CA, Needham LL, et al. Concentration-dependent TCDD elimination kinetics in humans: toxicokinetic modeling for moderately to highly exposed adults from Seveso, Italy, and Vienna, Austria, and impact on dose estimates for the NIOSH cohort. J Expo Anal Environ Epidemiol. 2005;15(1):51–65. 43. Brauner EV, Raaschou-Nielsen O, Gaudreau E, LeBlanc A, Tjonneland A,
Overvad K, et al. Predictors of polychlorinated biphenyl concentrations in
adipose tissue in a general Danish population. Environ Sci Technol. 2011; 45(2):679–85.
44. Ingelido AM, Abate V, Abballe A, Albano FL, Battista T, Carraro V, et al. Concentrations of polychlorinated dibenzodioxins, polychlorodibenzofurans, and polychlorobiphenyls in women of reproductive age in Italy: A human biomonitoring study. Int J Hyg Environ Health. 2017; 220(2 Pt B):378-86. 45. Domingo JL, Bocio A. Levels of PCDD/PCDFs and PCBs in edible marine species and human intake: a literature review. Environ Int. 2007; 33(3):397-405.
46. Kvalem HE, Brantsaeter AL, Meltzer HM, Stigum H, Thomsen C, Haugen M, et al. Development and validation of prediction models for blood concentrations of dioxins and PCBs using dietary intakes. Environ Int. 2012; 50:15-21.
47. Lubin JH, Colt JS, Camann D, Davis S, Cerhan JR, Severson RK, et al. Epidemiologic evaluation of measurement data in the presence of detection limits. Environ Health Perspect. 2004;112(17):1691-6. 48. Schisterman EF, Vexler A, Whitcomb BW, Liu A. The limitations due to
exposure detection limits for regression models. Am J Epidemiol. 2006; 163(4):374-83.
49. Sterne JA, White IR, Carlin JB, Spratt M, Royston P, Kenward MG, et al. Multiple imputation for missing data in epidemiological and clinical research: potential and pitfalls. BMJ. 2009;338:b2393.
![Fig. 1 Map of Japan showing the origins of the 490 participants [N (%)] and their median blood dioxin total TEQ (range) in pg TEQ/g lipid](https://thumb-us.123doks.com/thumbv2/123dok_us/9406722.1925753/6.595.56.537.87.325/japan-showing-origins-participants-median-dioxin-range-lipid.webp)