Civil and Environmental Engineering Faculty
Publications and Presentations Civil and Environmental Engineering
1-2015
Empirical Evaluation of Transit Signal Priority through Fusion of
Heterogeneous Transit and Traffic Signal Data and Novel
Performance Measures
Wei Feng
Chicago Transit Authority Miguel A. Figliozzi
Portland State University, figliozzi@pdx.edu
Robert Bertini
California Polytechnic State University, San Luis Obispo
Let us know how access to this document benefits you.
Follow this and additional works at:https://pdxscholar.library.pdx.edu/cengin_fac Part of theTransportation Engineering Commons
This Post-Print is brought to you for free and open access. It has been accepted for inclusion in Civil and Environmental Engineering Faculty Publications and Presentations by an authorized administrator of PDXScholar. For more information, please contactpdxscholar@pdx.edu.
Citation Details
Feng, Wei; Figliozzi, Miguel A.; and Bertini, Robert, "Empirical Evaluation of Transit Signal Priority through Fusion of Heterogeneous Transit and Traffic Signal Data and Novel Performance Measures" (2015).Civil and Environmental Engineering Faculty Publications and Presentations. 293.
Empirical Evaluation of Transit Signal Priority through Fusion of
Heterogeneous Transit and Traffic Signal Data and Novel
Performance Measures
Wei Feng Analyst
Performance Management
Chicago Transit Authority, Chicago, IL 60661 Email: wfeng@transitchicago.com
Miguel Figliozzi* Associate Professor
Department of Civil and Environmental Engineering
Portland State University, P.O. Box 751, Portland, OR 97201 PH (503) 725-2836; FAX (503) 725-5950
Email: figliozzi@pdx.edu
Robert L. Bertini Associate Professor
Department of Civil and Environmental Engineering California Polytechnic State University, San Luis Obispo 1 Grand Avenue, San Luis Obispo, CA 93407-0353 Email: rbertini@calpoly.edu
Resubmitted: November 15, 2014
Submitted for presentation and publication to the 94th Annual Meeting of the Transportation Research Board (January 2015) and the Journal of Transportation Research Record
*Corresponding Author
ABSTRACT
Transit signal priority (TSP) can reduce transit delay at signalized intersections by making phasing adjustments. TSP is a relatively inexpensive and easy to implement tool to make transit service faster and more reliable. TSP also sends a signal that a city or region encourages the growth of transit mode split. With the aim of assessing the performance of an existing TSP system, this study had access to a unique set of high-resolution bus and traffic signal data. Novel algorithms and performance measures to measure TSP performance are proposed. Results indicate that a timely and effective TSP system requires a high degree of sophistication, monitoring and maintenance. Empirical data suggest that most TSP phase adjustments were granted within the same cycle when buses request priority but that only a small proportion resulted in reduced delay. In this study, many green extension (GE) phases were granted late making them less effective than early (EG) signal phases. Despite this, the TSP system did not increase delays for passengers and vehicles when side street traffic is considered.
INTRODUCTION AND BACKGROUND
1
Transit signal priority (TSP) is the process of detecting transit vehicles approaching signalized 2
intersections and adjusting the signal phasing in real time to reduce transit delay (1). TSP is 3
relatively inexpensive and easy to implement to improve transit reliability and bus travel 4
speed(2). TSP phase adjustments include: green extension (GE) and early green (EG), or red 5
truncation. GE extends a green phase for a period of time to speed bus passage through an 6
intersection before the signal turns red. EG truncates a red phase and begins the green phase 7
early to help transit vehicles begin moving early. 8
A TSP system typically consists of three components: 1) an onboard priority request 9
generator that alerts the intersection traffic control system that the bus requests priority; 2) a 10
detection system that receives the priority request and informs the traffic controller where the bus 11
is located; 3) a priority control strategy that determines whether to grant a TSP phase, which TSP 12
phase should be granted, and when the TSP phase should start and end (2). Priority control 13
strategies fall into three categories (1). Passive priority grants priority regardless of the state of 14
the intersection or the bus. Active priority grants priority only when the states of the bus and the 15
intersection meet certain requirements; the duration of the GE and EG phases are usually 16
constant. Real-time optimal priority strategies make TSP decisions in real-time based on the 17
states of the bus and the intersection. The objective may be to minimize the total passenger delay 18
of an intersection (3, 4), to minimize bus schedule deviations (5, 6), or to minimize other 19
performance measures (7–10). 20
TSP strategies have been evaluated utilizing analytic or simulation models, with 21
significant variations in results. Balke et al. (11) simulated active priority at an isolated 22
intersection with both GE and EG phases and found significant reductions in bus travel time with 23
minor increases in total intersection delay under moderate traffic levels. Furth and Muller (1) 24
evaluated the passive and active TSP systems in a corridor using simulation, with significant 25
improvement in bus schedule adherence. However, active priority had almost no impact on 26
traffic delay and passive priority significantly increased traffic delay. Skabardonis (12) evaluated 27
proposed passive and active priority strategies on a coordinated signal system corridor with 21 28
intersections. Simulation showed that TSP strategies provide modest improvement for buses 29
without adverse effects on auto traffic. Dion et al. (13) evaluated active priority strategies using 30
simulation on an arterial corridor, showing that buses would benefit from TSP at the expense of 31
increasing overall traffic delays. Under low traffic flows, the negative impacts were negligible. 32
Byrne et al. (14) evaluated a conditional TSP system at a single intersection using simulation, 33
resulting in 11% bus travel time savings at far-side stops and a 6% increase in bus travel time at 34
near-side stops. One study found that TSP is more efficient at far-side bus stops because there is 35
less intersection arrival time uncertainty (15). Bus arrival time prediction and fast TSP activation 36
and deactivation are key factors affecting TSP effectiveness as shown in a later Section. 37
Unlike previous studies that used simulation to study TSP systems, Lin (16) used 38
analytical models, and found that buses traveling along minor cross streets benefit more than 39
buses traveling on the major arterial. Skabardonis and Christofa (17) also used analytical models 40
to estimate the potential impact of TSP on intersection level of service (LOS). Results show that 41
TSP has little impact on intersection LOS under low and moderate traffic flow but can 42
deteriorate intersection LOS under high traffic flow conditions. In summary, proposed TSP 43
control strategies have been evaluated using analytic or simulation models and results are not 44
always consistent. This may be due a lack of consistency controlling for factors such as 45
intersection geometry, signal timing, traffic demand, TSP control strategies and parameters, 46
transit vehicle headways, reliability of detection system and the TSP request generating system 1
(18). Also, simulation and analytical models have been used for pre-TSP installation evaluation, 2
while this paper focuses on methodologies that integrate multiple sources of empirical data to 3
evaluate an existing TSP system’s performance. 4
Several studies have empirically evaluated TSP systems, with varying results. Hunter-5
Zaworski et al. (19) collected travel time data for buses and other vehicles at four intersections 6
on Powell Blvd. in Portland, Oregon, before and after the implementation of an active TSP 7
system. They found that after TSP implementation bus travel time decreased during peak hours 8
but increased during off-peak hours and that intersection total person delay increased at certain 9
times of day. Koonce et al. (20) evaluated a TSP system on Barbur Blvd., also in Portland, 10
showing that bus travel time decreased 0.4–3.2 minutes and travel time variability decreased 2.2– 11
19.2% during different times of day and travel directions. No difference was found in bus travel 12
time between late and on-time buses. Kimpel et al. (21) evaluated changes in bus running times, 13
on-time performance, and excess passenger waiting times following TSP implementation on 14
several corridors in Portland, showing that TSP benefits are neither consistent across routes and 15
time periods nor across performance measures. Slavin et al. (22) evaluated TSP on Powell Blvd. 16
using regression models, showing significant reductions in bus corridor travel time for buses that 17
requested TSP. Albright and Figliozzi (23) used regression models to evaluate TSP on the same 18
corridor, showing that a bus that requested signal priority significantly shortened the headway to 19
its preceding bus and increased the headway to its following bus. Albright and Figliozzi (24) also 20
found that late bus recovery (bus schedule delay before and after an intersection) varied but was 21
greater at intersections with less demand on the minor cross streets. Diab and El-Geneidy (25, 26) 22
used regression models to study an active TSP system on two bus routes in Montreal, Canada. 23
Results indicated that bus travel times for the two bus routes significantly decreased with TSP 24
and that TSP equipped buses have shorter travel times than non-equipped buses. . 25
No empirical study has compared the performance and delay reduction efficiency of EG and 26
GE phases. This study fills this gap by integrating TSP traffic signal phase log data, automatic 27
vehicle location (AVL), and automated passenger count (APC) data. This study proposes new 28
performance measures for evaluating TSP system timeliness, effectiveness and efficiency and to 29
compare the performance of GE and EG TSP phases. 30
31
STUDY CORRIDOR AND DATA DESCRIPTION
32
Powell Boulevard is a 4-mile long major urban arterial corridor in Portland, Oregon, with two 33
lanes in each direction; downtown Portland is located to the west of the figure. Bus route 9 is the 34
primary bus route operated along this corridor, which runs east-west with an average headway of 35
15 minutes during midday and an average headway of 6–7 minutes during the morning and 36
evening peak periods. The Sydney Coordinated Adaptive Traffic System (SCATS) is 37
implemented at 12 signalized intersections between Milwaukie Ave. and 72nd Ave. An active 38
transit signal priority (TSP) system is programmed to respond to bus priority requests from both 39
the EB and WB directions at each of the 12 intersections. An infrared emitter on a bus is 40
activated and a priority request is sent to downstream traffic signals whenever these conditions 41
are met: 1) within the City of Portland; 2) on-route; 3) doors are closed; and 4) more than 30 42
seconds late. At a signalized intersection, an Opticom detector on the traffic signal mast arm 43
receives the priority request and relays the request to the signal controller. Based on the cycle 44
sequence, either an EG or a GE can be granted. It is possible that a bus passes the intersection 45
but the TSP request is not cancelled by SCATS. 46
There are 22 bus stops and 21 bus stop-to-stop segments (between two consecutive bus 1
stops) in each direction between Milwaukie and 72nd Ave. There are 18 bus stop-to-stop 2
segments that include one SCATS signals, and 3 segments that include two signals. This study 3
focuses on the 18 segments with one signal (see Figure 1 (b)). Six of these are near-side 4
segments where the departure stop of the stop-to-stop segment is a near-side stop and 12 are far-5
side segments, where the arrival stop of the stop-to-stop segment is a far-side stop. March 2013 6
weekday data records were collected and integrated for the 18 stop-to-stop segments. 7
In the bus AVL/APC data, every time a bus makes a stop, the actual arrival time and 8
departure time, scheduled departure time, passenger load and the number of boarding and 9
alighting passengers are recorded (27, 28). The AVL data is only available when buses arrive at 10
bus stops, therefore, no bus location is provided between bus stops. Bus departure time is the 11
time when a bus leaves 50 feet downstream of the bus stop; bus arrival time is the bus door open 12
time at a bus stop. If a bus skipped a bus stop, the arrival time is the time when the bus is 50 feet 13
upstream of the bus stop. SCATS signal phase data records the start time and end time of each 14
phase including regular green phase, red phase and transit signal priority phases (GE and EG). 15
The SCATS system also provides vehicle count data for each approaching lane of an intersection 16
at 15-minute intervals. A more detailed description of the three data sources can be found in 17
Feng (29). 18
19
ESTIMATION OF BUS INTERSECTION ARRIVAL TIME
20
A detailed study of TSP performance at the signal phase level requires bus intersection arrival 21
time data. However, bus trajectories are unknown between bus stops and hence intersection 22
arrival time is also unknown. Bus intersection arrival time is necessary to estimate the bus 23
arrival phase (signal phase active when bus reaches intersection). This study has developed 1) 24
an algorithm to estimate bus stop-to-stop travel speed and 2) an algorithm to estimate the phase 25
encountered by a bus arriving at an intersection. These algorithms produce probability 26
distributions associated with travel time and arrival phase. 27
28
Estimation of Bus Travel Speed Distributions
29
Intersection arrival time is estimated utilizing bus stop-to-stop travel speed data that excludes 30
trips that experience signal delay. The inclusion of buses that experienced signal delay would 31
bias the results by incorrectly lowering stop to intersection travel speeds. The method used to 32
exclude observations that include signal delay is the following: 33
34
(a) Disaggregate stop-to-stop travel times by time of day and stop-to-stop segment. 35
(b) Assume that the total number of bus travel speed observations for a bus stop-to-stop 36
segment at a certain time of day is 𝑁 and that the ratio between the median red phase 37
duration and the cycle length of the intersection is 𝑅𝐶 (0 < 𝑅𝐶 < 1). 38
(c) Order the 𝑁 bus travel speed observations from lowest to highest. 39
(d) Remove the first 𝑁 ∙𝑅𝐶 lowest bus speed observations (round up/down to get an integer). 40
(e) Use the remaining 𝑁 ∙ (1 −𝑅𝐶) speed observations to estimate a frequency based travel 41
speed probability distribution utilizing 1 mph speed bins; denote this distribution as 𝑓(𝑣) 42
(f) Find the minimum and maximum speeds and denote them 𝑣𝑚𝑖𝑛 and 𝑣𝑚𝑎𝑥 respectively. 43
1 2 (a) 3 4 (b) 5
Figure 1. Study corridor and bus stop-to-stop segments
6 7
Four times of day are used: AM peak (7–9 am), Mid-day (9 am–4 pm), PM peak (4–6 pm) 8
and Evening (6 pm–7 am). It is assumed that the estimated bus travel speed distribution for the 9
stop-to-stop segment applies to both the upstream (departure bus stop to intersection stop bar) 10
and the downstream (intersection stop bar to downstream or arrival bus stop) portions. Travel 11
time distributions vary significantly throughout the day (29). 12
13
Estimation of Bus Arrival Phase
14
The bus intersection arrival time distribution is a function of travel speed, bus departure time at 15
the upstream stop, bus arrival time at the downstream stops and signal phase start and end times. 16
Notation is presented below. 17
Define 𝑰as the set of bus trips for a stop-to-stop segment that contains one signalized 18
intersection and 𝑖 as the index for the 𝑖th bus trip, 𝑖 ∈ 𝑰. Define 𝑱 as the set of cycles for the 19
signalized intersection in the bus stop-to-stop segment and 𝑗 as the index for the 𝑗th cycle, 𝑗 ∈ 𝑱; 20
Downtown Portland
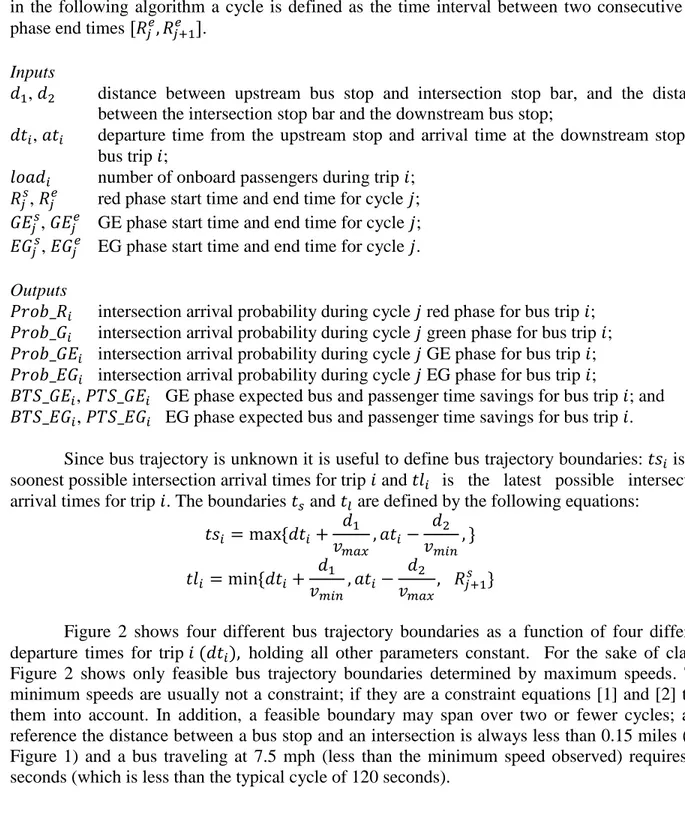
in the following algorithm a cycle is defined as the time interval between two consecutive red 1
phase end times [𝑅𝑗𝑒, 𝑅𝑗+1𝑒 ]. 2
3
Inputs 4
𝑑1, 𝑑2 distance between upstream bus stop and intersection stop bar, and the distance 5
between the intersection stop bar and the downstream bus stop; 6
𝑑𝑡𝑖, 𝑎𝑡𝑖 departure time from the upstream stop and arrival time at the downstream stop for 7
bus trip 𝑖; 8
𝑙𝑜𝑎𝑑𝑖 number of onboard passengers during trip 𝑖; 9
𝑅𝑗𝑠, 𝑅
𝑗𝑒 red phase start time and end time for cycle 𝑗; 10
𝐺𝐸𝑗𝑠, 𝐺𝐸
𝑗𝑒 GE phase start time and end time for cycle 𝑗; 11
𝐸𝐺𝑗𝑠, 𝐸𝐺𝑗𝑒 EG phase start time and end time for cycle 𝑗. 12
13
Outputs 14
𝑃𝑟𝑜𝑏_𝑅𝑖 intersection arrival probability during cycle 𝑗 red phase for bus trip 𝑖; 15
𝑃𝑟𝑜𝑏_𝐺𝑖 intersection arrival probability during cycle 𝑗 green phase for bus trip 𝑖; 16
𝑃𝑟𝑜𝑏_𝐺𝐸𝑖 intersection arrival probability during cycle 𝑗 GE phase for bus trip 𝑖; 17
𝑃𝑟𝑜𝑏_𝐸𝐺𝑖 intersection arrival probability during cycle 𝑗 EG phase for bus trip 𝑖; 18
𝐵𝑇𝑆_𝐺𝐸𝑖, 𝑃𝑇𝑆_𝐺𝐸𝑖 GE phase expected bus and passenger time savings for bus trip 𝑖; and 19
𝐵𝑇𝑆_𝐸𝐺𝑖, 𝑃𝑇𝑆_𝐸𝐺𝑖 EG phase expected bus and passenger time savings for bus trip 𝑖. 20
21
Since bus trajectory is unknown it is useful to define bus trajectory boundaries: 𝑡𝑠𝑖 is the 22
soonest possible intersection arrival times for trip 𝑖 and 𝑡𝑙𝑖 is the latest possible intersection 23
arrival times for trip 𝑖. The boundaries 𝑡𝑠 and 𝑡𝑙 are defined by the following equations: 24 𝑡𝑠𝑖 = max {𝑑𝑡𝑖+ 𝑑1 𝑣𝑚𝑎𝑥, 𝑎𝑡𝑖− 𝑑2 𝑣𝑚𝑖𝑛, } [1] 𝑡𝑙𝑖 = min {𝑑𝑡𝑖 + 𝑑1 𝑣𝑚𝑖𝑛, 𝑎𝑡𝑖 − 𝑑2 𝑣𝑚𝑎𝑥, 𝑅𝑗+1𝑠 } [2] 25
Figure 2 shows four different bus trajectory boundaries as a function of four different 26
departure times for trip 𝑖 (𝑑𝑡𝑖), holding all other parameters constant. For the sake of clarity 27
Figure 2 shows only feasible bus trajectory boundaries determined by maximum speeds. The 28
minimum speeds are usually not a constraint; if they are a constraint equations [1] and [2] take 29
them into account. In addition, a feasible boundary may span over two or fewer cycles; as a 30
reference the distance between a bus stop and an intersection is always less than 0.15 miles (see 31
Figure 1) and a bus traveling at 7.5 mph (less than the minimum speed observed) requires 72 32
seconds (which is less than the typical cycle of 120 seconds). 33
34
(a) (b)
(c) (d)
Figure 2. Example of feasible bus stop-to-stop trip trajectories
1 2
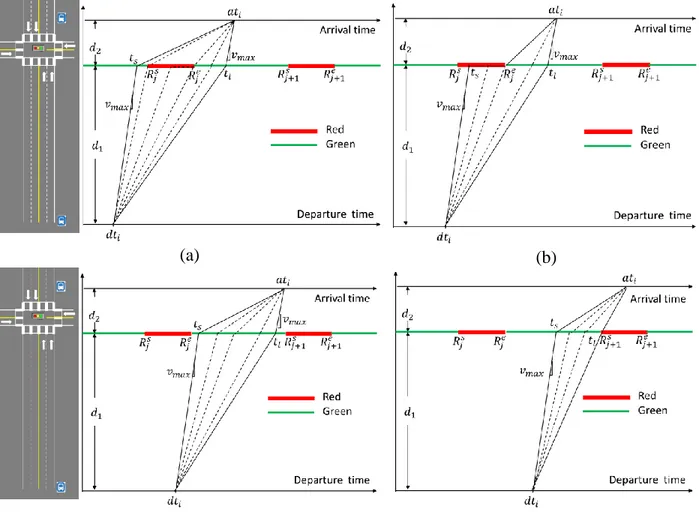
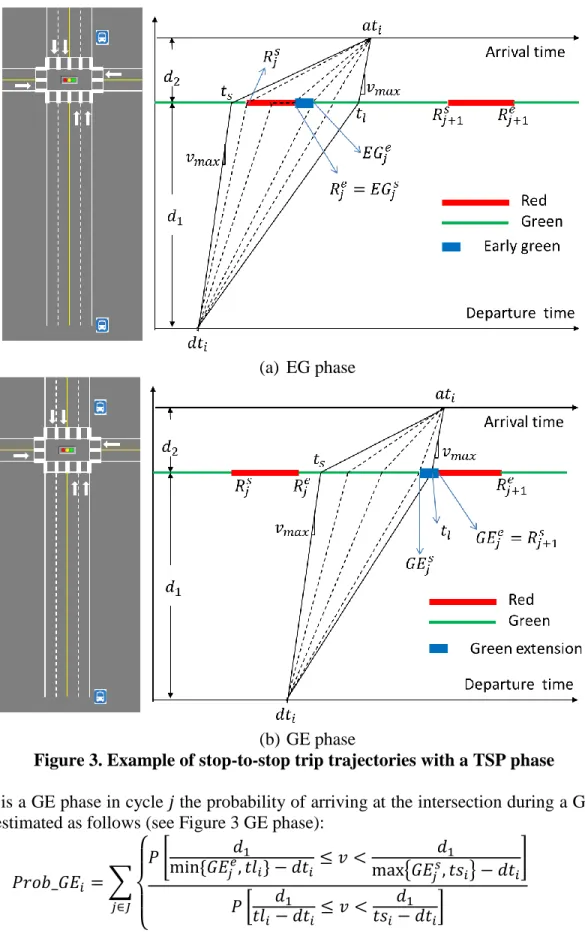
Then 𝑃𝑟𝑜𝑏_𝐺𝑖 ≡ 1 − 𝑃𝑟𝑜𝑏_𝑅𝑖 𝑓𝑜𝑟 ∀𝑖 ∈ 𝑰 where it is assumed that the yellow time is utilized 3
as green time and that there is no TSP phase. When there is an EG TSP phase in a cycle 𝑗, the 4
probability of arriving at the intersection during the EG can be estimated as follows (see Figure 3 5 EG phase): 6 7 𝑃𝑟𝑜𝑏_𝐸𝐺𝑖 = ∑ 𝑃 [ 𝑑1 min {𝐸𝐺𝑗𝑒, 𝑡𝑙 𝑖} − 𝑑𝑡𝑖 ≤ 𝑣 < 𝑑1 max{𝐸𝐺𝑗𝑠, 𝑡𝑠 𝑖} − 𝑑𝑡𝑖] 𝑃 [ 𝑑1 𝑡𝑙𝑖− 𝑑𝑡𝑖 ≤ 𝑣 <𝑡𝑠𝑖𝑑− 𝑑𝑡1 𝑖] 𝑗∈𝐽 [5] 8
1 (a) EG phase 2 3 (b) GE phase 4
Figure 3. Example of stop-to-stop trip trajectories with a TSP phase
5 6
If there is a GE phase in cycle 𝑗 the probability of arriving at the intersection during a GE can be estimated as follows (see Figure 3 GE phase):
𝑃𝑟𝑜𝑏_𝐺𝐸𝑖 = ∑ { 𝑃 [ 𝑑1 min {𝐺𝐸𝑗𝑒, 𝑡𝑙 𝑖} − 𝑑𝑡𝑖 ≤ 𝑣 < 𝑑1 max{𝐺𝐸𝑗𝑠, 𝑡𝑠 𝑖} − 𝑑𝑡𝑖] 𝑃 [ 𝑑1 𝑡𝑙𝑖 − 𝑑𝑡𝑖 ≤ 𝑣 < 𝑡𝑠𝑖𝑑− 𝑑𝑡1 𝑖] 𝑗∈𝐽 [6] 7
TPS PERFORMANCE EVALUATION RESULTS
1
TSP performance can be evaluated along multiple dimensions. A novel contribution of this 2
research is to define four dimensions for TSP performance evaluation: 1) Frequency, 2) 3
Responsiveness, 3) Timeliness, and 4) Effectiveness. 4
5
TSP Frequency
6
TSP systems can be deployed but few phases may actually be granted as shown in Figure 4. 7
There is no correlation between the number of trips and the number of EG and GE TSP phases 8
granted even though this corridor have almost the same bus frequency in both directions. The 9
ratio of TSP phases and requests shows that very few TSP phases were granted at the 10
intersections of 26th Ave. and 33rd Ave.; the low frequency indicates a potential TSP setting 11
problem. A TSP configuration problem was later confirmed by the City of Portland which 12
indicates the usefulness of TSP frequency as an initial TSP performance detection tool. In the 13
rest of this section we omit results for 26th Ave. and 33rd Ave. intersections. 14
15
TSP Responsiveness
16
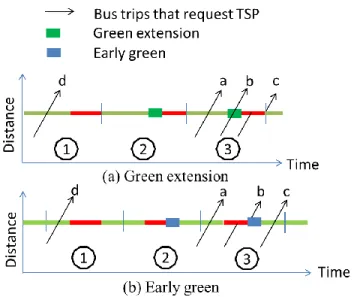
Responsiveness aims to measure whether TSP phases are granted to buses that (a) request 17
priority and (b) arrive at the intersection during the cycle when the TSP phase was granted. The 18
cycles are defined around GE and EG phases. As shown in Figure 5, a “responsive” cycle for a 19
GE phase is the time interval between two consecutive green phase start times that includes the 20
GE phase and a bus that requested TSP arrives at the intersection during this cycle (e.g. cycle ③ 21
in Figure 5 (a)); a “responsive” cycle for an EG phase is the time interval between the middle 22
time of two green phases that includes both the EG phase and the arrival of a bus that has 23
requested TSP during this cycle (e.g. cycle ③ in Figure 5 (b)). In Figure 5 (a) and (b), bus “d” 24
arrives at the intersection in cycle ① and triggers a TSP phase in cycle ②; therefore, this TSP 25
phase in cycle ② is not “responsive” to any bus. Bus “a”, “b” or “c” arrives at the intersection in 26
cycle ③ and triggers a TSP phase granted in the same cycle; therefore, bus “a”, “b” or “c” 27
triggers a “responsive” TSP phase. Because bus travel time distributions are known, for each 28
TSP phase it is possible to estimate the probability that at least one bus arrived in an EG or GE 29
phase. 30
31 32
1
(a) Average number of bus trips per day.
2 3
4
(b)Average number of TSP phases per day.
5
6
(c) % TSP phases per TSP requests
7 8 Figure 4.TSP Frequency 9 0 10 20 30 40 50 60 70 80 90 26th 33rd 39th 42nd 50th 52nd 65th 69th 71st 72nd Num ber of bu s tr ips
requested TSP did not request TSP
0 10 20 30 40 26th 33rd 39th 42nd 50th 52nd 65th 69th 71st 72nd Nu m b e r of T SP p h ases
Green Extension (GE) Early Green (EG)
0% 10% 20% 30% 40% 50% 60% 26th 33rd 39th 42nd 50th 52nd 65th 69th 71st 72nd R ati o GE / TSP requests EG / TSP requests
1 2
3
Figure 5. TSP timeliness and effectiveness example
4 5
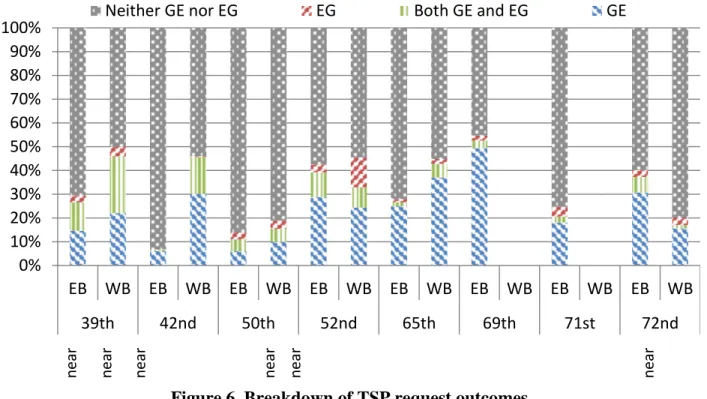
A bus trip that requests priority has four potential outcomes: 6
1. intersection arrival during a cycle with GE phase, 7
2. intersection arrival during a cycle with EG phase, 8
3. intersection arrival during a cycle with both GE and EG phases; and 9
4. intersection arrival during a cycle with neither a GE nor an EG phase. 10
11
Neither GE nor EG means that a bus requested TSP but no green extension (GE) or early green 12
(EG) phase was granted within the same cycle. Figure 6 shows the breakdown of the four 13
outcomes for TSP requests at each intersection from both directions. Note that there are no 14
results for the intersections at 69th and 71st Ave. in the WB direction because there are two 15
signalized intersections in this stop-to-stop segment and the algorithm presented in the previous 16
Section does not estimate bus arrival times at each of the two intersections. Results vary 17
significantly across intersections and by direction. For example, very few TSP requests resulted 18
in the “responsive” granting of a TSP phase at 42nd Ave. in the EB direction or at 50th Ave. in 19
either direction. Overall, results show that more than half of the TSP requests did not result in the 20
granting of any responsive TSP phase. Also TSP requests resulted in more GE phases than EG 21
phases, and there is no clear difference in the results between near-side segments and far-side 22
segments. 23
1
Figure 6. Breakdown of TSP request outcomes
2 3
TSP Timeliness
4
TSP can be responsive at some intersections but not necessarily “timely” by occurring at suitable 5
times. In Figure 5, buses “a”, “b” and “c” would all trigger a TSP phase granted in the same 6
cycle; however, only bus “b” would benefit from the TSP phase, which means that bus “b” saved 7
time due to the TSP phase. Buses “a” and “c” would trigger the TSP phase, but the TSP phase 8
would be late and early to buses “a” and “c”, respectively. Therefore, we define that the TSP 9
phase in cycle ③ is timely (on-time) for a bus that requests priority (a TSP request benefits from 10
a timely (on-time) TSP phase) 11
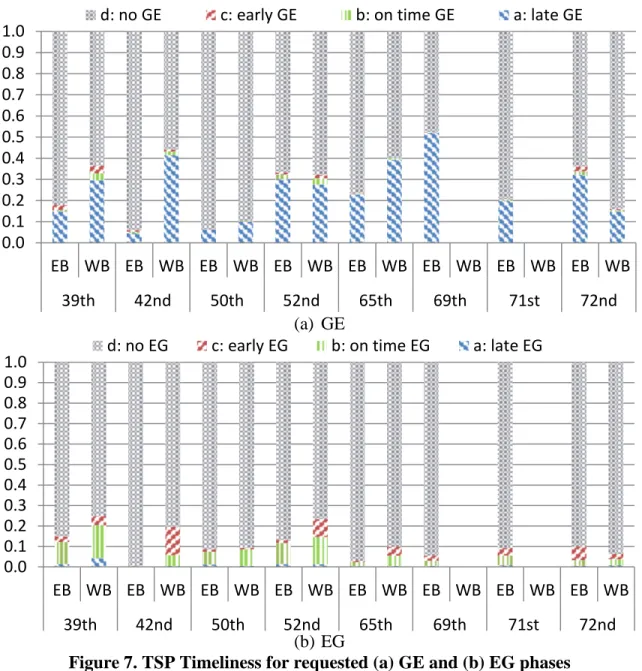
The probability that a TSP request triggered an early, on-time, late or out of cycle TSP 12
phase granted can be calculated using the formulas presented in the previous Section. Results are 13
shown in Figure 7 (a) and (b) for GE and EG phases, respectively. Figure 7 (a) and (b) show that 14
bus TSP requests have only 0–5% probability of benefiting from a GE phase and 0–15% 15
probability of benefiting from an EG phase, respectively. On average, across intersections, a bus 16
has a 25% probability of triggering a late GE phase. The results may indicate a problem with the 17
TSP control strategies, e.g. a GE phase may be granted irrespective of whether a TSP request is 18
received in the beginning of a regular green phase or at the end of a regular green phase. The 19
results may also indicate a problem with the TSP request deactivation. For example, a TSP call 20
in the signal controller may not have been canceled even if a bus has already passed the 21
intersection. It is also possible that there is a lag in how SCATS is processing the priority 22
requests because early green is happening on-time much more frequently than GE. 23 24 25 0% 10% 20% 30% 40% 50% 60% 70% 80% 90% 100% EB WB EB WB EB WB EB WB EB WB EB WB EB WB EB WB 39th 42nd 50th 52nd 65th 69th 71st 72nd
Neither GE nor EG EG Both GE and EG GE
n
1 (a) GE 2 3 (b) EG 4
Figure 7. TSP Timeliness for requested (a) GE and (b) EG phases
5 6
TSP Effectiveness
7
The goal of TSP systems is to reduce transit travel times and their variability. This final 8
performance measure aims to measure the effectiveness of TSP systems for reducing trip and 9
passenger travel times. A more complete measure of effectiveness includes time savings for 10
other vehicles on the major street and vehicle delays on minor streets. Since the average GE and 11
EG phase durations are different across intersections and phases, time savings and delays per 12
second of TSP phase are used in the comparisons. 13
For each bus stop-to-stop segment, the average bus passenger time savings per second 14
TSP phase can be estimated by: 15 16 ∑𝑖∈𝑰𝑃𝑇𝑆_𝐺𝐸𝑖 ∑ 𝐺𝐸𝑗𝑒− 𝐺𝐸 𝑗𝑠 𝑗∈𝑱 , ∑𝑖∈𝑰𝑃𝑇𝑆_𝐸𝐺𝑖 ∑ 𝐸𝐺𝑗𝑒− 𝐸𝐺 𝑗𝑠 𝑗∈𝑱 [7] 17 0.0 0.1 0.2 0.3 0.4 0.5 0.6 0.7 0.8 0.9 1.0 EB WB EB WB EB WB EB WB EB WB EB WB EB WB EB WB 39th 42nd 50th 52nd 65th 69th 71st 72nd
d: no GE c: early GE b: on time GE a: late GE
0.0 0.1 0.2 0.3 0.4 0.5 0.6 0.7 0.8 0.9 1.0 EB WB EB WB EB WB EB WB EB WB EB WB EB WB EB WB 39th 42nd 50th 52nd 65th 69th 71st 72nd
Formulas that were used to estimate bus and passenger time savings can be found in Feng (29). 1
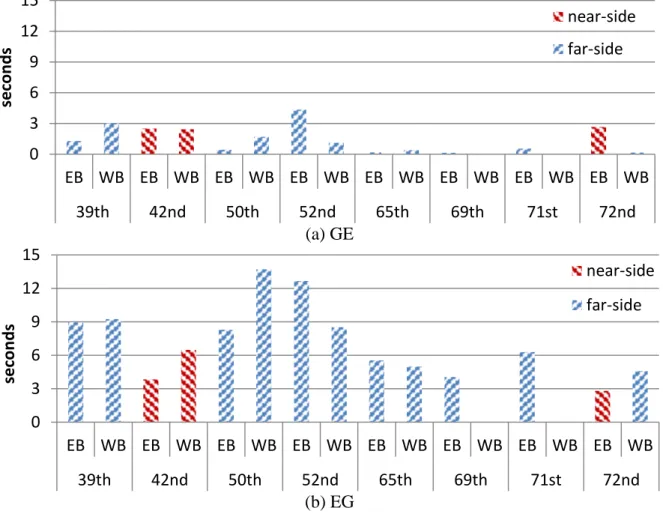
Figure 8 (a) and (b) show that the estimated total passenger time savings per second of GE phase 2
is much lower than for the EG phases. EG phases are relatively more effective than GE phases at 3
most intersections. This may be because there too many GE phases that are not utilized by buses. 4
Therefore, this may not be true if both GE and EG phases are working correctly. According to 5
(2), TSP should be more effective at far-side stops because bus arrival time prediction is more 6
reliable at far-side stops. However, Figure 8 (a) and (b) do not show clear differences between 7
near-side and far-side stops but this finding is not conclusive due to the small sample size (only 8
six near-side and twelve far-side segments). 9 10 11 (a) GE 12 13 (b) EG 14
Figure 8. Estimated total passenger time savings per second TSP phase
15 16
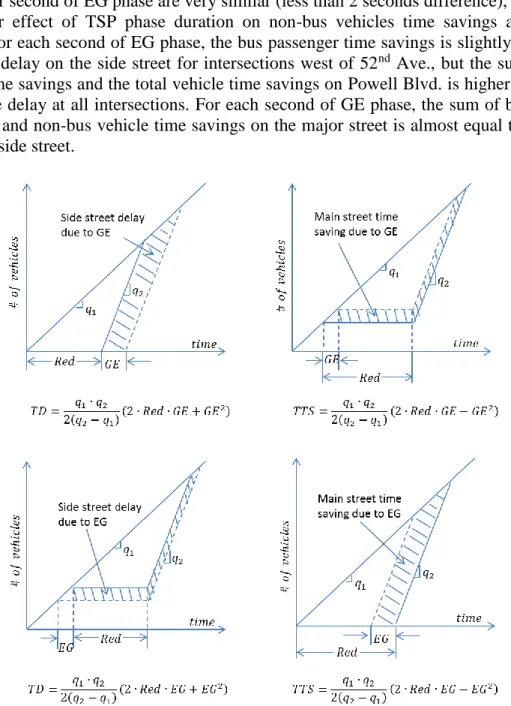
Assuming vehicle arrival rates at intersections are uniform (vehicle platooning arrival 17
patterns were not considered), traffic conditions are unsaturated at all four approaches, and 18
regular green phase and red phase durations will not change if a GE phase or an EG phase is 19
granted, the total time savings (TTS) for non-bus vehicles on the major street and the total delay 20
(TD) for vehicles on the side street can be estimated by the following: 21 22 𝑇𝑇𝑆 = 𝑞1∙ 𝑞2 2(𝑞2− 𝑞1)(2 ∙ 𝑅𝑒𝑑 ∙ 𝑇𝑆𝑃 − 𝑇𝑆𝑃2) [8] 0 3 6 9 12 15 EB WB EB WB EB WB EB WB EB WB EB WB EB WB EB WB 39th 42nd 50th 52nd 65th 69th 71st 72nd secon d s near-side far-side 0 3 6 9 12 15 EB WB EB WB EB WB EB WB EB WB EB WB EB WB EB WB 39th 42nd 50th 52nd 65th 69th 71st 72nd secon d s near-side far-side
𝑇𝐷 = 𝑞1∙ 𝑞2
2(𝑞2− 𝑞1)(2 ∙ 𝑅𝑒𝑑 ∙ 𝑇𝑆𝑃 + 𝑇𝑆𝑃 2)
[9] 1
The derivations of these equations are illustrated in Figure 9, where 𝑞2 is the discharge flow 2
(assumed to be 1,800 vehicles per hour per lane) and 𝑞1 is the vehicle arrival flow from an 3
approach of an intersection, estimated by the intersection vehicle count data. 𝑅𝑒𝑑 is the regular 4
red phase duration for an approach of an intersection. 𝑇𝑆𝑃 is the median TSP phase duration 5
(either GE or EG) for an intersection. 6
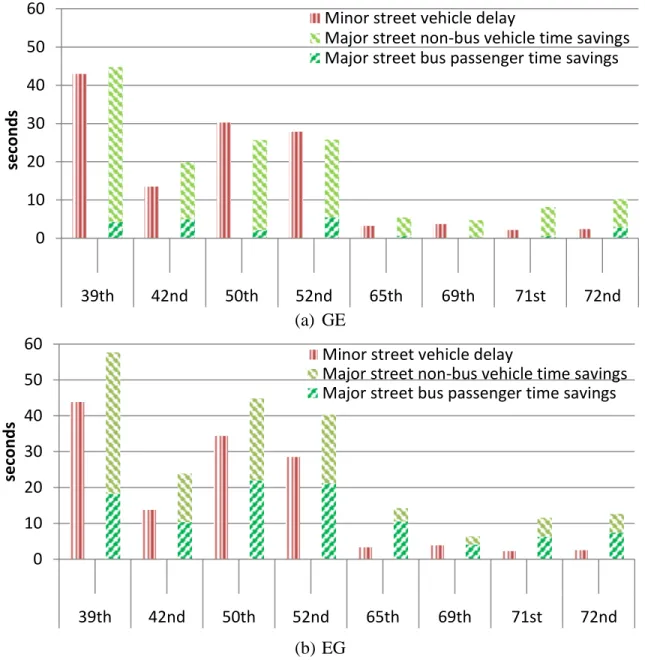
Assuming all non-bus vehicles are single occupancy vehicles, results are shown in Figure 7
10. Results show that the total time savings and delays for non-bus vehicles per second of GE 8
phase and per second of EG phase are very similar (less than 2 seconds difference), which means 9
the nonlinear effect of TSP phase duration on non-bus vehicles time savings and delays is 10
negligible. For each second of EG phase, the bus passenger time savings is slightly less than the 11
total vehicle delay on the side street for intersections west of 52nd Ave., but the sum of the bus 12
passenger time savings and the total vehicle time savings on Powell Blvd. is higher than the side 13
street vehicle delay at all intersections. For each second of GE phase, the sum of bus passenger 14
time savings and non-bus vehicle time savings on the major street is almost equal to the vehicle 15
delay on the side street. 16
17
18
Figure 9. Illustration of major street time savings and side street delay
1 2 (a) GE 3 4 (b) EG 5
Figure 10. Total passenger time savings and vehicle delays per second of TSP phase
6 7
CONCLUSIONS
8
TSP systems are relatively low cost and easy to implement systems that can improve transit 9
running times and reliability. This research shows that TSP systems can be challenging to 10
implement so that they are both timely and effective. TSP systems require not only maintenance 11
but also continuous monitoring to promptly detect problems and intersections with low TSP 12
performance. 13
This study developed a novel methodology to integrate traffic signal and AVL/APC 14
transit data for estimating bus arrival time and phase probability distributions at intersections and 15
bus travel time savings. Four novel TSP performance measures are proposed: frequency, 16
responsiveness, timeliness, and effectiveness. TSP by definition is a partnership between transit 17
agencies that operate the bus system and cities that manage the traffic signal system. Proactive 18 0 10 20 30 40 50 60 39th 42nd 50th 52nd 65th 69th 71st 72nd secon d s
Minor street vehicle delay
Major street non-bus vehicle time savings Major street bus passenger time savings
0 10 20 30 40 50 60 39th 42nd 50th 52nd 65th 69th 71st 72nd secon d s
Minor street vehicle delay
Major street non-bus vehicle time savings Major street bus passenger time savings
TSP performance analysis can help transit agencies and cities to better understand existing TSP 1
system performance, as well as identify potential problems and improvement opportunities. 2
Future research should examine TSP detector health and performance in other settings and 3
corridors. 4
For this study, results indicate that more than 80% of the TSP phases were granted within 5
the same cycle when a bus arrived at the intersection. However, the TSP timeliness was 6
relatively low during the study period, and a gap remains between the ideal TSP effectiveness 7
and its actual performance. EG phases were better than GE phases because too many GE phases 8
were granted late or lost. This may indicate some potential problems with the TSP control 9
strategies, bus emitter priority request activation/deactivation reliability, or priority request 10
detection reliability. Results also show that EG phases are more efficient than GE phases. The 11
estimated non-bus vehicles time savings and delay per second TSP phase are similar. The total 12
passenger time savings and delays per second GE phase are almost equal to each other; but the 13
total passenger time savings per second EG phase is much higher than the total non-bus vehicle 14
delay. 15
The TSP performance evaluation results provide worthwhile information for the city and 16
the transit agency to identify potential problems and improvement opportunities for the TSP 17
system. The algorithms and performance measures are general and can be applied to other 18
corridors where TSP is implemented. However, the specific values for GE and EG timeliness and 19
effectiveness are site specific. 20
21
ACKNOWLEDGEMENTS
22
The authors gratefully acknowledge the National Institute for Transportation Community (NITC) 23
for funding this research. We thank Steve Callas and David Crout from TriMet who have 24
provided valuable assistance, advice, and bus transit data. The authors would also like to thank 25
Willie Rotich from the Portland Bureau of Transportation for providing the SCATS and TSP 26
data and valuable assistance. Any errors or omissions are the sole responsibility of the authors. 27
REFERENCES
1 2
1. Furth, P., and T. H. Muller. Conditional Bus Priority at Signalized Intersections: Better 3
Service with Less Traffic Disruption. Transportation Research Record, Vol. 1731, 2000, pp. 4
23–30. 5
2. Smith, H. R., P. B. Hemily, and M. Ivanovic. Transit Signal Priority (TSP): A Planning and 6
Implementation Handbook. ITS America, 2005. 7
3. Christofa, E., and A. Skabardonis. Traffic Signal Optimization with Application of Transit 8
Signal Priority to an Isolated Intersection. Transportation Research Record, Vol. 2259, 9
2011, pp. 192–201. 10
4. Mirchandani, P. B., and D. E. Lucas. Integrated Transit Priority and Rail/Emergency 11
Preemption in Real-Time Traffic Adaptive Signal Control. Journal of Intelligent 12
Transportation Systems, Vol. 8, No. 2, 2004, pp. 101–115. 13
5. Ma, W., X. Yang, and Y. Liu. Development and Evaluation of a Coordinated and 14
Conditional Bus Priority Approach. Transportation Research Record, Vol. 2145, Dec. 2010, 15
pp. 49–58. 16
6. Ma, W., Y. Liu, and B. Han. A rule-based model for integrated operation of bus priority 17
signal timings and traveling speed: BUS PRIORITY SIGNAL TIMINGS. Journal of 18
Advanced Transportation, Vol. 47, No. 3, Apr. 2013, pp. 369–383. 19
7. Yagar, S., and B. Han. A Procedure for Real-Time Signal Control That Considers Transit 20
Interference and Priority. Transportation Research Part B: Methodological, Vol. 28, No. 4, 21
Aug. 1994, pp. 315–331. 22
8. Conrad, M., F. Dion, and S. Yagar. Real-Time Traffic Signal Optimization with Transit 23
Priority: Recent Advances in the Signal Priority Procedure for Optimization in Real-Time 24
Model. Transportation Research Record, Vol. 1634, 1998, pp. 100–109. 25
9. He, Q., K. L. Head, and J. Ding. Heuristic Algorithm for Priority Traffic Signal Control. 26
Transportation Research Record, Vol. 2259, 2011, pp. 1–7. 27
10. Dion, F., and B. Hellinga. A Rule-based Real-time Traffic Responsive Signal Control 28
System with Transit Priority: Application to An Isolated Intersection. Transportation 29
Research Part B: Methodological, Vol. 36, No. 4, 2002, pp. 325–343. 30
11. Balke, K., C. Dudek, and T. Urbanik II. Development and Evaluation of Intelligent Bus 31
Priority Concept. Transportation Research Record, Vol. 1727, 2000, pp. 12–19. 32
12. Skabardonis, A. Control Strategies for Transit Priority. Transportation Research Record: 33
Journal of the Transportation Research Board, Vol. 1727, No. -1, Jan. 2000, pp. 20–26. 34
13. Dion, F., H. Rakha, and Y. Zhang. Evaluation of Potential Transit Signal Priority Benefits 35
along a Fixed-Time Signalized Arterial. Journal of Transportation Engineering, Vol. 130, 36
No. 3, 2004, pp. 294–303. 37
14. Byrne, N., P. Koonce, R. Bertini, C. Pangilinan, and M. Lasky. Using Hardware-in-the-38
Loop Simulation to Evaluate Signal Control Strategies for Transit Signal Priority. 39
Transportation Research Record, Vol. 1925, 2005, pp. 227–234. 40
15. Chada, S., and R. Newland. Effectiveness of bus signal priority: final report. Publication 41
NCTR-416-04. 2002. 42
16. Lin, W.-H. Quantifying Delay Reduction to Buses with Signal Priority Treatment in Mixed-43
Mode Operation. Transportation Research Record, Vol. 1811, No. 1, 2002, pp. 100–106. 44
17. Skabardonis, A., and E. Christofa. Impact of Transit Signal Priority on Level of Service at 1
Signalized Intersections. In 6th International Symposium on Highway Capacity and Quality 2
of Service, No. 16, 2011. 3
18. Abdy, Z. R., and B. R. Hellinga. Analytical Method for Estimating the Impact of Transit 4
Signal Priority on Vehicle Delay. Journal of Transportation Engineering, Vol. 137, No. 8, 5
Aug. 2011, pp. 589–600. 6
19. Hunter-Zaworski, K. M., W. C. Kloos, and A. R. Danaher. Bus Priority at Traffic Signals in 7
Portland: The Powell Boulevard Pilot Project. Transportation Research Record, Vol. 1503, 8
1995, pp. 29–33. 9
20. Koonce, P. J. V., B. Kloos, and S. Callas. Bus priority at Traffic Signals in Portland— 10
Version 2.0: The Streamline Project. Presented at the ITE 2002 Annual Meeting and 11
Exhibit, 2002. 12
21. Kimpel, T., J. Strathman, R. Bertini, and S. Callas. Analysis of Transit Signal Priority 13
Using Archived TriMet Bus Dispatch System Data. Transportation Research Record, Vol. 14
1925, 2005, pp. 156–166. 15
22. Slavin, C., W. Feng, M. Figliozzi, and P. Koonce. A Statistical Study of the Impacts of 16
SCATS Adaptive Traffic Signal Control on Traffic and Transit Performance. 17
Transportation Research Record, Vol. 2356, 2013, pp. 117–126. 18
23. Albright, E., and M. Figliozzi. Analysis of the impacts of transit signal priority on bus 19
bunching and performance. Conference on Advanced Systems for Public Transportation, 20
CASPT 12, Santiago, Chile, July 2012. 21
24. Albright, E., and M. Figliozzi. Factors Influencing Effectiveness of Transit Signal Priority 22
and Late-Bus Recovery at Signalized-Intersection Level. Transportation Research Record, 23
No. 2311, 2012, pp. 186–197. 24
25. Diab, E. I., and A. M. El-Geneidy. Variation in bus transit service: understanding the 25
impacts of various improvement strategies on transit service reliability. Public Transport, 26
Vol. 4, No. 3, 2013, pp. 209–231. 27
26. Diab, E. I., and A. M. El-Geneidy. Understanding the impacts of a combination of service 28
improvement strategies on bus running time and passenger’s perception. Transportation 29
Research Part A: Policy and Practice, Vol. 46, No. 3, 2012, pp. 614–625. 30
27. Bertini, R., and A. El-Geneidy. Generating Transit Performance Measures with Archived 31
Data. Transportation Research Record, Vol. 1841, 2003, pp. 109–119. 32
28. Bertini, R. L., and A. M. El-Geneidy. Modeling transit trip time using archived bus dispatch 33
system data. Journal of Transportation Engineering, Vol. 130, No. 1, 2004, pp. 56–67. 34
29. Feng, W. Analyses of Bus Travel Time Reliability and Transit Signal Priority at the Stop-35
To-Stop Segment Level. Dissertation, Portland State University. June. 2014. 36
![arxiv: v1 [astro-ph.he] 10 Mar 2015](data:image/gif;base64,R0lGODlhAQABAIAAAP///wAAACH5BAEAAAAALAAAAAABAAEAAAICRAEAOw==)