www.nature.com/scientificreports
A decreasing glacier mass
balance gradient from the edge
of the Upper Tarim Basin to the
Karakoram during 2000–2014
Hui Lin
1,2,3, Gang
Li
1, Lan
Cuo
4,5,6, Andrew
Hooper
7& Qinghua Ye
4In contrast to the glacier mass losses observed at other locations around the world, some glaciers in the High Mountains of Asia appear to have gained mass in recent decades. However, changes in digital elevation models indicate that glaciers in Karakoram and Pamir have gained mass, while recent laser altimetry data indicate mass gain centred on West Kunlun. Here, we obtain results that are essentially consistent with those from altimetry, but with two-dimensional observations and higher resolution. We produced elevation models using radar interferometry applied to bistatic data gathered between 2011 and 2014 and compared them to a model produced from bistatic data collected in 2000. The glaciers in West Kunlun, Eastern Pamir and the northern part of Karakoram experienced a clear mass gain of 0.043 ± 0.078~0.363 ± 0.065 m w.e. yr−1. The Karakoram showed a near-stable mass balance
in its western part (−0.020 ± 0.064 m w.e. yr−1), while the Eastern Karakoram showed mass loss
(−0.101 ± 0.058 m w.e. yr−1). Significant positive glacier mass balances are noted along the edge of the
Upper Tarim Basin and indicate a decreasing gradient from northeast to southwest.
Glaciers and ice sheets throughout the world are experiencing degradation and have contributed approximately 29 ± 13% of the observed sea level increase from 2003 to 20091. The High Mountains of Asia (HMA) contain the
world’s largest low-latitude, high-altitude glaciers in the world and are dominated by continental climatic sys-tems, such as the westerlies, the Indian Monsoon and the East Asian Monsoon2, 3. Glaciers in the HMA are also
the headwater sources of several great rivers, and the HMA is therefore also known as ‘Asian Water Tower’4. In
contrast to other sub-regions of the HMA, including the Himalayas, Eastern Nyainqentanglha, Spiti Lahaul and Tien Shan, which are experiencing glacier mass loss, the Pamir-Karakoram-Kunlun region includes glaciers that have gained mass, although the details are debated1, 5–9. For the Karakoram and the Western Pamir, comparison
of digital elevation models (DEMs) from the Shuttle Radar Topographic Mission (SRTM) in 2000 with stereo photogrammetry-based DEMs derived from 2012 SPOT/HRS data suggested a positive mass balance. This was termed the ‘Karakoram anomaly’5 and later the ‘Karakoram-Pamir anomaly’6. However, a satellite laser altimetry
mission, ICESat/GLAS, indicated that a positive mass balance existed in Western Kunlun and Eastern Pamir, but stopped at the edge of the Karakoram, based on the use of a 1 × 1° grid7, 8. A similar result was obtained using the
same dataset without gridding1.
Since 2011, the German Aerospace Centre (DLR) has operated the twin X-band satellites, TerraSAR-X and TanDEM-X (TSX/TDX), in bistatic mode. This mode is similar to the working mode of the SRTM used in 2000, yielding better results regarding glacier height change measurements than ICESat/GLAS laser altimetry or SPOT/HRS photogrammetry10, 11. Following previous studies on the ‘Karakoram-Pamir anomaly’, we divide the
study site into six sub-regions, including West Kunlun, Extended West Kunlun (including zones A-G), Eastern
1Institute of Space and Earth Information Science, The Chinese University of Hong Kong, Hong Kong S.A.R., China. 2Geography and Resource Management, The Chinese University of Hong Kong, Hong Kong S.A.R., China. 3Shenzhen
Research Institute, The Chinese University of Hong Kong, Shenzhen, 518057, China. 4Institute of Tibetan Plateau
Research, Chinese Academy of Sciences, Beijing, 100101, China. 5CAS Center for Excellence in Tibetan Plateau Earth
Sciences, Beijing, 100101, China. 6Key Laboratory of Tibetan Environment Changes and Land Surface Processes,
Institute of Tibetan Plateau Research, Chinese Academy of Sciences, Beijing, 100101, China. 7COMET, School of
Earth and Environment, University of Leeds, Leeds, United Kingdom. Hui Lin and Gang Li contributed equally to this work. Correspondence and requests for materials should be addressed to G.L. (email: [email protected])
Received: 1 December 2016 Accepted: 22 June 2017 Published: xx xx xxxx
www.nature.com/scientificreports/
Karakoram, Western Karakoram, Hindu Kush, and Pamir5, 6. We analyse 39 pairs of bistatic SAR images obtained
during 2011 and 2014 to derive decadal glacier height changes using the SAR interferometry (InSAR) technique, subtracting SRTM elevations observed in 2000 (Supplementary Fig. S1). The study period used covers a slightly longer time period than previous researches6, 7. By presuming a density of 850 ± 60 kg/m3 in both the
accumula-tion and ablaaccumula-tion zones, we convert the decadal glacier height changes to glacier mass balances12.
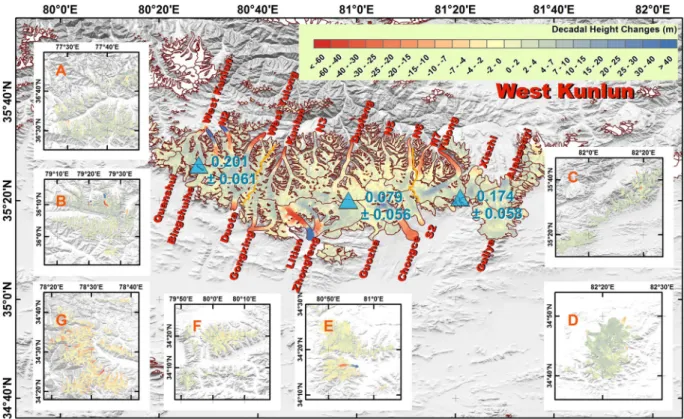
The glacier mass balance pattern is heterogeneous at the sub-regional scale (Fig. 1). Only West Kunlun, Extended West Kunlun and Eastern Pamir show glacier mass gain, whereas most of Karakoram, Hindu Kush and Western Pamir lost ice mass. West Kunlun showed a positive mass balance (0.128 ± 0.055 m w.e. yr−1), and
the surrounding area (A-F) also experienced a mass gain that varied from 0.043 ± 0.078 to 0.363 ± 0.065 m w.e. yr−1, with a decreasing gradient from northeast to southwest (Fig. 1, Supplementary Fig. S10). Along the edge
of the Upper Tarim Basin in Extended West Kunlun, a more positive mass balance was observed (Fig. 1, zones A, B, C, and D); in almost all elevation bins except those at lowest elevations, height changes were similar and positive (a~d in Supplementary Fig. S19). In the West Kunlun, of the 23 large glaciers that were examined, only three of them showed slight negative mass balances (Fig. 2, Supplementary Table S4). Surging and quiescent glaciers detected by the height change pattern largely agree with results derived from feature tracking13. Yulong
is the only glacier which is identified as a quiescent glacier in our height change pattern, not identified as such by previous feature tracking13. Surging and quiescent glaciers occupy almost half of West Kunlun’s glacierized area,
which implies surging is common. Glacier height changes also agree well with results derived from ICESat/GLAS within its footprints14, 15. Within the Extended West Kunlun (zone G), which is close to the Eastern Karakoram
and Spiti-Lahaul (Fig. 1 and Supplementary Fig. S11), the glacier experienced rapid degradation at a rate of
−0.286 ± 0.067 m w.e. yr−1. Nevertheless, glacier mass balances in all studied sub-regions or sub-groups were still
less negative than the HMA average8 of −0.37 ± 0.10 m w.e. yr−1.
A large number of glaciers in Karakoram surged or experienced quiescent phases after surging, mostly on the northern slope or within the Upper Tarim Basin16. Taking these glaciers into account by adding them to
the regional mass balance regarding area as weight6, the mass balances of glaciers in the Eastern and Western
Karakoram regions were −0.101 ± 0.058 and −0.020 ± 0.064 m w.e. yr−1, respectively. These results were closer
to the ICESat/GLAS-derived results7, 8 than the results derived from topographic differencing between SRTM
and stereo SPOT/HRS5, 6 data, even though our study period was similar to that used in the latter analysis. The
latter analysis yielded a positive mass balance in both the Eastern and the Western Karakoram of 0.11 ± 0.14 and 0.09 ± 0.18 m w.e. yr−1, respectively6. The central part of Karakoram was more stable than the fringing regions
to both the west and east (Supplementary Table S3). Most of the mass gain occurred on the northern slope of the Karakoram Mountains. For both the Eastern and Western Karakoram, the glacier mass balance was more negative in the Upper Indus Basin than in the Upper Tarim Basin (Figs 3 and 4; Supplementary Tables S5 and S6). Glacier mass balances were 0.000 ± 0.066 and −0.048 ± 0.060 m w.e. yr−1 in the western and eastern parts
inside the Upper Tarim region, respectively (Figs 3 and 4). At the far northeastern part of the Karakoram, which is covered by frame 2014–02–08n (Supplementary Fig. S1), close to the edge of the Upper Tarim, a significant positive mass balance was found at 0.114 ± 0.070 m w.e. yr−1, with similar rates of height increase in all elevation
bins (Supplementary Fig. S29). This also suggests that the anomaly centre was not within the central Karakoram,
Figure 1. Glacier mass balance in the Karakoram and its surroundings during 2000~2014. The areas of the
darker parts of triangles indicate glacier mass balance in terms of m w.e. (water equivalent) yr−1, whereas the
lighter parts indicate the estimated standard error. The coloured dashed lines indicate the boundaries of each sub-region covered by TSX/TDX images. We subdivided the Extended West Kunlun, which surrounds the West Kunlun, into zones A-G. The Pamir was separated into western, central and eastern parts, which are shown with purple dashed lines. All figures are generated by Gang Li. This figure was generated with ArcGIS 10.2 software (http://www.esri.com/software/arcgis/arcgis-for-desktop).
www.nature.com/scientificreports/
Figure 2. Decadal glacier height changes for the West Kunlun region and its extent during 2000~2014.
Locations of A-G are indicated in Fig. 1. Yellow lines separate this region into western, central and eastern parts. Their annual glacier mass balances are shown in units of m w.e. yr−1. Glacierized areas without observations
are shown in white. This figure was generated with ArcGIS 10.2 software (http://www.esri.com/software/arcgis/ arcgis-for-desktop).
Figure 3. As Fig. 2, but for Eastern Karakoram. The blue line naturally separates this region into the Upper Tarim Basin and the Upper Indus Basin. The boundary of the Eastern Karakoram region is indicated with a green dashed line. SA: Siachen; BA, Baltoro. This figure was generated with ArcGIS 10.2 software (http://www. esri.com/software/arcgis/arcgis-for-desktop).
www.nature.com/scientificreports/
but at the southeastern edge of the Upper Tarim7. Glacier mass balance in the Hindu Kush region has been under
debate; our results show a negative total mass balance of −0.134 ± 0.085 m w.e. yr−1.
The Pamir region is divided into western, central and eastern sub-regions. Our findings suggest negative mass balances in both the Western and the Central Pamir regions, and a positive mass balance in Eastern Pamir, with values of −0.118 ± 0.032, −0.100 ± 0.087, and 0.124 ± 0.086 m w.e. yr−1, respectively. Gardelle et al.6
sug-gested that there was a positive mass balance in Western Pamir of 0.14 ± 0.14 m w.e. yr−1, and that the Fedchenko
Glacier, which is the largest glacier in this sub-region (Fig. 5 and Supplementary Fig. S14), was nearly stable. However, Gardner et al.1 and Kääb et al.7 identified negative sub-regional mass balances of −0.13 ± 0.11 and −0.48 ± 0.14 m w.e. yr−1 via satellite laser altimetry. Their major discrepancy lies with glaciers west to Fedchenko.
Gardner et al.’s results1 present positive changes for a lot number of footprints, while Kääb et al.’s results7 are
negative there. Our results suggest Fedchenko Glacier experienced a negative mass balance of −0.147 ± 0.069 m w.e. yr−1, as well as significant thinning in the ablation zone (Supplementary Fig. S37). Surging and quiescent
glaciers are also common in Western Pamir, especially west of the Fedchenko Glacier (Fig. 5). This region, where Gardner et al.1 and Kääb et al.7’s discrepancy lies, presents an almost stable mass balance of −0.027 ± 0.064 m
w.e. yr−1. Previous research using optical satellite identification17 shows stable or advancing glaciers in Eastern
Pamir. In-situ observations within our study period in Eastern Pamir show positive average height changes for the Muztag Ata Glacier3. Despite the positive mass balance in both the accumulation and ablation zones, glacier
thinning was significant in the very lowest region of the Kekesayi Glacier (Fig. 6 and Supplementary Fig. S41), which is the largest glacier in the Eastern Pamir. This result is similar to the finding of Holzer et al., who used photogrammetry18.
Our derived results suggest that the anomalous region is centred on the southern and western edges of the Upper Tarim basin, rather than the Karakoram region. This heterogeneous pattern of glacier mass balance is more similar to the previous 1° × 1° gridded results7 derived from ICESat/GLAS satellite laser altimetry than to
the results of topographic differencing, despite the small differences in study periods and coverage investigated. This implies that the anomaly indicates strengthening of the westerlies3 and increased moisture in the Tarim
region19. The increase in lake elevation south of the West Kunlun region during almost the same study period also
suggests that increasing precipitation could be responsible for the observed glacier mass gain20, 21. Large glaciers
in the Eastern Pamir and the West Kunlun regions, such as the Kekesayi and the Duofeng Glaciers (Figs 2 and 6), suffered from obvious thinning of up to metres or tens of metres in one decade in their lowest sections. Their rates of height changes in the accumulation zones were identical, indicating that they were not surging glaciers experiencing a quiescent phase. Feature tracking to the Duofeng glacier also confirms this by deriving flow rates13.
For the West Kunlun region, after removing glaciers that were surging or experiencing a quiescent phase after surging, depending on their flow rates13 and height change patterns, the glacier height changes show
homogene-ously increasing rates in every elevation bin above 5450 m, whereas areas below 5400 m reflect thinning (Fig. 7). GCMs simulations do not show a strong mass balance anomaly along the edge of the Upper Tarim region; instead, they suggest that the major anomaly region occurs along 36.5 N° in Western Karakoram22. In contrast,
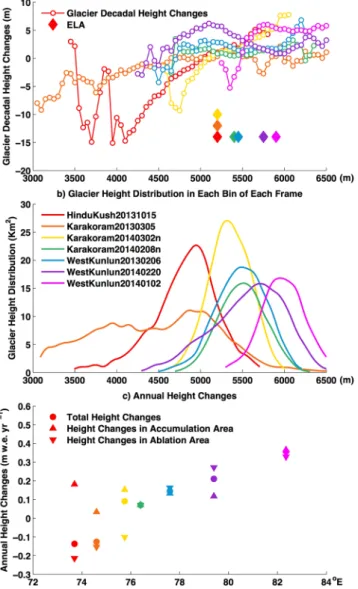
seven TSX/TDX images in our study region, covering the Hindu Kush region to the eastern extent of West
Figure 4. As Fig. 3, but for the Western Karakoram. BI, Biafo; CH, Chogo Lungma; HI, Hispar; BT, Batura. This figure was generated with ArcGIS 10.2 software (http://www.esri.com/software/arcgis/arcgis-for-desktop).
www.nature.com/scientificreports/
Figure 5. As Fig. 2, but for the Western Pamir region. The Fedchenko Glacier is indicated by the bold boundary. The yellow line separates the rest of the glaciers into two sub-regions. The purple dashed line represents the TSX/TDX coverage. This figure was generated with ArcGIS 10.2 software (http://www.esri.com/software/arcgis/ arcgis-for-desktop).
Figure 6. As Fig. 2, but for the Eastern Pamir region. The purple dashed line represents the TSX/TDX coverage. KK, Kekesayi glacier; MA, Muztag Ata glacier. This figure was generated with ArcGIS 10.2 software (http:// www.esri.com/software/arcgis/arcgis-for-desktop).
www.nature.com/scientificreports/
Kunlun, show that the mass balance increases from west to the east (Fig. 8, Supplementary Figs S1, S19a–c, S23, S27, S28, S29). This is similar to the finding using ICESat/GLAS observations along 36 N°7. The northernmost
part of Western Karakoram (coverage 2014-03-02n and 2014-02-08n; Supplementary Fig. S1) still presents a pos-itive glacier mass balance. The drainage divide between the Indus Basin and the Tarim Basin seems to represent the limit of this mass balance anomaly. A high proportion of annual streamflow comes from glacier and snow melt in the Upper Indus River, the Upper Tarim River and the Upper Amu Darya River, as the dry desert in the lowland does not produce significant runoff 23–25. Climate change-induced snow and glacier changes could
there-fore be detrimental and may lead to potential conflict in the long run, due to shifts in the seasonal distribution of flow and annual yield changes26–28, as the population is projected to grow in central Asia25, 29. Some recent studies
have already reported that enhanced glacier and snow melt has contributed to an increase in streamflow in the Upper Indus River in recent decades30–33.
Methods
Bistatic SAR Interferometry.
We utilized 39 pairs of X-band SAR images (Supplementary Fig. S1) and used SRTM data from Feb 2000 to detect glacier height changes using bistatic SAR interferometry (InSAR). In the case of bistatic InSAR, because the two images in a single pair are obtained at the same point in time, only the topographic residual phase exists in the differential interferogram. After unwrapping using a minimum cost flow method34, we transformed the topographic residual phase directly into height changes10. To tie the DEMs tothe same reference frame, we assumed no height changes occurred in the off-glacier region in the whole image. Additionally, the off-glacier region was also employed to estimate and remove a bilinear ramp due to orbital errors. The RGI V5.0 dataset was used to provide the boundaries of the glaciers; manual corrections according to Landsat images were performed for several surging and stagnant flow glaciers’ terminus when calculating vol-ume changes and mass balance35. The normalized differential snow index (NDSI) of cloud-free end-of-summer
Landsat images was applied to identify clean ice glaciers using a threshold of 0.4. Foreshortening, layover, and shadowed regions in the SAR data were de-correlated, and the voids in the SRTM were masked out. Due to the complex topography, a lower proportion of pixels in the higher elevation section can be measured effectively. Therefore, for each elevation bin of 50 m, we calculated the mean height change and calculated the normalized averaged rates of glacier height change for the region of interest.
Penetration depth and seasonal effect estimation.
Microwaves can penetrate snow, firn and ice to a depth that depends on the density, water content and microwave frequency used36. Because X-band SRTMis not available everywhere, due to its narrow swath widths, we used C-band SRTM for height change estima-tion. For each sub-region, we applied C- and X-band SRTM to estimate and remove the penetration depth difference on glaciers individually in each 50-m elevation bin (Supplementary Figs S2–S4). The datum dif-ference between C- and X-band SRTM was estimated and removed by aligning the off-glacier region37. The
clean ice and the debris-covered ice were treated separately (Supplementary Figs S3 and S4). The estimated
Figure 7. Glacier height changes in different elevation layers in the Western Kunlun. (a) Changes in glacier
height for non-surging glaciers in each elevation bin. Error bars only indicate standard deviation in height changes in each elevation bin. (b) Glacier height distributions for both total glacierized area and the measured area of non-surging glaciers.
www.nature.com/scientificreports/
average penetration depth differences in the West Kunlun, Karakoram and Pamir regions are 2.84 ± 0.13 m, 2.41 ± 0.17 m, and 1.88 ± 0.29 m, respectively. To avoid the effects of seasonal snow on the penetration depth estimates, we mainly adopted TSX/TDX images obtained in Jan, Feb and Mar. Four pairs of images obtained during different months, with a region of overlap in West Kunlun, were employed to estimate the seasonal effect (Supplementary Figs S5 and S6). We adopted a height change correction of −0.28 m, −0.21 m, −0.14 m,
−0.07 m, 0.07 m and 0.14 m for October, November, December, January, March and April, respectively (Supplementary Fig. S1 and Table S1).
Error estimation.
The glacier height change estimates include bias and random error. The former includes differences in the penetration depths associated with the C- and X-bands, the off-glacier region datum and sea-sonal variations. We performed an error propagation similar to that used in the study of Gardelle et al.6;autocor-relation distances of 2000 m and 500 m were chosen for the differencing operations between the two SRTM bands and the SRTM and TSX/TDX DEMs, respectively. An error of 0.15 m/month was introduced for the seasonal snow effect estimation. The random error depends on the number of effective measurements at each glacier and on the standard deviation of the elevation differences within the off-glacier region, where no height changes were presumed.
Figure 8. Glacier height changes in different elevation layers along 36.5 N°. (a) Glacier height changes in
each elevation bin for seven pairs of bistatic images along 36.5 N° (shown in different colours) from the Hindu Kush to the eastern extent of the West Kunlun. The specific position of the coverage refers to Figure S1 in the supplementary. (b) Glacier height distribution for seven pairs of image coverages. Different colours indicate different frames. (c) Annual glacier height changes for the total region, accumulation area and ablation area in seven pairs of bistatic images along 36.5 N°. The horizontal axis indicates the longitude at the centre of each image.
www.nature.com/scientificreports/
References
1. Gardner, A. et al. A reconciled estimate of glacier contributions to sea level rise: 2003 to 2009. Science. 340, 852–857 (2013). 2. Bolch, T. et al. The state and fate of Himalayan glaciers. Science. 336, 310–314 (2012).
3. Yao, T. et al. Different glacier status with atmospheric circulations in Tibetan Plateau and surroundings. Nature Climate Change. 2, 663–667 (2012).
4. Immerzeel, W. W., Beek, L. P. H. & Bierkens, M. F. P. Climate change will affect the Asian water towers. Science. 328, 1382–1385 (2010).
5. Gardelle, J., Berthier, E. & Arnaud, Y. Slight mass gain of Karakoram glaciers in the early twenty-first century. Nature geoscience. 5, 322–325 (2012).
6. Gardelle, J., Berthier, E. & Arnaud, Y. & Kääb, A. Region-wide glacier mass balances over the Pamir-Karakoram-Himalaya during 1999–2011. The Cryosphere. 7, 1263–1286 (2013).
7. Kääb, A., Treichler, D., Nuth, C. & Berthier, E. Brief Communication: Contending estimates of 2003–2008 glacier mass balance over the Pamir–Karakoram–Himalaya. The Cryosphere. 9, 557–564 (2015).
8. Kääb, A., Berthier, E., Nuth, C., Gardelle, J. & Arnaud, Y. Contrasting patterns of early twenty-first-century glacier mass change in the Himalayas. Nature. 488, 495–498 (2012).
9. Farinotti, D. et al. Substantial glacier mass loss in the Tien Shan over the past 50 years. Nature Geoscience. 8, 716–722 (2015). 10. Neckel, N., Braun, A., Kropáček, J. & Hochschild, V. Recent mass balance of the Purogangri Ice Cap, central Tibetan Plateau, by
means of differential X-band SAR interferometry. The Cryosphere 7, 1623–1633 (2013).
11. Jaber, W. A., Floricioiu, D., Rott, H. & Eineder, M. Dynamics of fast glaciers in the Patagonia Icefields derived from TerraSAR-X and TanDEM-X data. Geoscience and Remote Sensing Symposium (IGARSS), 3226–3229 (2012).
12. Huss, M. Density assumptions for converting geodetic glacier volume change to mass change. The Cryosphere. 7, 877–887 (2013). 13. Yasuda, T. & Furuya, M. Short-term glacier velocity changes at west kunlun shan, northwest tibet, detected by synthetic aperture
radar data. Remote Sensing of Environment. 128, 87–106 (2013).
14. Ke, L., Ding, X. & Song, C. Heterogeneous changes of glaciers over the western Kunlun Mountains based on ICESat and Landsat-8 derived glacier inventory. Remote Sensing of Environment. 168, 13–23 (2015).
15. Bao, W., Liu, S., Wei, J. & Guo, W. Glacier changes during the past 40 years in the West Kunlun Shan. Journal of Mountain Science.
12, 344–357 (2015).
16. Rankl, M., Kienholz, C. & Braun, M. Glacier changes in the Karakoram region mapped by multimission satellite imagery. The Cryosphere 8, 977–989 (2014).
17. Zhang, Z. et al. Glacier changes since the early 1960s, eastern Pamir, China. Journal of Mountain Science. 13, 276–291 (2016). 18. Holzer, N. et al. Four decades of glacier variations at Muztagh Ata (eastern Pamir): a multi-sensor study including Hexagon KH-9
and Pléiades data. The Cryosphere. 9, 2071–2088 (2015).
19. Liu, S. et al. Glacier retreat as a result of climate warming and increased precipitation in the Tarim river basin, northwest China.
Annals of Glaciology. 43, 91–96 (2006).
20. Zhang, G., Xie, H., Kang, S., Yi, D. & Ackley, S. F. Monitoring lake level changes on the Tibetan Plateau using ICESat altimetry data (2003–2009). Remote Sensing of Environment. 115, 1733–1742 (2011).
21. Srivastava, P., Bhambri, R., Kawishwar, P. & Dobhal, D. P. Water level changes of high altitude lakes in Himalaya–Karakoram from ICESat altimetry. Journal of Earth System Science. 122, 1533–1543 (2013).
22. Janes, T. J. & Bush, A. B. G. The role of atmospheric dynamics and climate change on the possible fate of glaciers in the Karakoram.
Journal of Climate. 25, 8308–8327 (2012).
23. Xu, C., Chen, Y., Chen, Y., Zhao, R. & Ding, H. Response of surface runoff to climate change and human activities in the arid region of central Asia: a case study in the Tarim River Basin, China. Environmental Management. 51, 926–938 (2013).
24. Cuo, L., Zhang, Y., Zhu, Y. & Liang, L. Characteristics and changes of streamflow on the Tibetan Plateau: a review. Journal of Hydrology: Regional Studies. 2, 49–68 (2014).
25. Karthe, D., Chalov, S. & Borchardt, D. Water resources and their management in central Asia in the early twenty first century: status, challenges and future prospects. Environmental Earth Sciences. 73, 487–499 (2015).
26. Liu, T. et al. Climate change impact on water resource extremes in a headwater region of the Tarim basin in China. Hydrology and Earth System Sciences. 15, 3511–3527 (2011).
27. White, C., Tanton, T. & Rycrof, D. The impact of climate change on the water resources of the Amu Darya Basin in Central Asia.
Water Resources Management. 28, 5267–5281 (2014).
28. Ali, S., Li, D., Fu, C. & Khan, F. Twenty first century climatic and hydrological changes over Upper Indus Basin of Himalaya region of Pakistan. Environmental Research Letters 10, 014007 (2015).
29. Laghari, A., Vanham, D. & Rauch, R. The Indus basin in the framework of current and future water resources management.
Hydrology and Earth System Sciences 16, 1063–1083 (2012).
30. Ahmad, Z., Hafeez, M. & Ahmad, I. Hydrology of mountainous areas in the upper Indus Basin, northern Pakistan with the perspective of climate change. Environment al Monitoring and Assessment. 14, 5255–5274 (2012).
31. Mukhopadhyay, B. & Khan, A. Rising river flows and glacial mass balance in central Karakoram. Journal of Hydrology. 513, 192–203 (2014).
32. Mukhopadhyay, B. & Khan, A. A reevaluation of the snowmelt and glacier melt in river flows within Upper Indus Basin and its significance in a changing climate. Journal of Hydrology. 527, 119–132 (2015).
33. Farhan, S., Zhang, Y., Ma, Y., Guo, Y. & Ma, N. Hydrological regimes under the conjunction of westerly and monsoon climates: a case investigation in the Astore Basin, Northwestern Himalaya. Climate Dynamics. 44, 3015–3032 (2015).
34. Costantini, M. A novel phase unwrapping method based on network programming. IEEE Transactions on geoscience and remote sensing. 36, 813–821 (1998).
35. Arendt, A. et al. Randolph Glacier Inventory – A Dataset of Global Glacier Outlines: Version 5.0. Global Land Ice Measurements from Space, Boulder Colorado, USA. (Digital Media, 2015).
36. Rignot, E., Echelmeyer, K. & Krabill, W. Penetration depth of interferometric synthetic-aperture radar signals in snow and ice.
Geophysical Research Letters. 28, 3501–3504 (2001).
37. Hoffmann, J. & Walter, D. How complementary are SRTM-X and-C band digital elevation models? Photogrammetric Engineering & Remote Sensing. 72, 261–268 (2006).
Acknowledgements
This study was jointly supported by the National Basic Research Program of China (2015CB954103), the Research Grants Council (RGC) General Research Fund of HKSAR, China (CUHK 14233016). We thank the United States Geological Survey (USGS) for providing Landsat optical images and C-band SRTM DEM products freely. Bistatic TerraSAR-X/TanDEM-X SAR images in CoSSC format were provided by German Aerospace Center (DLR) under project XTI_GLAC6924. X-band SRTM was freely provided by DLR as well. COMET is the NERC Centre for the Observation and Modelling of Earthquakes, Volcanoes, and Tectonics. Ms. Siting Xiong gave us advices on comparing C- and X-band SRTM. Dr. Adam Delvin refined the manuscript and supplementary information.
www.nature.com/scientificreports/
We also thank three anonymous reviewers for their suggestions. ERSI provided ArcGIS 10.2 for plotting Figs 1–6, S1–S5 and S9–S17 (https://www.arcgis.com/features/index.html).
Author Contributions
Hui Lin designed the study and refined the manuscript. Gang Li performed most of the data processing and wrote most of the manuscript. Lan Cuo wrote the hydrological part of the manuscript. Andrew Hooper supervised the InSAR data processing and refined the manuscript. Qinghua Ye is the PI of project XTI_GLAC6924 and supervised the analysis of the glacier mass balances.
Additional Information
Supplementary information accompanies this paper at doi:10.1038/s41598-017-07133-8
Competing Interests: The authors declare that they have no competing interests.
Publisher's note: Springer Nature remains neutral with regard to jurisdictional claims in published maps and
institutional affiliations.
Open Access This article is licensed under a Creative Commons Attribution 4.0 International
License, which permits use, sharing, adaptation, distribution and reproduction in any medium or format, as long as you give appropriate credit to the original author(s) and the source, provide a link to the Cre-ative Commons license, and indicate if changes were made. The images or other third party material in this article are included in the article’s Creative Commons license, unless indicated otherwise in a credit line to the material. If material is not included in the article’s Creative Commons license and your intended use is not per-mitted by statutory regulation or exceeds the perper-mitted use, you will need to obtain permission directly from the copyright holder. To view a copy of this license, visit http://creativecommons.org/licenses/by/4.0/.