select the projects that will compose the portfolio of the organizations and how to follow their evolution in time so that they can provide greater return to the organizations.
This study was motivated since only a limited number of studies had been reported focusing on project portfolio in Brazilian companies. The main purpose of this paper is to analyze the current project portfolio management from a project portfolio management literature perspective, viewing to identify gaps between practice and theory, and also the main issues in portfolio management implementation.
This paper is divided into five sections. The next sections present a synthesis of the theoretical discussion of the themes approached in this paper; the methodological approach proposed for the field research that took place in a Brazilian Chemical Company. Finally, the paper presents conclusions, limitations and recommendations for future studies.
2. Theoretical background
Nowadays, the relevance of alignment between business strategy and its projects portfolio has been increasingly studied. Thus, portfolio management has assumed an important role in the strategic function as suggested by several authors (CARVALHO; LAURINDO, 2003; ROUSSEL et al., 1991; COOPER et al., 1999, 2001).
Furthermore, CARVALHO et al. (2003) argue that the outputs of portfolio management process should be able
1. Introduction
With the globalization which occurred in the last decades, competition has been strongly intensified in the world-wide scenario and especially in Brazil. To survive, organizations have started to study alternatives to reduce costs and to increase competitiveness. In this context, in which the speed of changes is increasing, and customers’ demand towards the performance of products and quality of services rendered are growing, there are evidences that companies are spending more time on projects and less on routine activities.
However, are organizations prepared to manage their portfolio accurately? Probably not. Many publications approach problems in scope management, deadline fulfillment and individual project budgets; other publications mention the uncertainty degree involved as a difficulty factor to manage projects. Elton and Roe (1998) argue that, according to their experience in managing projects portfolio, this is much more complicated than managing individual projects and that, in many cases, delays in individual projects arise from problems at the top management level, besides errors in managing a project. According to the same authors, the problem lies on the lack of leadership and profile of the project managers.
To deal with the individual problem of projects portfolio management and individual projects, a vast literature proposes logical techniques and classifications for project management in order to facilitate a decision on how to
Current project portfolio management practices: A case study*
Marisa Padovani, Marly Monteiro de Carvalho, Antonio Rafael Namur Muscat
University of São Pauloe-mails: [email protected]; [email protected]; [email protected]
Abstract: The current portfolio literature describes diverse approaches concerning the techniques of classification, selection, prioritization, and project management. The main objective of this article is to investigate the practical issues of portfolio management in Brazilian companies as well as to identify gaps and opportunities of improvement. The field research carried out in a Brazilian Chemical Company, which was studied for more than 2 years, through the case study approach based on the in-depth analysis. Furthermore, project portfolio management data were gathered during a 5-year period, in order to allow an evaluation of the outcome resulted from the portfolio decisions. It was possible to verify the practical application of the techniques proposed in the literature for classification, selection of the projects, and portfolio management. It was also possible to identify some critical variables for the implementation of some projects of the company such as the main purpose of this study, signaling critical factors of success for implementations of projects in Brazil.
Keywords: portfolio management, decision support making, portfolio selection.
it is negatively affected by the quality of the data (COOPER et al., 2001).
It is thus possible to conclude that there is a possibility of mutual and complementary synergy among these methods and that the company should be able to choose the best set of available methods in order to address its singular needs in portfolio management.
McFarlan (1981) corroborates with this point of view and states that different projects require different managerial approaches. However, this author warns that companies exhaustingly study financial and qualitative benefits of projects, costs of implementation, deadlines and necessary competences, but they rarely register the risks of the projects. These risks are described as: delay in the implementation schedule, budget over costs, technical failures, dealing with failures after implementation for ignoring the existence of this possibility.
Therefore, it is necessary to classify the projects so that it will be possible to differentiate and compare them with similar projects. According to the author, a project can be classified in three dimensions, in accordance with aggregate risk of the portfolio of projects: project size, experience with the technology and project structure.
On the other hand, Lager (2002) suggests a model to classify process projects using a scale. It proposes 3 degrees of newness of a process technology: low, when the process technology is well known and proved; medium, when the process technology is an improvement of a previously known technology and high, when the process technology is completely new. Lager (2002) also suggests 3 degrees of newness of a process technology to the company production system. According to this author, these degrees of newness are: low, when the new process technology can be used in existing process plants; medium, when the new process technology requires plant modifications or additional equipment; and high, when the new process technology requires new process, plant or production unit.
Jolly (2003) presents a list of 32 criteria, identified in the literature, grouped by families used to investigate the underlying components of technological attractiveness and technological competitiveness of the portfolio project. The most important criteria of the research that impact technological competitiveness issues, found by Jolly (2003) are: market volume opened by technology, span of applications for open technology, performance gap vis-à-vis alternative technology, competitive intensity.
The academic literature also highlighted the importance of achieving balance in portfolios in many ways, such as balancing between incremental and revolutionary projects; balance between product innovation and process innovation; balancing between risk and reward; and balancing between long term and short term (ADNER; LEVINTHAL, 2001; ROUSSEL et al., 1991; COOPER et al., 1997, 1998, 1999, to meet the requirements of the company strategy and also
achieve its goals, in order to obtain a competitive advantage. In a few words, effectiveness can be understood as the ability of “doing the right thing” (DRUCKER, 1963) and in the context of this paper it means choosing the right projects.
However, the successful implementation of portfolio management (PM) is not a trivial task, which encompasses market and technology uncertainty, the bargain for scarce resources (people, finances, time) among company areas and the constant changes in a turbulent market (BROWN; EISENHARDT, 1998; EISENHARDT; BROWN, 2000). Besides, it is important to emphasize the difficulties in addressing the dynamic nature of PM, so it must be a continuous process with the engagement of the main actors in the decision-making process (stakeholders) and well defined process flows and check gates.
In this paper, portfolio management is defined as proposed by Cooper et al. (1999) “a dynamic decision process, whereby a business list of active new product (and R&D) projects is constantly updated and revised. In this process, new projects are evaluated, selected, and prioritized; existing projects may be accelerated, aborted, or deprioritized; and resources are allocated and reallocated to the active projects. The portfolio decision process is characterized by uncertain and changing information, dynamic opportunities, multiple goals and strategic considerations, interdependence among projects, and multiple decision-makers and locations.”
For these authors, portfolio management is the manifestation of the strategy of the business, which dictates where and how the investment will have to be made in the future. The authors also inform that, to maximize the value of the portfolio means to get return of the investments in Research and Development (R&D), balancing the projects portfolio and lining up the strategy of investments with the business-oriented strategy of the company.
Archer and Gasemzadeh (1999) analyzed several portfolio methods and concluded that appropriate methods encompass periodic activity selection, from available project proposals and projects currently under way, which meets the organization’s stated objectives in a desirable manner without exceeding available resources or violating other constraints and meets the organization’s minimum requirements according to several criteria such as potential profitability, potential acceptability, size of investment and others.
Cooper et al. (1999) studied portfolio management and its implementation in companies and found that the most widely spread methods are ranked as following: financial methods, 77.3%; business strategy methods, 64.8%; bubble diagrams, 40.6%; scoring models, 37.9%; checklists, 20.9%. As these data suggest, companies use multiple methods; however, the authors highlight that financial methods are dominant, with 40.4%. Nevertheless, it is not the best one, as
abroad. This organization supplies several markets with a wide range of industrial raw material and services.
Its total revenues surpass 500 million dollars/year. The company invests over 2% of its annual income in research and development of products and processes. This company operates in more than forty countries, throughout the five continents.
The total number of employees in Brazil is approximately 900, 12% of it committed to Research and Development (R&D) as well as engineering (Projects).
In order to make the project portfolio of the Company studied, the executives worked out the Company’s Strategy, which shows the market trends, range of products, processes and projects forecasting the next three-year scenario. This plan of action which is built in the third quarter of the year usually precedes the budget plan which estimates the next year investments, expenses and production. Once these phases are finalized, each area works out its next year plan of action investments and expenses based on the Company’s Strategy and all that is submitted to the analysis and the approval of the Board of Directors.
To compose the Organization’s Portfolio, the different areas can participate as shown in Figure 2. The sales force contributes to the identification of the client’s desires and needs. The major clients invited to visit the organization also deliver presentations on their new businesses, their market perspectives and their sales forecast related to the range of products supplied by the company studied. The marketing area contributes with bi-annual market researches. Finally, the new business area participates with new patents and technology studies as well as new acquisitions.
The projects composing the portfolio of the company are classified by different dimensions according to their 2001; TRITLE et al., 2000), WHEELWRIGHT; CLARK,
1992; ARCHER; GASEMZADEH, 1999).
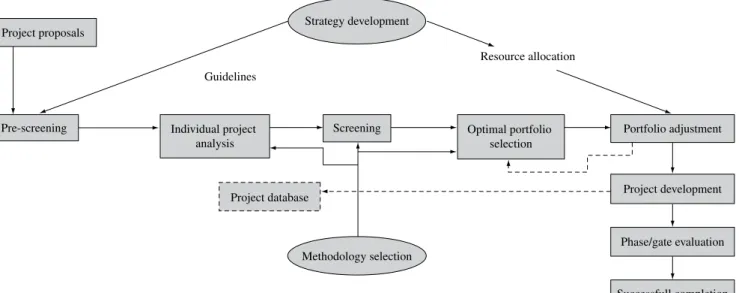
Finally, Archer and Gasemzadeh (1999) observe that the activity of portfolio management is very important in the organizations activities. However, there are many techniques, some of which divergent and others not applicable due to their complexity. To contribute through the simplification of the portfolio management process, the authors consider an integrated model presented in Figure 1.
3. Field research design
The main purpose of this paper is to identify critical issues in portfolio management implementation in Brazilian companies. The methodological approach selected was case study as suggested by Yin (1994). The field research was developed in a large-size Brazilian Chemical Company.
The case study analysis was carried out in 2005 taking into consideration two key company sources data collection, whose documents and information about the portfolio with 1000 projects took into consideration the period 2001 to 2005. Furthermore, interviews were performed, through the application of a questionnaire to the key management involved with portfolio management.
The data collected was used to draw several charts in order to characterize the company’s portfolio.
4. Case study analysis
The Brazilian company analyzed in this study is one with intensive capital, operating in the chemical and petrochemical segments, with headquarters in Sao Paulo. It is one of the largest chemical and petrochemical companies in the country, acting both in the national and international market, making use of four industrial units in Brazil and two
Pre-screening Individual project analysis Screening Guidelines Optimal portfolio selection Project database Strategy development Resource allocation Methodology selection Portfolio adjustment Project development Phase/gate evaluation Successfull completion Project proposals
are appraised according to a group of criteria such as risks involved, market share, competition, technology, analysis of the product application in relation to the Core Business, value of the investment and other financial criteria such as return on investments (ROI) and EVA. Such projects, if approved, are individually monitored. They are assessed as to deadline, financial fulfillment and scope.
In case of the operational projects, the Directors, after the budget period, receive all the financial information about all the prospective investments for each site, classified by their characteristic and type, with individual description of each investment, objective, physical and financial chronogram, ROI (return on investments) and EVA (economic value added). Based on this kind of information, the Directors nature, type and characteristic. The first dimension, related
to nature, can be operational or strategic. The second referring to type, can be classified into real properties and services acquisitions (type A), replacement of existing machinery or repair of the existing system (type B), and the implementation of the equipment, installations, systems, units and plants, according to specific engineering projects, construction and industrial erection (type C). The last one, related to characteristics, is about the main investment targets in Table 1.
The approaches applied in the approval of the projects of strategic nature differ from the approaches applied in the approval of operational projects. The former projects are approved by the shareholders whereas the latter are approved by the board of directors. The strategic projects
Research about existent
patents/technologies Acquisitions studies Market research
Meetings with major clients Sales force Strategic plan Maintenance/ adequacies of installations New processes/ modifications on the installations New products/applications New technologies/plants
Industrial assurance Information system Environmental technology
Project portfolio company
Figure 2. Origin of the project portfolio company.
Table 1. Projects classification according to characteristic.
Characteristics of the investments Description
CP – growing capacity Projects for growing production capacity existent products. NP – new products Investments aiming new products introduction.
RC – costs reduction Investments in production costs reduction by altering the cycles of production, by utilizing less expensive items, etc.
AD – administrative Investments in assets non-related to information technology, manufacturing or logistic. CA – environment Investments whose introduction are in accordance with environmental protection, requisites.
IF – information technology Investments in software, hardware and others assets about information technology.
SG – industrial safety Investments aiming operational safety guarantee and protection of installations and personnel. QS – quality Investments in productive quality improvement.
VU – end of useful life Investments aiming replacement by obsolescence.
EE – feasibility preliminary studies Investments in carrying out studies on new business feasibility. MD – modernization of facilities Investments aiming up to date technology and installations.
4.1. Data analysis: portfolio’s characterization
The Projects analysis according to their nature, value of investment, risk technology, classified by the plant and the total enterprise referred to the last 5 years.
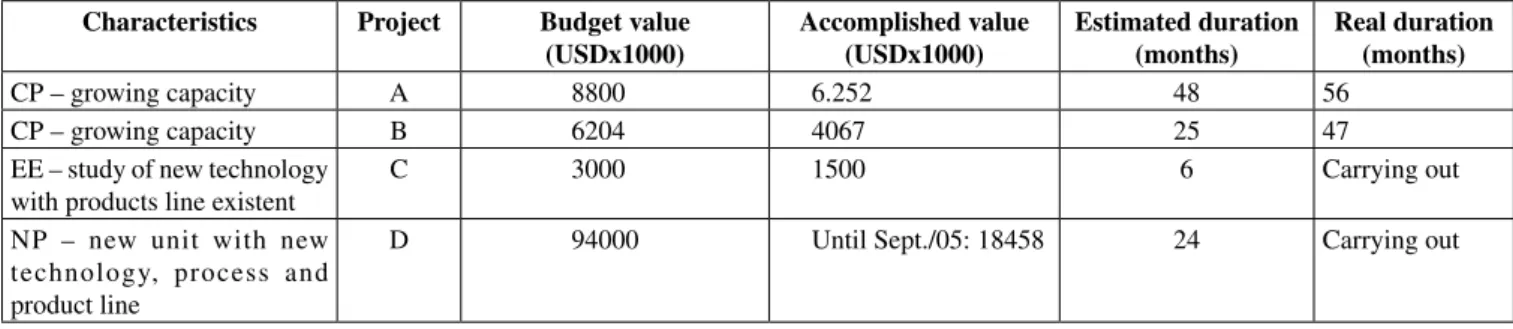
Analyzing the Portfolio of the company studied in terms of number of projects of strategic nature, per characteristic year, one observes a total of 7 projects, two being relative to the closing of capital in the stock market and acquisition of shares, two of expansion of existing units, one about studies for a new unit with technology and existing line of products, a project for a new unit with new technology and line of products, and another one for acquiring a new plant. The projects concerning stock markets are exclusive of the Board and they will not be analyzed in the present document. Thus, the four remaining projects will be analyzed, comparing budgeted values with accomplished value, and estimated duration with accomplished duration. It is generally observed that the number of strategic projects is small, 12 per year, being their maximum duration of one year.
As can be noticed in Table 2, even though the strategic investments have been strictly monitored, the chronogram has not been met in the case of concluded projects. About the values spent, they were inferior to the budget. In an interview with the coordinators of these projects, the authors were informed that, in both cases, there was target alteration when the project was already in the industrial assembly phase, and there was an increase in the equipment amount to be bought and installed.
Table 3 presents the description of the number of operational projects of the company studied per year and per characteristic. As verified, the portfolio of projects of the company per year was around 200, reduced to 140, in 2005. It is also is possible to evidence through the analysis of Table 3 that the number of projects is proportional to the size of the plants.
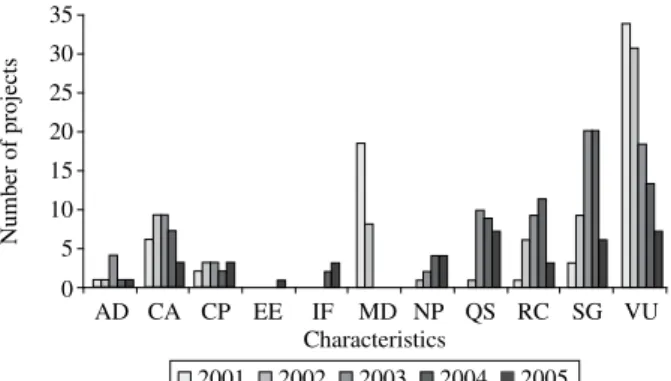
Observing Figure 3, it can be verified that there is a larger number of projects with end of service life (VU) characteristic, followed by projects of industrial safety and quality.
Figure 4 shows the profile of the headquarters projects. As can be observed, in this site the number of investments make their decision according to the value limit allowed
for the investment.
The proposed individual project analysis by site and characteristic defines which projects will be cut off in order to achieve the target. Once informed about the approved projects and the ones that have been cut, the managers have time enough to re-negotiate or to replace them, when justified. After the official final approval and communications, the projects are to be initiated in the next financial year.
The strategic and high-cost ongoing projects are closely monitored either by the area manager and the director of the area through monthly reports which will follow the investments, having the physical and financial moves analyzed by the “S Curve”. The minor projects are consolidated in big blocks, in which only the total expenses already paid are verified and, if they exceed 10% of the budget, the continuation of the project and its feasibility will depend on the Board’s decision-making. However, this policy is rarely complied with.
During the financial year, they are approved according to the needs of different areas investments to carry out extra-budget projects. Such projects are included in the portfolio of the enterprise without any analysis of re-priorization, increasing the number of projects of the portfolio, counting on the same human resources, though. Therefore, there will be impact on the priorities and the chronograms previously defined.
There is no clear policy for the prioritization of the projects in the organization nor is restriction of resources considered. In theory, the major projects are strategic, followed by the operational investments of greater return and, after that, the ones which involve industrial safety or product quality. In practice, all the approved projects are demanded by the respective area.
Only at the end of the year are accounts rendered to the Board of directors during the plan of action presentations and that is the only opportunity to strike a balance on the projects that have been carried out and the ones which have been put aside, too late to take corrective measures, though, as this coincides with the period of strategic planning for the coming year.
Table 2. Historic value of investment budgeted and accomplished in duration value.
Characteristics Project Budget value
(USDx1000) Accomplished value (USDx1000) Estimated duration(months) Real duration (months)
CP – growing capacity A 8800 6.252 48 56
CP – growing capacity B 6204 4067 25 47
EE – study of new technology with products line existent
C 3000 1500 6 Carrying out
NP – new unit with new technology, process and product line
Figure 6 presents the profile of investments of the second largest plant of the company in study. A very similar behavior to that of plant 1 is observed.
As can be seen in Figure 7, most of the projects in plant 3 are related to service life and safety, in equal ratio, followed by projects related to quality and modernization.
The profile of investments of the smaller unit, plant 4, can be analyzed through Figure 8. In this case, the end of service life, safety and increase in capacity are more frequent.
Figure 9, as follows, presents another vision of the profile of projects of the studied organization. As can be seen, the total expenditure with investments of capacity increase, studies on new units and technologies was greater than the investments characterized by end of service life in 2003, 2004 and 2005. Investments in safety, quality, new products and information technology are situated in the same band of values. This graph also shows that the budget values are normally higher than the ones used, which characterizes low execution capacity of the projects considered.
Figure 10 presents the budget values and accomplished values in the headquarters projects. In this case, the projects are basically of information technology and studies, as observed in Figure 4, about the numbers of projects. concentrate in the area of Information Technology (TI) and
studies on new processes and technologies (EE). This occurs due the fact that the new businesses area is hosted in the central administration and also to the fact that the largest information technology projects are corporative, having their execution and hardware installation centered in the headquarters. The implementation of ERP, implementation of assets management software, implementation of the cost management and budgets software are examples of information technology projects.
The analysis of Figure 5 shows that the profile of projects of the largest plant in terms of number of projects prioritizes the characteristic end of service life and modernization. Safety, costs reduction and quality are the other priorities in that unit in this sequence.
Table 3. Annual historic of the number of projects per unit and total of enterprise.
ADM Unit 1 Unit 2 Unit 3 Unit 4 Total enterprise
2001 13 64 72 33 20 202 2002 13 68 77 38 15 211 2003 14 73 72 28 16 203 2004 16 75 75 30 10 198 2005 11 38 50 30 11 140 0 10 20 30 40 50 60 70 80 Number of projects AD CA CP EE IF MD NP QS RC SG VU Characteristics 2001 2002 2003 2004 2005
Figure 3. Annual historic of the number of projects x char-acteristic. 0 2 4 6 8 10 12 Number of projects AD CA CP EE IF MD NP QS RC SG VU Characteristics 2001 2002 2003 2004 2005
Figure 4. Annual historic of the number of projects x charac-teristic – headquarters. 0 5 10 15 20 25 30 35 Number of projects AD CA CP EE IF MD NP QS RC SG VU Characteristics 2001 2002 2003 2004 2005
Figure 5. Annual historic of the number of projects x charac-teristic – plant 1. 0 5 10 15 20 25 30 35 Number of projects AD CA CP EE IF MD NP QS RC SG VU Characteristics 2001 2002 2003 2004 2005
Figure 6. Annual historic of the number of projects x charac-teristic – plant 2.
0 2 4 6 8 10 Number of projects AD CA CP EE IF MD NP QS RC SG VU Characteristics 2001 2002 2003 2004 2005
Figure 7. Annual historic of the number of projects x charac-teristic – plant 3. 0 1 2 3 4 5 6 7 Number of projects AD CA CP EE IF MD NP QS RC SG VU Characteristics 2001 2002 2003 2004 2005
Figure 8. Annual historic of the number of projects x charac-teristic – plant 4. 0 10 20 30 40 50 60 70 80 Number of projects AD CA CP EE IF MD NP QS RC SG VU Characteristics 2001 2002 2003 2004 2005
Figure 9. Annual historic of the value of the project invest-ment budgeted and accomplished- total of enterprise.
0 2,000 4,000 6,000 8,000 10,000 12,000 14,000
Orç. Real. Orç. Real. Orç. Real. Orç. Real. Orç. Real. Orç. Real. Orç. Real. Orç. Real. Orç. Real. Orç. Real. Orç. Real.
AD CA CP EE IF MD NP QS RC SG VU Characteristics V alues (USD x 1,000) 2001 2002 2003 2004 2005
Figure 10. Annual historic of the value of the project invest-ment budgeted and accomplished - headquarters.
Comparing the budget values with the accomplished value, it is verified that the budget value is higher than the one accomplished, following the profile of the company, or rather, apparently the organization proposes to accomplish more projects than it is able to. Another hypothesis for the observed profile would be that the budgets are overestimated. However, in interviews with coordinators of information technology and of engineering projects, the explanation is
that the projects are prematurely submitted to the approval of the Board, thus its chronogram suffers many alterations and this delays the implementation and, consequently, the expenditure.
The analysis of Figure 11 shows that, although the largest number of projects of plant 1 is end of service life, in terms of budget values the few projects of capacity increase and new products are more significant. Apparently, since 2004 the company has been investing great values in projects with these characteristics and reducing the value of the investments with end of service life. It is inferred that the unit has already modernized in the previous years and is now in expansion. About the comparative degree between budgeted and accomplished values, the same previous comments are valid. The real values are always smaller than the budgeted ones.
Plant 2, as can be seen in Figure 12, has also been investing great values in capacity increase and in environment control since 2004. End of service life, despite being an important
0 1,000 2,000 3,000 4,000 5,000 6,000
Orç. Real. Orç. Real. Orç. Real. Orç. Real. Orç. Real. Orç. Real. Orç. Real. Orç. Real. Orç. Real. Orç. Real. Orç. Real.
AD CA CP EE IF MD NP QS RC SG VU Characteristics V alues (USD x 1,000) 2001 2002 2003 2004 2005
Figure 11. Annual historic of the value of the project invest-ment budgeted and accomplished - plant 1.
0 2,000 4,000 6,000 8,000 10,000 12,000 14,000 16,000
Orç. Real. Orç. Real. Orç. Real. Orç. Real. Orç. Real. Orç. Real. Orç. Real. Orç. Real. Orç. Real. Orç. Real. Orç. Real.
AD CA CP EE IF MD NP QS RC SG VU Characteristics V alues (USD x 1,000) 2001 2002 2003 2004 2005
Figure 12. Annual historic of the value of the project invest-ment budgeted and accomplished - plant 2.
subject in number, in values it appears in the third place. The unit is carrying out a great construction project of an effluent treatment station of and a new plant for one of the main lines of products. These few projects justify the ratio of investments. Thus, along the 5 years constancy in the value of investments with end of service life is observed, a fact that denotes concern in keeping the installations.
Figure 13 shows the profile of investments of plant 3. It can be verified that great projects were initiated in 2004 for capacity increase. It is also verified that in this unit, in terms of investments, the second priority is quality. This is due to the fact that the unit works with cosmetic segment products which are liable to contamination and, because of this, demand special attention. When compared, the budgeted and accomplished values per year and per characteristic show that in 2003 and 2004 the budget was exceeded mainly in the administrative, environment control and increase of capacity types. In this in case, it is clear that the expansion project had management problems.
Figure 14 shows the investments of the smallest unit of the organization. This plant is mono producing and has invested in capacity growth. The comparative between budgeted value and accomplished value shows the budget has been met since 2002.
Considering the great number of operational projects type current investment, this was chosen for individual analysis as far as deadline is concerned for the projects with higher value.
Table 4 provides an overview of the performance of the 6 largest projects of the organization object of this study in the last 5 years. In the selected cases, deadlines and budgets were met, yet the existence of some problems is observed. The scope of the project of the electrical substation was modified, having been reduced. The ERP project started on time and met the budget; however, quality problems in the implementation and users’ claims originated another
0 500 1,000 1,500 2,000 2,500 3,000 3,500 4,000 4,500
Orç. Real. Orç. Real. Orç. Real. Orç. Real. Orç. Real. Orç. Real. Orç. Real. Orç. Real. Orç. Real. Orç. Real. Orç. Real.
AD CA CP EE IF MD NP QS RC SG VU Characteristics V alues (USD x 1,000) 2001 2002 2003 2004 2005
Figure 13. Annual historic of the value of the project invest-ment budgeted and accomplished - plant 3.
0 200 400 600 800 1,000 1,200 1,400
Orç. Real. Orç. Real. Orç. Real. Orç. Real. Orç. Real. Orç. Real. Orç. Real. Orç. Real. Orç. Real. Orç. Real. Orç. Real.
AD CA CP EE IF MD NP QS RC SG VU Characteristics V alues (USD x 1,000) 2001 2002 2003 2004 2005
Figure 14. Annual historic of the value of the project invest-ment budgeted and accomplished - plant 4.
improvement project. Project 1 referred to the new product unit with new technology and a new products line, which was inactivated soon after construction due to lack of market. Project 2 related to a new unit with a new line of products, which, soon after being concluded, evidenced that the potential market is much greater, demanding a new expansion project. This increases the total costs of the project, sub-utilize the staff involved in the project and causes lay out problems in a plant with no room for growth.
4.2. Interview analysis
In the interview with employees of areas that monitor investments and coordinate projects, it was possible to verify that there are frequent changes in the sequence of execution of the projects due the pressures from the commercial area that unilaterally negotiates deadlines, without taking into account that human resources bottlenecks can occur for carrying out the projects.
According to the interviewees, variations in project scope are also common. As they are prematurely started
and to prioritize the portfolio and, in a second phase, to develop an optimizing model for monthly programming the projects composing the portfolio.
6. References
ADNER, R.; LEVINTHAL, D. Demand Heterogeneity and Technology Evolution: Implications for Product and Process Innovation. Management Science, v. 47, n. 5, p. 611-628, 2001.
ARCHER, N. P.; GHASEMZADEH, F. An Integrated Framework for Project Portfolio Selection. International Journal of Project Management, v. 17, n. 4, p. 207-216, 1999.
BROWN, S; EISENHARDT, K. Competing on the Edge: Strategy as Structured Chaos. Cambridge: Harvard Business School Press, 1998. 272 p.
CARVALHO, M. M.; LAURINDO, F. J. B. Linking strategy with a network of performance indicators: a Brazilian Research Centre case study. International Journal of Business Performance Management, v. 5, n. 4, p. 285-301, 2003.
CARVALHO, M. M.; LAURINDO, F. J. B.; PESSOA, M. S. P. Information Technology Project management to achieve efficiency in Brazilian Companies. In: KAMEL, S. (Org.). Managing Globally with Information Technology. Hershey, 2003. p. 260-271.
CHRISTENSEN, C. M.; RAYNOR, M.; VERLINDEN, M. Skate to where the Money will be. Harvard Business Review, v. 79, n. 10, p. 72-81, 2001.
CHRISTENSEN, C. M.; OVERDORF, M. Meeting the challenge of disruptive change. Harvard Business Review, v. 78, n. 2, p. 66-76, 2000.
COOPER, R.; EDGETT, S.; KLEINSCHMIDT, E. Portfolio Management for New Product Development. R & D Management, v. 31, n. 4, p. 361-380, 2001.
COOPER, R.; EDGETT, S.; KLEINSCHMIDT, E. New Product Management: Practices and Performance. by pressures from the commercial area, and during their
fulfillment technical or market problems are found, changes in scope occur. Another outstanding point is that the team responsible for projects implementation is small, being 3 implementation coordinators in the headquarters and 12 more from different areas throughout the plants. These, however, divide their time among the task of managing projects and carrying out tasks that compose the maintenance routine.
5. Conclusion
The data collected point to a great number of projects of operational nature of investments that can lead to losing the focus. Although the strategic investments are in small number, with special planning, achievement and follow-up, they suffer variations in scope that harm meeting deadlines and values.
The fact that there is no methodology for prioritizing the operational projects, nor a systematic to revise the list of active projects and provide feedbacks, indicates a problem that can cause delays in the chronogram, achievement of the wrong projects and exceeded budget, all problems found in the organization studied.
However, the management of the selected projects is perceived to be made by two basic criteria: financial and strategic. They lack prioritization rules for the projects that compose the portfolio. Consequently, target alterations are frequent, and problems of delay in the chronogram, exceeded budgeted values and problems of quality after-implementation, which are problems found in the literature. The existence of many projects takes away the organization focus on what is really worthwhile. As a proposal to prevent such problems, it would be interesting to reduce the number of projects of the operational type to reduce the degree of complexity of the portfolio management. Another suggestion would be to create distinct teams to assist the maintenance routine and project implementation activities. As a last suggestion for future work, it would be interesting to try to apply the model considered by Archer and Gasemzadeh (1999), using the AHP method to select
Table 4. Analysis of the 6 biggest investments of the organization budgeted x accomplished
Characteristic Scope Start date End date Estimated investment
(USDx1000) Real investment (USDx1000)
RC Electric substation – unit 1 Jan./00 Aug./04 4740.4 1926.4
IF ERP Apr./02 May/03 5080.0 4837.3
NP Storage adequacy – unit 1 Sept./03 Apr./05 4404.7 4435.6
CP Unit Debottleneck – unit 1 Sept./03 Aug./05 3506.2 3098.9
NP 1. New plant with new technology and new product line – unit 2
Jan./99 June/04 2749.5 2671.5
NP 2. New unit with new product line – plant 2
LAGER, T. A Structural Analysis of Process Development In Process Industry. A New Classification System For Strategic Project Selection and Portfolio Balancing. R&D Management, v. 32, n. 1, p. 87-95, 2002.
MCFARLAN, F. W. Portfolio Approach to Information. Harvard Business Review, v. 59, n. 5 , p. 142-150, 1981. ROUSSEL, P.; SAAD, K. N.; ERICKSON, T.J. Third
Generation R&D Managing the Link to Corporate Strategy. Cambridge: Harvard Business School Press, 1991.
TRITLE, G. L.; SCRIVEN, F. V.; FUSFELD, A. R. Resolving uncertainty in R and D portfolios. Research Technology Management, v. 43, n. 6, p. 47-55, 2000.
WHEELWRIGHT, S. C.; CLARK, K. B. Revolutionizing New Product Development. New York: The Free Press, 1992. YIN, R. K. Case Study Research: Design and Methods. 2 ed.
Thousand Oaks: Sage Publications, 1994. Journal of Product Innovation Management, v. 16, n. 4,
p. 333 - 351, 1999.
COOPER, R. G.; EDGETT, S. J.; KLEINSCHMIDT, E. J. Portfolio Management in New Product Development. Research Technology Management, v. 40, n.5, p. 16-28, 1997.
COOPER, R. G.; EDGETT, S. J.; KLEINSCHMIDT, E. J. Best Practices for Managing R&D Portfolios. Research Technology Management, v. 41, n. 4, p. 20-33, 1998. DRUCKER, P. F. Managing for Business Effectiveness.
Harvard Business Review, p. 53-60, 1963.
EISENHARDT, K. M.; BROWN, S. L. Patching Restitching Business Portfolios in Dynamic Markets. Harvard Business Review, p. 72-82, 2000.
ELTON, J.; ROE, J. Bringing Discipline to Project Management. Harvard Business Review, v. 76 , n. 2 , p. 153-159, 1998.
JOLLY, D. The Issue of Weightings in Technology Portfolio Management. Technovation, v. 23, n. 5, p. 383-391, 2003.