(IJSBAR)
ISSN 2307-4531 (Print & Online)
http://gssrr.org/index.php?journal=JournalOfBasicAndApplied
---
55
GIS-Based Flood Hazard Mapping in EravurPattu
Divisional Secretariat, Batticaloa District, Sri Lanka
Aashifa M. A. R.
a*, Akther M. S. R.
b, Tharani G
ba
Department of Bio-Science, Faculty of Applied Science, Vavuniya Campus of the University of Jaffna, Vavuniya, 43000, Sri Lanka)
b
Postgraduate Institute of Agriculture, University of Peradeniya, Peradeniya, 20400, Sri Lanka
a Email:aashifmar@gmail.com b Email:aktherroshan@gmail.com c Email:tharanigopal15@gmail.com Abstract
In the recent past, Sri Lanka experienced heavy floods in the Eastern Province. The livelihoods of many households in the East are affected by flood frequently. The objective of this study was to create a flood hazard risk map of EravurPattu DS division based on flood occurrence, topographical, hydrological and population census data. Geographic Information System (GIS) is used in this study to identify the hazard zone by floods. Variables such as number of flood occurrence, population density, elevation and the distance between the water bodies and the flood occurred area were considered for this study. The knowledge-based ranking scheme was applied to each of the four variables. Indicators that represent a high-level impact across the GN division were given higher ranks. Priority was given according to the level of impact on each division. All the factors were assigned equal weights and final flood hazard index map was produced by weighted overlay technique using Arc GIS. The study revealed that 80% of GN divisions in EravurPattu can be categorized under high and very high flood hazard areas. This study recommends to undertake remedial measures on land use planning.
Keywords: Environmental degradation; Flood hazard; Geographical information system; Knowledge-based
ranking scheme; Weighted overlay method.
--- * Corresponding author.
56
1.Introduction
Flood is most devastating, widespread and frequent natural hazard in the world. This problem is more acute in developing countries with heavy environmental degradation due to population pressure and vulnerability. Flooding is arguably the weather-related hazard that is most widespread around the globe. It is an event which occurs when there’s an overflow of water that submerges land [1]. It is one of the natural environmental hazards ravaging the landscape of mankind over the years and whenever flood occur, they result in the loss of properties, lives, destruction of farmlands etc. in most towns in the world [2].
Flood risk can be discussed in terms of two elements: vulnerability and hazard. Flood hazard mapping is a vital component for appropriate planning in flood-prone areas. It creates easily read, rapidly accessible charts and maps, which facilitates the administrators and planners to identify areas of risk and prioritize their mitigation/response efforts. The regulation of flood hazard areas coupled with enactment and enforcement of flood hazard zoning could prevent damage of life and property from flooding in short-term as well as in long term. This could not become technically feasible without effective flood hazard and risk mapping. Flood risk mapping is the vital component in flood mitigation measures and land use planning [3].
The objective of this study is to generate a flood hazard risk map based on flood occurrence, topographical, hydrological and population census data.
Development of a flood risk map is essential for a area like EravurPattu Divisional Secretariat (DS) division which affected by frequent flood during the rainy season. Identifying the flood prone area is essential to the administrative planners to undertake necessary actions for flood preparedness.
2.Materials and method 2.1.Study area description
EravurPattu is one of the 14 DS divisions in Batticaloa district, located between 7°49'13.26" to 7°30'32.86" Northern latitude and 81°37'34.99" to. 81°31'7.82"Eastern longitude with an area of 634.16 Km2. It comprises 39 GramaNiladari (GN) divisions including 203 villages with population of 70100. Agriculture is the primary livelihood for most of the households. Two rainy seasons across this region, during November to February due
57
to the north-east monsoon and during March to October due to the south west monsoon. This region heavily affected by flood every year due to north east monsoon [4].
2.2.Data collection and processing
District map of the study area with 39 GN divisions, SRTM 30m DEM, water bodies, frequency of flood occurrence and population census data were used for this study. Secondary data were collected from EravurPattu DS division and DMC (Disaster Management Centre).All the analysis were exploited using Arc GIS 10.2.2. This research work carried out by considering four factors, including the number of flood occurrence, population density, elevation, and near distance from water bodies which are individually and collectively influential to determine the rate of flood hazard to prepare the final flood hazard profile. Knowledge-based ranking scheme was applied to each of the four variables. Indicators that represent a high level of impact across the GN division were given more rank. Rate of flood hazard was determined by sum of all scores. For preparing a flood risk map, all the ranks of factors were used as an additive model to prepare final flood hazard index (FHI) for GN divisions [5].
FHI = (R_Pop + R_Dist + R_Freq + R_Elev) (1) Where:
− R_Dist is rank for the GN divisions’ proximity to the water bodies − R_Elev is rank for GN divisions’ highest elevation
− R_Pop is rank for GN divisions’ population density − R_Freq is rank for frequency of flood occurrence
All the factors were given equal weightsto produce final composite map [6]. Final Hazard index map was produced by using weighted overlay technique in GIS platform.
Table 1: Data used in deriving flood hazard variables and maps at divisional level
Study scale Suitable scale of representation
Hazard indicators Hazard factor Variable name Source EravurPattu DS divisions map 1:50 000 Number of flood occurrence (2004 - 2015) Risk of flooding Flood frequency Data cards of Disaster Management Centre Population density ( number of people per km2 ) Economic assets under flood threat Population density population census data of EravurPattu DS division Flood prone (1:50000) Shelter Highest elevation Aster DEM 30m resolution Distance from River (m): Proximity for flood hazard Near distance Calculated by Arc map
58
3.Results and Discussion 3.1.Elevation
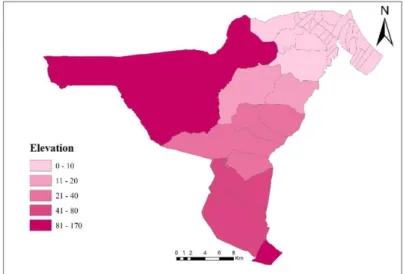
The DEM generated had been used to extract the highest point for each GN divisions. The GN boundary layer had been overlaid to the DEM and highest elevation for each polygon was extracted using ArcGIS [4]. The Near highest elevation of each division is shown in Figure 2. It was ranged from 0- 170m.
Figure 2: Elevation profile of EravurPattu DS division
distance between divisions and water bodies
For the analysis, various distances between the GN divisions and water bodies were determined. For that, point feature was created by defining the midpoints of each GN division in Arc GIS. The distances of each of the GN division from water bodies in Kilometers were found out using Near Function analysis tools. The adjacent water bodies from the GN divisions shown in Figure 3.
59
3.2.Population density
The population density of each GN division was used to indicate the economic assets under potential flood threat. The population density was calculated for each and every GN division using the secondary data. Then it was classified as manually into 5 groups and ranks were assigned. Figure 4 is shown the classification according to the population density in every GN division.
3.3.Frequency of Flood occurrence
Flood occurrence is the most important factor of determine the severity of flood hazard. The frequency of flood occurrence details was collected from the database of Disaster Management Information System in the period from 2004 to 2015 and used to produce a map of flood occurrence in thestudy area as shown in Figure 5.
Figure 3: Frequency of flood occurrence
3.4.Flood hazard index
The ranking scheme for flood hazard indicators is presented in Tables 2, 3, 4 and 5.A scheme of progressive ranking was adopted (Table 2) based on the premise that flood hazard for a particular block increases in a nonlinear pattern with the number of flood occurrences over the 11-year period. GN divisions which had the higher frequency of flood occurrence were given higher ranks, on the other hand, very low or 0 ranking to prevent the GN divisions from getting a higher flood hazard index on the basis of other factors. similarly, ranks were assigned to other variables such as population density, the distance between water bodies and GN divisions and elevation respectively in Table 3, Table 4, Table 5.
Table 2: Ranks for flood occurrence
Frequency of flood occurrence rank 0-1 0.25 1-4 1.5 5-11 5.5
60
Table 3: Ranks for population density
Population density Rank
0-3 0.25
4-10 1.5
11-15 2.5
16-24 4
24-37 6
Table4: Ranks for near distance between water bodies and GN divisions
Near distance Rank
0-87 6
87 - 385 4.5 386 - 650 3.5 651 - 1468 1 1469 - 2400 0.25
Table 5: Ranks for elevation
Highest elevation rank
<=10 6
11-20 5.5
21-40 4
60-80 1.5
>=80 0.25
All the ranks of variables were used sum to prepare Final flood hazard index (FHI) for GN divisions. The final flood hazard map was prepared with the FHI values shown in Table 6.
FHI had been classified into four hazard categories by using natural breaks (Jenks) scheme. Breakpoints were set depending on inherent clustering pattern of the FHI in Arc map and class boundaries were set with a relatively big jump in the data values and level of hazard [7]. The hazardous category with classified FHI value is shown in Table7.
61
Table 6: Flood Hazard Index
FID G. N. Division R_Pop R_Freq R_Dist R_Elevation FHI 1 Arumugaththan Kudiruppu-1 2.5 0.25 1 6 9.75 2 Arumugaththan Kudiruppu-2 4 0.25 1 6 11.25 3 Chenkalady-1 6 5.5 4 6 21.5 4 Chenkalady-2 4 5.5 1 6 16.5 5 Ellainagar 1.5 0.25 3 6 10.75 6 Eralakkulam 0.25 0.25 5 0 5.5 7 Eravur-4 2.5 0.25 0 6 8.75 8 Eravur-5 2.5 0.25 0 6 8.75 9 Gemunupura 2.5 0.25 1 0 3.75 10 Iyankerny 2.5 1.5 3 6 13 11 Kaluvankerny-1 4 0.25 3 6 13.25 12 Kaluvankerny-2 2.5 0.25 2 6 10.75 13 Karadiyanaru 0.25 0 .25 1 4 6 14 Kiththul 0.25 0.25 4 4 8.5 15 Koduvamadu 0.25 0.25 4 5 9.5 16 Kommathurai-East 6 0.25 2 6 14.25 17 Kommathurai-North 4 0.25 1 6 11.25 18 Kommathurai-West 0.25 1.5 5 6 12.75 19 Koppavely 0.25 0.25 1 2 3.5 20 KumaraveliyarKiramam 4 0.25 5 6 15.25 21 Marappalam 0.25 0.25 0 1 1.5 22 Mavedivembu-1 6 1.5 2 6 15.5 23 Mavedivembu-2 6 0.25 2 6 14.25 24 Mylampavely 0.25 1.5 2 6 9.75 25 Mylavedduvan 0.25 0.25 2 5 7.5 26 Palachcholai 6 0.25 2 6 14.25 27 Pankudavely 0.25 0.25 1 5 6.5 28 Periyapullumalai 0.25 0.25 1 1 2.5 29 Rugam 0.25 0.25 5 4 9.5 30 Savukkady 1.5 0.25 4 6 11.75 31 Sittandy-1 6 5.5 5 6 22.5 32 Sittandy-2 2.5 5.5 1 6 15 33 Sittandy-3 6 5.5 2 6 19.5 34 Sittandy-4 0.25 5.5 2 6 13.75 35 Thalawai 2.5 0.25 0 6 8.75 36 Thannamunai 1.5 0.25 1 6 8.75 37 Vantharumoolai-East 6 1.5 2 6 15.5 38 Vantharumoolai-West 2.5 1.5 1 6 11 39 Veppavedduvan 0.25 0.25 6 5 11.5
62
Table 3: Classification of hazard category
FHI_value Number of GN divisions Hazard category
1-3 2 Low
3-8 6 Medium
8-15 24 High
15-23 7 Very High
Final hazard map is depicted in Figure 6.
Figure 4: Final flood hazard map
About 18%, 62%, 15% and 5% of GN divisions were categorized into very high, high, medium and low hazard zone respectively. Nearly 80% of GN divisions (31 out of 39) are in danger zone while about 15% of GN divisions (6 out of 39) are categorized into medium hazard zone. Only 5% of GN divisions (2 out of 39) were in thesafer zone.
In the case of Vantharamunai-East though the frequency of flood was low, cause a higher risk of flood hazard. Resulted scenario was possible due to existing land use patterns.
4.Conclusion and Recommendation
63
study was carried out to produce a flood hazard risk map. Weighted overlay or additive method was used to prepare the composite map of flood hazard based on flood preparedness of each GN divisions in the EravurPattu division. In developing this map four variables (distance to water bodies, population density, thefrequency of flood occurrence and elevation) were taken into the consideration. Each of the factors had been assigned adifferent ranking to quantify the severity of hazard and also equal weight was given to each variable. According to the study, nearly 80% of GN divisions were in apotential threat from flood hazard. It is urgent to undertake immediate actions by relevant authorities to protect people and livelihood from flood hazard. Also, it is essential to implement proper land use planning and disaster management strategies to minimize the impacts from floods.
References
[1]. Ojeh, V.N. and Ugboma, P., Flood Hazards in Urban Niger Delta: A Case Study of Abraka Town, Delta State, Nigeria. International Journal of Environmental Engineering Research,2012, 1, pp. 23-29. [2]. Ojeh V.N. and Victor-Orivoh A.F. (2014). Natural Hazard and Crop Yield in Oleh, South-South
Nigeria: Flooding in Perspective. Journal of Earth Science & Climatic Change, 5, 181, http://dx.doi.org/10.4172/2157-7617.1000181.
[3]. Coppock, J. T., GIS and natural hazard: an overview from GIS perspective. In Carrara A, Guzzeti F., (eds), Geographical Information System in Assessing Natural Hazard, Kluwer Academic, Dordrecht.1998, 4-31
[4]. Statistical handbook of Batticaloa district. Batticaloa District Secretariat, Sri Lanka, 2015.
[5]. Sanyal, J., Lu X.X., Application of remote sensing in flood management with special: reference to monsoon Asia: a review. Natural Hazards, 2004, 33, 283–301.
[6]. Akther, M.S.R and Tharani, G., Flood hazard mapping in Urban Council limit, Vavuniya District, Sri Lanka- A GIS approach. International Research Journal of Environmental Sciences, 2016, 5 (9), pp.27-31.
[7]. McCoy, J., and Johnston, K. (2005), “Using ESRI AcrGIS Spatial Analyst”, Accessed fromhttp://www.esri.com on 5th June 2010.