Information Diffusion and Economic Development
Chris Smith-Clarke
Department of Computer ScienceUniversity College London Gower Street
London, UK [email protected]
Licia Capra
Department of Computer Science University College London
Gower Street London, UK [email protected]
Abstract—In many developing countries there remains a lim-ited view on the socioeconomic status of the population, owing to the high cost associated with detailed and comprehensive surveying. This situation has encouraged a number of researchers to attempt to exploit alternative sources of data in order to derive estimates, including mobile phone data, which offers a rich depic-tion of the social dynamics of a populadepic-tion. Meanwhile, from the level of the individual to the city, access to information has been posited as an important factor in determining prosperity and economic development. In this paper we explore this relationship by simulating the flow of information through a mobile phone call graph in two sub-Saharan countries. We find a strong relationship between a location’s average wealth and its access to information as determined by the simulations in one country, and a weaker correlation in the second country. This finding adds to recent evidence that mining patterns from mobile phone data represents a viable means to estimate poverty in places where traditionally derived estimates are lacking. We further investigate the impact of various factors on the empirical results in order to explain the variation between the two countries.
I. INTRODUCTION
The way in which social network structure mediates access to information has been identified as an important factor in generating individual prosperity. For example Granovetter’s strength of weak ties theory [1], [2] and Burt’s theory of struc-tural holes [3] suggest the degree to which personal networks overlap significantly impacts the diffusion of influence and information through a social network. Likewise information flow is said to play an important role in determining prosperity and the rate of innovation in cities. Many characteristics of urban areas have been found to scale super linearly with population size, including crime levels, the spread of infectious diseases, and also economic development as measured by Gross Domestic Product [4]–[6]. This relationship has been attributed to denser social network formation since social net-works tend to densify as the number of individuals increases, which in turn increases flow of information [7], [8]. It has further been shown that having a diverse set of contacts is strongly related to living in a less deprived neighbourhood [9]. These results suggest that ranking cities according to pop-ulation should provide a reasonable indication of relative economic development, and indeed, it has been shown that such an approach offers a reasonable baseline estimate [10]. However, such a baseline ignores the effect of information flowing between cities and treats cities as informational silos,
ranking based on how fast information is likely to be diffused within. In this paper, we take a wider scope by simulating the information flow between cities (and towns and rural areas), and study the relationship between diffusion rates at this scale and economic wealth.
Our motivation for this study is the severe lack of detailed and up to date information regarding of the distribution of wealth and poverty in many parts of the developing world. Traditionally, to acquire this knowledge has required manual collection of household survey data, the costs of which put this method beyond the means of some poorer nations. Towards mitigating this problem, recent research has highlighted the potential for producing estimates of the spatial distribution of poverty or socio-economic status from models incorporating features of mobile phone call activity [11]–[13].
A potential explanation for the apparent success of these endeavours is that the mobile call graph reflects the flow of information throughout a country, and patterns of informa-tion diffusion are in turn related to economic development. Therefore, by extracting features that quantify this process we are able to infer the underlying socioeconomic level to a reasonable degree. We aim to test this hypothesis by simulating the flow of information through the network. We then examine the strength of association between a location’s access to information and its level of economic development.
The novel contributions of this paper are two fold. Firstly, we go beyond measuring features of the static call graph by creating simulations of information diffusion processes to rank regions in two countries according to the regions’ access to information, or susceptibility, and find that this correlates with its average level of wealth, as measured by household surveys. This finding not only adds to the growing body of evidence that viable proxy indicators of poverty or economic level can be derived from aggregated mobile phone data, but also suggests that what makes this possible is that the mobile call graphs reflect the flow of information around a country. Secondly, we examine the degree of influence on our results of several contextual factors. We find that the measured strength of association between wealth and access to information is sensitive to the level of spatial aggregation, the coverage of the mobile network, as well the reliability of the ground truth data. These findings highlight important considerations for any interpretation of mobile phone based socioeconomic
indicators.
The paper is structured as follows. After introducing related works that look at novel methods for estimating poverty or wealth, as well as background literature on information diffusion, we study the structure of networks derived from the mobile phone data, and highlight the main differences between them and more commonly studied forms of network. We then describe the approach to data aggregation and the methods used to simulate information diffusion. In the results section we examine in detail the correlation between access to information and wealth, and the influencing contextual factors, before concluding the paper.
II. RELATEDWORK A. Estimating Poverty or Socieconomic Level
Research has been active over the last decade to understand the relation between, on the one hand, factors of human well-being and socio-economics, and on the other, techno-logically mediated social networks, such as online services like Facebook and Twitter, and social relations represented in telecommunications networks. For example, Querciaet al.
found that deprivation in London, UK, varies geographically with topics of tweets discussed in different areas [14], and also that sentiment of tweets [15] correlates with deprivation. Gutierrezet al.[16] hypothesised that mobile top-up behaviour reflects the wealth of the phone user, with poorer people likely to top-up their phone credit in small amounts fairly frequently, whereas wealthier people are likely to top-up infrequently in larger amounts. They built a model based on this hypothesis, applied it to individual subscriber records from Cˆote d’Ivoire (not the same dataset as studied in this paper), and derived a proxy wealth indicator. Knowledge of individuals’ financial transactions is required by the model, which could be a limiting factor in the widespread adoption of this approach.
Other attempts to develop proxies for socio-economic fac-tors include the use of remote sensing, or satellite imagery, to identify the visual signs of economic development. The total area lit by Night Time Light (NTL) measured from satellite imagery was shown to correlate with a country’s Gross Domestic Product [17], [18]. Models built from NTL data often struggle to differentiate at the poorest end of the wealth distribution. However, more recently, Jean et al. [19] have shown that incorporating day time satelite imagery can significantly improve results, and moreover, models trained on imagery from one country sometimes show a reasonable accuracy when tested on data from another country.
Recently, Steele et al. [20] combined CDRs and remote sensing data, along with a number of other factors, into a spatial model of poverty in Bangladesh. They found that CDR-only and remote-sensing-CDR-only models perform comparably well in their ability to predict poverty indicators, and that the combined model offered further improvement.
CDRs, collected by telecommunication providers, have been studied extensively for a broad range of purposes: from under-standing human mobility [21]–[24] to land use identification and urban planning [25]–[27]. A handful of recent works have
specifically looked into the relationship between CDRs and socio-economic factors. Eagleet al.[28] found that diversity of contacts in a social network derived from fixed line calls was strongly correlated with economic deprivation in the UK. Work that directly explores the potential for mobile phone data to provide estimates of socio-economic factors includes that of Soto et al. [11] and Frias-Martinez et al. [29], [30], who defined a number of features that could be extracted from CDRs of a South-American city, and measured the extent to which they correlate with socioeconomic level. The most significant features were then used to build a classification model that could achieve up to 80% accuracy when classifying areas according to three classes of socioeconomic level. More recently, Hong et al. have improved this approach further by incorparating automatically generated features using La-tent Dirichlet Allocation [31]. Blumenstock et al. [32] have similarly created models of individual wealth using mobile phone data, and shown an impressive level of accuracy at various levels of spatial aggregation. An important distinction between these works and the present study is that only features measured on a static mobile call graph are considered in previous research, whereas we consider the information dif-fusion dynamics over the network. In doing so, we build upon these and our own previous work [10], [13] by providing both further evidence that mobile phone data can be used to create proxy socioeconomic indicators, and also by establishing a firmer explanation for why such models are able to achieve the performance they do.
B. Information Diffusion
Most previous research investigating the flow of information through networks has taken one of two similar approaches to modelling information diffusion processes. The first draws on the field of mathematical epidemiology where models of diffusion were first developed to describe the spread of a disease [33], [34]. These techniques were later applied to the study of the spread of rumors [35], [36], news [37] and infor-mation [38]. The second approach stems from sociology and focuses more explicitly on how social relationships determine the cascade of information or adoption of innovations [39], [40]. In a canonical study of the diffusion of innovations, Ryan and Gross demonstrated the importance of information sharing via interpersonal networks in the adoption among farmers of a newly developed hybrid variety of corn [39]. Similarly, Colemanet al. found that in a community of physicians peer influence drove the adoption of a new drug more so than positive results from clinical studies [41]. In both cases, the spread of information through social networks paved the way for what would prove to be a beneficial development in each respective community.
1) Epidemic Models: In the basic propagation models of epidemiology, nodes can take one of three states corresponding to the stages of disease. A person is first susceptible (S) to the disease and can become infected (I) with some probability if exposed to the disease by an infectious contact. That person, or node, is then able to infect their own contacts. Depending
on the model, after some time the person can either become recovered (R) and immune, and will be removed from the network (known as the SIR model), or recover but once again become susceptible (SIRS model), or indeed can remain permanently infected (SI model). Early studies of propagation took place on fully mixed networks in which a node is equally likely to infect any other node. Since then, however, research has considered more realistic models that take into account the structure of social networks [42].
The focus of these works has been primarily on global properties of diffusion processes, such as theepidemic thresh-old, or the minimum transmission probability at which the disease (or information) will spread to a certain fraction of the network. Small-world networks [43] and power law networks, which real-world networks are often found to be [44], exhibit strikingly different behaviour in this regard, with the latter often having an epidemic threshold of zero, meaning that an epidemic will always occur with some positive transmission probability.
For example, Wuet al. [45] study the flow of information through email networks using an SIR model, and compare the results to a modified version in which the transmission proba-bility decays as the distance from the seed node increases. As expected, the decay limits the scope of the spread of information, unlike the original version in which the epidemic threshold is zero as in other scale-free networks. In contrast to the forms of more commonly studied networks, the networks that we study are extremely dense (see Section III), therefore we would expect, as in the case of scale-free networks, that the epidemic threshold would be zero. However, we are not interested so much in global properties such as this, but rather in the behaviour of individual nodes as information propagates. In this vein, researchers have looked at the importance of nodes in propagating information and the effect that removing the most central nodes has on the diffusion rate, in order to shed light on the resilience of networks [46], [47], and also on how best to limit the spread of computer viruses via email [48]. In this paper we seek to rank nodes in terms of their influence and ability to aquire information in order understand how this relates to economic development.
Relatedly, Pan et al. [8] hypothesise that the superlinear scaling of urban characteristics such as wealth and rate of innovation with population size can be attributed to social tie density, which in turn enables increased flow of information through the population. To test this, they simulated information flow using the SI model in synthetic city-wide social networks and, in support of their hypothesis, found that diffusion rates also scale super-linearly with population size. Similarly, an outcome of the work presented in this paper is evidence to support the hypothesis that information diffusion is what drives the association between a region’s wealth or poverty level, and features of the mobile call graph.
2) Cascade Models: In contrast to epidemic models, cas-cade models attempt to capture the decision making process of individuals. Cascade models can be further subdivided into threshold models and independent cascade models. In
TABLE I
DESCRIPTIVE STATISTICS OFCDRDATA.
Senegal Cˆote d’Ivoire
Country Population 20 m 15 m
Time span (weeks) 52 12
Number of BTS towers 1614 1217 Mean Daily Volume 4.0 m 10.8 m Mean BTS Distance 236 km 228 km
threshold models, each node u in the network chooses a
threshold tu 2 [0,1], typically drawn from some probability
distribution. Every neighbor v of u has a connection weight
wu,v, and u adopts an innovation from (or is influenced in
some other way) its neighbours ifPv2Swu,v> tu, whereSis
the set of nodes that have already adopted the innovation [49]. We tested the suitability of the threshold model for measuring a region’s access to information but found that owing to the density of the networks we study, there was little variation in the behaviour of individual nodes.
Independent cascade (IC) models are named so because, unlike the threshold model, the probability that influence propagates from v to u does not depend on the weights of
u’s other connections, nor on the history of propagation in the network. Rather, if v adopts an innovation, then at the next time stepuwill adopt with some probabilitypu,v. Moreover,
if v fails to influence u at that time step, it will have no
further chances [50]. Gruhl et al. measure the influence of blog authors on one another by modelling the spread of topics using a variation of the IC model [51]. IC models are also often used in the context of influence maximisation [52] tasks, in which the aim is find the subset of nodes that can be seeded such that the maximum number of nodes in the network will adopt or be influenced.
In this paper we adopt these established diffusion modelling approachesin order to help understand how information flows throughout our countries of interest, and to reveal differences in the time taken for information to arrive in different regions.
III. NETWORKSTRUCTURE
In order to help interpret the results presented below, we first describe the main characteristics of the network data at hand. We obtained mobile phone datasets from two countries, Senegal and Cˆote d’Ivoire,1 which consist of the hourly call volume (total number of calls) between every pair of Base Transceiver Station (BTS) towers, over a period of 3 months for Cˆote d’Ivoire and 12 months for Senegal. Details of each dataset are summarised in Table I.
To build our call graphs we aggregate the total volume between regions over the total respective period in each country so that nodes represent regions. We then normalise edge weights by dividing by the maximum edge weight in the network. We combine calls in both directions so that
wij = wji since it is not clear whether the directionality of
a call has any bearing on the direction information is passed. The aggregated networks each have a density of1, that is, the networks are completely connected with every region having some level of communication with every other region. This high level of connectivity makes these kind of networks unlike the majority of networks studied in relation to information diffusion [8], [42], [49]–[52].
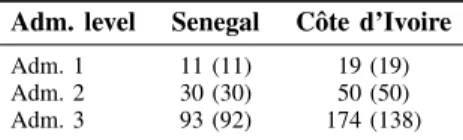
We compare the results of simulations at three levels of geographical aggregation corresponding to different admin-istrative levels. The sizes of the resulting call graphs are summarised in Table II. At the third administrative level there are 93 regions in Senegal and 177 in Cˆote d’Ivoire, and we include all regions as nodes in the call graph in order to accurately represent the flow of information. However, we present results pertaining only to those regions in which ground truth data was available (see Section V), which is 92 in Senegal and 138 in Cˆote d’Ivoire. The same is true of the higher level administrative regions, with the final number shown in parentheses in Table II.
TABLE II
NUMBER OF NODES(REGIONS)OF CALL GRAPHS AT DIFFERENT LEVELS OF AGGREGATION. THE NUMBER OF REGIONS CONTAININGDHS
CLUSTERS IS SHOWN IN PARENTHESES.
Adm. level Senegal Cˆote d’Ivoire
Adm. 1 11 (11) 19 (19) Adm. 2 30 (30) 50 (50) Adm. 3 93 (92) 174 (138)
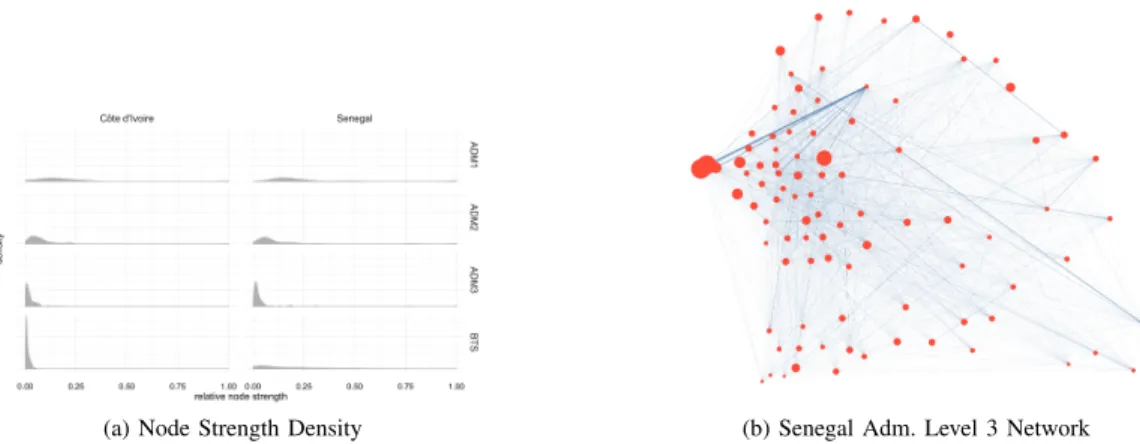
In the aggregated networks, since the edge density is 1 the degree distribution is uniform and therefore there is no correlation between a node’s degree and its strength, the total edge weight of a node. Topology alone therefore plays no role in determining information diffusion processes. However, the distribution of node strength is highly skewed, owing to the existence of a small number of hubs that account for a large portion of the total traffic on the network. As shown in Figures 1a and 1b, the weight structure of the network is highly heterogeneous and therefore this, rather than topology, will significantly affect diffusion processes across the network.
IV. SIMULATIONMODELS
To simulate the flow of information, we compare the results of two different models: a simple Susceptible-Infected (SI) model and the Independent Cascade (IC) model. For both models, at each time step a node is infected by its infected neighbour with some probability relative to the strength of the connection between them, P(i ! j) / wij, where
is a constant controlling the rate of diffusion. For the SI model, an infected node has a chance to infect its neighbours at each time step, whereas for the IC model, the infected node only has one chance to infect its neighbours. Intuitively, the SI model represents the case where the information being transmitted has some long-term value; for example, it could be the adoption of some new technology. The IC model represents
the case where the value of the information being transmitted has only temporary value, for example market news related to a certain company or industry, or it could perhaps represent the influence on the sentiment of consumers or producers regarding certain topics. We simulate the flow of information through the network by running multiple iterations, with each node playing the role of seed 100 times each. The average time taken for a node to be infected (i.e., receive the information) over all iterations is then used as a measure of access to information at that location. More precisely, we define sus-ceptibility of node v as Sv = 1/Pitv,i, where tv,i denotes
the time taken for nodevto become infected in iteration i. In other words, we take the inverse of the mean number of steps taken for the node to become infected in iterations in which nodev is not the seed.
We also experimented with the Linear Threshold (LT) model. Specifically, we set a uniform cascade threshold for each node, with the node becoming infected if the sum of weights from its infected neighbours exeeded this threshold. We found that the infection times where largely the same for all nodes and depended only on the choice of threshold and the strength of connections from the seed nodes. Unlike the SI and IC models, the LT model is deterministic, therefore, once the threshold is set sufficiently low for the seed nodes to infect a neighbour, the entire network becomes infected in just 2 or 3 steps. This result shows that for the purposes of distinguishing the role of nodes in information diffusion the LT model is inappropriate for the kind of networks that we are studying, i.e., completely connected. An alternative approach would be to vary the cascade threshold for each node relative to some characteristic. However, we did not explore this option since there were no reasonable candidate variables with which to do this.
We investigated the effect of varying in each of the models and found that this only has the effect of elongating the distribution of susceptibility, therefore we present the results for a single value of .
V. MEASURING ECONOMIC DEVELOPMENT
To test the hypothesis that access to information is related to economic development we use as a proxy for level of economic development an assets index taken from the Demo-cratic and Health Survey (DHS) undertaken in each country. The surveys take place with a sample of households that is designed to be representative at the largest subnational administrative region, of which there are 14 in Senegal and 11 in Cˆote d’Ivoire. The DHS consists of household question-naires, and the household sampling process consists of several stages. First, the country is stratified by an urban or rural designation within each subnational region; then, within each stratum, enumeration areas (EA) are selected with a probability proportional to their poulation size. EAs normally consist of neighbourhoods in urban areas and villages, or groups of villages in rural areas. Finally, households are randomly selected with uniform probability within each EA selected in the previous stage. The group of selected households within
(a) Node Strength Density (b) Senegal Adm. Level 3 Network
Fig. 1. (a) Probability density functions of node strength (total call volume) for networks aggregated to the three administrative (ADM) levels; (b) The geographical layout of the call networks at the third administrative level. The nodes are positioned according the population weighted centroids of the regions they represent and size corresponds to the population of that region. The edge thickness is sized according to the square root of call volume for visualisation purposes. It can be seen that the networks contain a small number of dominant nodes with relatively strong connections.
each EA are known as clusters. The GPS coordinates of the centroid of each cluster is provided with the DHS in order to enable spatial analysis of the survey data. However, in order to hide the identity of selected households, coordinates are randomly displaced within a circle of radius 2 km for urban clusters and 5 km for rural clusters, with 1% of rural clusters being displaced up to 10 km. The number of clusters sampled in Senegal and Cˆote d’Ivoireis comparable, with 385 (19.25 per million people) in Senegal and 341 (22.7 per million people) in Cˆote d’Ivoire. The geographical coverage differs significantly however, with 1.95clusters per km2 in Senegal and1.06clusters perkm2 in Cˆote d’Ivoire. We explore these differences further in Section VI-B
VI. RESULTS A. Susceptibility
Susceptibility of nodes as measured in the simulations of both the IC and SI models are very similar, as can be seen in Figures 2a and 2b. For this reason, for the remainder of the paper we focus on the results of the SI model.
In Senegal we find evidence of a strong association between susceptibility and wealth. At the third administrative level we have a Pearson’s correlation coefficient of 0.77 (95% CI [0.67,0.85]), and for poverty rate the correlation is 0.63 (95% CI [ 0.74, 0.47]). However the relationship appears to be much weaker in Cˆote d’Ivoire, where the correlation be-tween susceptibility and wealth is 0.31(95% CI[0.15,0.46]), and with poverty rate it is 0.34 (95% CI [ 0.48, 0.18]). Figures 2c and 2d show the association between susceptibility and the DHS wealth index at all three administrative levels. Full results are presented in Tables III and IV.
B. Contextual Factors
1) Representativeness: We can see that for Senegal that the higher the administrative level, and correspondingly the greater the level of aggregation, the stronger the correlation between susceptibility and both wealth and poverty rate. Recalling that
TABLE III
CORRELATION(r)AND CONFIDENCE INTERVALS(CI)BETWEEN SUSCEPTIBILITY IN THESIMODEL AND WEALTH AT THE THREE
ADMINISTRATIVE LEVELS Adm. Level r CI Senegal 12 0.880.84 [0.60, 0.97][0.68, 0.92] 3 0.77 [0.67, 0.85] Cˆote d’Ivoire 12 0.290.17 [-0.19, 0.66][-0.11, 0.43] 3 0.31 [0.15, 0.46] TABLE IV
CORRELATION(r)AND CONFIDENCE INTERVALS(CI)BETWEEN SUSCEPTIBILITY IN THESIMODEL AND POVERTY RATE AT THE THREE
ADMINISTRATIVE LEVELS. Adm. Level r CI Senegal 12 -0.71-0.65 [-0.91, -0.20][-0.82, -0.37] 3 -0.63 [-0.74, -0.47] Cˆote d’Ivoire 12 -0.27-0.21 [-0.64, 0.21][-0.46, 0.07] 3 -0.34 [-0.48, -0.18]
the DHS assets index is designed to be representative at only the highest (most aggregated) administrative level, a likely explanation is that the strength of the relationship is masked somewhat by the error inherent in the DHS cluster derived ground truth at lower aggregation levels. The correlation remains weak in Cˆote d’Ivoire at all levels, which at first seems to contradict this hypothesis. However, we note that the number of DHS clusters in Cˆote d’Ivoire regions is low with a median of 14, 4 and 1 in administrative levels 1, 2, and 3 respectively, compared to 30, 12, and 3 in Senegal. This dif-ference suggests that quality, or rather the representativeness, of ground truth data may be a factor in explaining the poor results in Cˆote d’Ivoire.
(a) Senegal (b) Cˆote d’Ivoire
(c) Senegal (d) Cˆote d’Ivoire
Fig. 2. (a) and (b) The Susceptible-Infected model and Independent Cascade model simulations produce similar rankings of areas in terms of susceptibility; (c) and (d) the association between susceptibility and wealth.
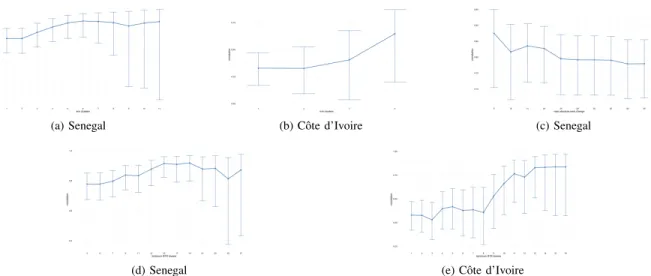
We investigated this aspect further by pruning stepwise the data points (regions) with fewest DHS clusters from the correlation analysis. The results for administrative level 3 are shown in Figures 3a and 3b. Strikingly, the strength of correlation climbs above0.93as we consider only regions with a larger number of DHS survey clusters in Senegal, although as n, the number of data points, decreases, so the confidence
intervals tend to widen. For example, if we exclude regions with fewer than 5 clusters the correlation coefficient is 0.91 (n = 29, CI = [0.81,0.96]). In Cˆote d’Ivoire the pattern is similar, albeit less pronounced since n drops rapidly as we prune regions, and consequently the confidence intervals widen. With a minimum of 4 clusters the correlation is 0.58 (n= 15, CI = [0.10,0.84]).
2) Volatility: Socioeconomic indicators are naturally dy-namic and can change from one year to the next, particularly in sub-Saharan Africa, where economies have experienced both rapid growth and rapid contraction. Considering this, we hypothesise that a further data quality issue is volatility over time in our chosen wealth indicator, which may also effect the strength of correlation we measure. To test this we compare the most recent (2012) ranking of regions according to the wealth index to that of the previous DHS survey (2010) and take the absolute rank change. This change could be attributed to either changing circumstances in the region or to inherent variation in the cluster sampling process. Stepwise we prune regions that have the largest absolute rank change so that the dataset contains less volatile regions. This is done only for Senegal as a previous comparable DHS survey was not available for
Cˆote d’Ivoire. As can be seen in Figure 3c, there is some evidence that by excluding more volatile regions the measured correlation is higher.
3) Network Coverage: We also investigated whether the coverage of the mobile phone networks could be a factor influencing the relationship between susceptibility and wealth. Poorer coverage in certain parts of a country would mean that the simulation of information diffusion would be less accurate and therefore we might expect weaker correlation. Indeed, we find that there is once again a large discrepancy between the geographical coverage of the mobile networks of Senegal and Cˆote d’Ivoire. The median number of BTS towers per region at the third administrative level is 11 in Senegal, compared to just 4 in Cˆote d’Ivoire. As with number of DHS clusters, we prune regions with fewest BTS towers and find that the measured correlation increases, as shown in Figures 3d and 3e. For example, in Senegal if we consider only regions with a minimum of 13 BTS towers the correlation is 0.90 (n = 34, CI = [0.80,0.95]), and likewise in Cˆote d’Ivoire if we consider only regions with at least 12 BTS towers the correlation is0.75(n= 15, CI= [0.38,0.91]).
The number of DHS clusters and BTS towers closely follows population density, that is, denser regions tend to have more of each. It is thus tempting to argue that the data must therefore be equally representative across all regions. However, such an argument fails to consider the role of geography, that is, that less dense areas also have a much less evenly distributed population, meaning that relatively more DHS clusters or BTS towers may be needed to provide a
similar level of coverage as found in denser areas.
4) Temporal Coverage: Finally, we investigated the effect of the difference in temporal coverage of our two case studies. Recall that the mobile phone data from Senegal covers a period of 12 months, compared to just 10 weeks in Cˆote d’Ivoire. To ascertain whether this helps explain the difference in strength of relationship between susceptibility and wealth we subdivided the Senegal data into four sets, with each covering a 3 month period and repeated the simulation experiments on these subsets. We found no substantial difference in the relative edge weights between each 3 month span, only a consistent growth across the whole network. Indeed, the correlation between wealth and susceptibility for each 3 month period is virtually identical. From this we can conclude that a period of the order of 3 months is sufficient to capture the prevailing temporal behaviour in a mobile call graph, and therefore the shorter time span of the Cˆote d’Ivoire dataset is unlikely to be an important factor in explaining the weaker results in that country.
VII. CONCLUSION
We have demonstrated a link between the flow of informa-tion between regions of a country, as revealed by simulainforma-tions of network diffusion, and the level of economic development of those regions. We found that by using susceptibility, or the average time taken to become ‘infected’ as a proxy, access to information appears to be related to economic development of a region. The implication of this is that by establishing a firmer link between access to information and poverty, we have a greater understanding ofwhythese models can achieve the success they do in the literature (not withstanding other more direct measures of wealth, such as top-up behaviour).
Of the two countries under study we have found a strong relationship in one but a weaker relationship in the other. We have conducted further investigations into the effect of contextual factors, the results of which suggest this discrep-ancy may be partly explained by the differences in coverage of the DHS cluster survey data we used as ground truth, as well as the geographical coverage of the mobile phone networks in each country. Indeed, when focusing on regions with relatively high mobile network and DHS coverage, the strength of correlation between susceptibility and wealth is found to be significantly higher. These findings have important implications for research into mobile phone based proxies of poverty. Namely, that by highlighting the effects of data quality and, moreover, by demonstrating increased performance when the data quality issue is removed, we can be much more confident that these methods will work in practice, with the proviso that a minimum level of geographical coverage of the mobile network is met.
Note that we have not attempted to establish a causal link between information flow and economic development, and it may be the case that the social connectivity of a location is reflective of its level of economic development, rather than vice versa, or indeed that they are effects of some third underlying process. Rather, we present these findings in order
to both increase the body of evidence establishing the potential for mobile phone based models to help fill the data gaps that exist in many parts of the world, and also to connect the recent advances in using mobile data derived models to predict poverty or economic level with theories that specify the importance of information flow for economic development.
REFERENCES
[1] M. S. Granovetter, “The strength of weak ties,” American journal of sociology, pp. 1360–1380, 1973.
[2] M. Granovetter, “The impact of social structure on economic outcomes,” Journal of economic perspectives, pp. 33–50, 2005.
[3] R. S. Burt, Structural holes: The social structure of competition. Harvard university press, 2009.
[4] S. Arbesman, J. M. Kleinberg, and S. H. Strogatz, “Superlinear scaling for innovation in cities,”Physical Review E, vol. 79, no. 1, p. 016115, 2009.
[5] L. M. A. Bettencourt, J. Lobo, D. Helbing, C. Khnert, and G. B. West, “Growth, innovation, scaling, and the pace of life in cities,” Proceedings of the National Academy of Sciences, vol. 104, no. 17, pp. 7301–7306, 2007.
[6] L. M. Bettencourt, J. Lobo, D. Strumsky, and G. B. West, “Urban scaling and its deviations: Revealing the structure of wealth, innovation and crime across cities,”PloS one, vol. 5, no. 11, p. e13541, 2010. [7] L. M. Bettencourt, “The origins of scaling in cities,”science, vol. 340,
no. 6139, pp. 1438–1441, 2013.
[8] W. Pan, G. Ghoshal, C. Krumme, M. Cebrian, and A. Pentland, “Urban characteristics attributable to density-driven tie formation.” Nature communications, vol. 4, p. 1961, 2013.
[9] N. Eagle, M. Macy, and R. Claxton, “Network diversity and economic development.” Science (New York, N.Y.), vol. 328, no. 5981, pp. 1029–31, May 2010.
[10] C. Smith-Clarke and L. Capra, “Beyond the baseline: Establishing the value in mobile phone based poverty estimates,” inProceedings of the 25th International Conference on World Wide Web. ACM, 2016, pp. 425–434.
[11] V. Soto, V. Frias-Martinez, J. Virseda, and E. Frias-Martinez, “Prediction of socioeconomic levels using cell phone records,” User Modeling, Adaption and Personalization, pp. 377–388, 2011.
[12] V. Frias-martinez, V. Soto, J. Virseda, and E. Frias-martinez, “Computing Cost-Effective Census Maps From Cell Phone Traces,” in Pervasive Urban Applications (PURBA), Newcastle, 2012.
[13] C. Smith-Clarke, A. Mashhadi, and L. Capra, “Poverty on the cheap: estimating poverty maps using aggregated mobile communication net-works,” inProceedings of the SIGCHI Conference on Human Factors in Computing Systems. ACM, 2014, pp. 511–520.
[14] D. Quercia, D. O. Seaghdha, and J. Crowcroft, “Talk of the City : Our Tweets , Our Community Happiness,” inProceedings of AAAI ICWSM, 2012.
[15] D. Quercia, J. Ellis, L. Capra, and J. Crowcroft, “Tracking Gross Community Happiness from Tweets,” in Proceedings of ACM CSCW 2012, 2012.
[16] T. Gutierrez, G. Krings, and V. D. Blondel, “Indicators of wealth, economic diversity and segregation in cˆote d’ivoire using mobile phone datasets,” inNetmob 2013 Book of Abstracts, 2013.
[17] C. D. Elvidge, K. E. Baugh, E. A. Kihn, H. W. Kroehl, and E. R. Davis, “Mapping city lights with nighttime data from the dmsp operational linescan system,” Photogrammetric Engineering and Remote Sensing, vol. 63, no. 6, pp. 727–734, 1997.
[18] X. Chen and W. D. Nordhaus, “Using luminosity data as a proxy for economic statistics,”Proceedings of the National Academy of Sciences, vol. 108, no. 21, pp. 8589–8594, 2011.
[19] N. Jean, M. Burke, M. Xie, W. M. Davis, D. B. Lobell, and S. Ermon, “Combining satellite imagery and machine learning to predict poverty,” Science, vol. 353, no. 6301, pp. 790–794, 2016.
[20] J. E. Steele, P. R. Sundsøy, C. Pezzulo, V. A. Alegana, T. J. Bird, J. Blumenstock, J. Bjelland, K. Engø-Monsen, Y.-A. de Montjoye, A. M. Iqbal, K. N. Hadiuzzaman, X. Lu, E. Wetter, A. J. Tatem, and L. Bengtsson, “Mapping poverty using mobile phone and satellite data,”Journal of The Royal Society Interface, vol. 14, no. 127, 2017.
(a) Senegal (b) Cˆote d’Ivoire (c) Senegal
(d) Senegal (e) Cˆote d’Ivoire
Fig. 3. Change in correlation between susceptibility and wealth as regions with fewest clusters are removed (a and b), as regions with highest volatility are removed (c), and as regions with fewest BTS towers are removed (d and e)
[21] F. Calabrese, F. Pereira, G. Di Lorenzo, L. Liu, and C. Ratti, “The geography of taste: analyzing cell-phone mobility and social events,” Pervasive Computing, pp. 22–37, 2010.
[22] F. Girardin, F. Calabrese, F. Fiore, C. Ratti, and J. Blat, “Digital footprinting: Uncovering tourists with user-generated content,”Pervasive Computing, IEEE, vol. 7, no. 4, pp. 36–43, 2008.
[23] J. Candia, M. Gonz´alez, P. Wang, T. Schoenharl, G. Madey, and A. Barab´asi, “Uncovering individual and collective human dynamics from mobile phone records,”Journal of Physics A: Mathematical and Theoretical, vol. 41, no. 22, p. 224015, 2008.
[24] J. Toole, M. Ulm, M. Gonz´alez, and D. Bauer, “Inferring land use from mobile phone activity,” in Proceedings of the ACM SIGKDD International Workshop on Urban Computing. ACM, 2012, pp. 1–8. [25] R. Becker, R. Caceres, K. Hanson, J. Loh, S. Urbanek, A. Varshavsky,
and C. Volinsky, “A tale of one city: Using cellular network data for urban planning,”Pervasive Computing, IEEE, vol. 10, no. 4, pp. 18–26, 2011.
[26] V. Soto and E. Fr´ıas-Mart´ınez, “Automated land use identification using cell-phone records,” inProceedings of the 3rd ACM international workshop on MobiArch. ACM, 2011, pp. 17–22.
[27] C. Ratti, S. Williams, D. Frenchman, and R. Pulselli, “Mobile land-scapes: using location data from cell phones for urban analysis,” EN-VIRONMENT AND PLANNING B PLANNING AND DESIGN, vol. 33, no. 5, p. 727, 2006.
[28] N. Eagle and M. Macy, “Network Diversity and Economic Development,”Science, vol. 1029, 2010.
[29] V. Frias-Martinez, J. Virseda-Jerez, and E. Frias-Martinez, “On the relation between socio-economic status and physical mobility,” Information Technology for Development, vol. 18, no. 2, pp. 91–106, Apr. 2012.
[30] V. Frias-Martinez and J. Virseda, “On the relationship between socio-economic factors and cell phone usage,” inFifth International Conference on Information and Communication Technologies and Development (ICTD ’12), New York, N.Y., USA, Mar. 2012. [31] L. Hong, E. Frias-Martinez, and V. Frias-Martinez, “Topic models to
infer socio-economic maps,” inThirtieth AAAI Conference on Artificial Intelligence, 2016.
[32] J. Blumenstock, G. Cadamuro, and R. On, “Predicting poverty and wealth from mobile phone metadata,”Science, vol. 350, no. 6264, pp. 1073–1076, 2015.
[33] N. T. Baileyet al.,The mathematical theory of infectious diseases and its applications. Charles Griffin & Company Ltd, 1975.
[34] J. Monin, R. Benayoun, and B. Sert,Initiation to the Mathematics of the Processes of Diffusion, Contagion and Propagation. Walter de Gruyter, 1976, vol. 4.
[35] D. Daley and D. G. Kendall, “Stochastic rumours,” IMA Journal of Applied Mathematics, vol. 1, no. 1, pp. 42–55, 1965.
[36] A. RAPOPORT and Y. YUAN, “Some aspects of epidemics and social nets,”The Small World, pp. 327–348, 1989.
[37] P. J. Deutschmann and W. A. Danielson, “Diffusion of knowledge of the major news story,”Journalism & Mass Communication Quarterly, vol. 37, no. 3, pp. 345–355, 1960.
[38] G. R. Funkhouser and M. E. McCombs, “Predicting the diffusion of information to mass audiences,” Journal of Mathematical Sociology, vol. 2, no. 1, pp. 121–130, 1972.
[39] B. Ryan and N. C. Gross, “The diffusion of hybrid seed corn in two iowa communities.”Rural sociology, vol. 8, no. 1, p. 15, 1943. [40] Z. Griliches, “Hybrid corn: An exploration in the economics of
techno-logical change,”Econometrica, Journal of the Econometric Society, pp. 501–522, 1957.
[41] J. Coleman, H. Menzel, and E. Katz, “Social processes in physicians’ adoption of a new drug,”Journal of Chronic Diseases, vol. 9, no. 1, pp. 1–19, 1959.
[42] M. E. Newman, “The structure and function of complex networks,” SIAM review, vol. 45, no. 2, pp. 167–256, 2003.
[43] D. J. Watts and S. H. Strogatz, “Collective dynamics of small-worldnetworks,”nature, vol. 393, no. 6684, pp. 440–442, 1998. [44] M. Al Hasan and M. J. Zaki, “A survey of link prediction in social
networks,” inSocial network data analytics. Springer, 2011, pp. 243– 275.
[45] F. Wu, B. A. Huberman, L. A. Adamic, and J. R. Tyler, “Information flow in social groups,”Physica A: Statistical Mechanics and its Appli-cations, vol. 337, no. 1, pp. 327–335, 2004.
[46] R. Albert, H. Jeong, and A.-L. Barab´asi, “Error and attack tolerance of complex networks,”nature, vol. 406, no. 6794, pp. 378–382, 2000. [47] D. S. Callaway, M. E. Newman, S. H. Strogatz, and D. J. Watts,
“Network robustness and fragility: Percolation on random graphs,” Physical review letters, vol. 85, no. 25, p. 5468, 2000.
[48] M. E. Newman, S. Forrest, and J. Balthrop, “Email networks and the spread of computer viruses,” Physical Review E, vol. 66, no. 3, p. 035101, 2002.
[49] D. J. Watts, “A simple model of global cascades on random networks,” Proceedings of the National Academy of Sciences, vol. 99, no. 9, pp. 5766–5771, 2002.
[50] J. Goldenberg, B. Libai, and E. Muller, “Talk of the network: A complex systems look at the underlying process of word-of-mouth,”Marketing letters, vol. 12, no. 3, pp. 211–223, 2001.
[51] D. Gruhl, R. Guha, D. Liben-Nowell, and A. Tomkins, “Information diffusion through blogspace,” inProceedings of the 13th international conference on World Wide Web. ACM, 2004, pp. 491–501.
[52] D. Kempe, J. Kleinberg, and ´E. Tardos, “Maximizing the spread of influence through a social network,” inProceedings of the ninth ACM SIGKDD international conference on Knowledge discovery and data mining. ACM, 2003, pp. 137–146.