Systematizing game learning analytics
for serious games
Cristina Alonso-Fernandez, Antonio Calvo, Manuel Freire, Ivan Martinez-Ortiz, Baltasar Fernandez-Manjon
Dept. Software Engineering and Artificial Intelligence
Universidad Complutense de Madrid, Facultad de Informática
C/ Profesor JoseGarciaSantesmases, 9 28040 Madrid, Spain
{crisal03, antcal01}@ucm.es {manuel.freire, imartinez, balta}@fdi.ucm.es
Abstract – Applying games in education provides multiplebenefits clearly visible in entertainment games: their engaging, goal-oriented nature encourages students to improve while they play. Educational games, also known as Serious Games (SGs) are video games designed with a main purpose other than pure entertainment; their main purpose may be to teach, to change an attitude or behavior, or to create awareness of a certain issue. As educators and game developers, the validity and effectiveness of these games towards their defined educational purposes needs to be both measurable and measured. Fortunately, the highly interactive nature of games makes the application of Learning Analytics (LA) perfect to capture students’ interaction data with the purpose of better understanding or improving the learning process. However, there is a lack of widely adopted standards to communicate information between games and their tracking modules. Game Learning Analytics (GLA) combines the educational goals of LA with technologies that are commonplace in Game Analytics (GA), and also suffers from a lack of standards adoption that would facilitate its use across different SGs. In this paper, we describe two key steps towards the systematization of GLA: 1), the use of a newly-proposed standard tracking model to exchange information between the SG and the analytics platform, allowing reusable tracker components to be developed for each game engine or development platform; and 2), the use of standardized analysis and visualization assets to provide general but useful information for any SG that sends its data in the aforementioned format. These analysis and visualizations can be further customized and adapted for particular games when needed. We examine the use of this complete standard model in the GLA system currently under development for use in two EU H2020 SG projects.
Keywords—game analytics; serious games; e-learning; dashboard; xAPI
I. INTRODUCTION
The success of games for entertainment purposes, especially among younger generations, has made them of interest for researchers in different fields such as mathematics, physics, engineering, medicine, economics, history or literature [1]-[2]-[3]-[4]. In the field of education, their engaging and goal-oriented nature encourages students to outdo themselves while learning key concepts derived from educational plans.
Educational games, also known as Serious Games (SGs) are video games designed not only for pure entertainment; their main purpose may be to teach, to change an attitude or behavior or to create awareness of a certain issue. Throughout the years, many serious games have had great success in achieving their different educational purposes (e.g. teaching Mathematics,
English, social abilities or change an attitude towards certain problems). For instance, the serious game Darfur is Dying was launched in April of 2006 to help to shed a light on the ongoing war in the Darfur region of Sudan at that time and the humanitarian disaster derived from it for 2.5 million refugees. Despite the uncertainty on the consequences it may have brought to the actual crisis, the game attracted 800.000 players in only 6 months [5]. Foldit is an online puzzle serious game on protein folding that helped decipher the crystal structure of the M-PMV retroviral protease, of importance to antiretroviral drug development. With the help of thousands of players competing against each other, an accurate model of the enzyme was found in only 10 days, while the answer had troubled medical science for the preceding 15 years [6]. The adventure serious game Aislados, which aims to teach abilities that help to prevent drug addiction, sexist behavior and other risk behaviors among teenagers, has received several awards for its help in attitude change [7].Treefrog Treasure is a platformer serious game to teach players fractions, rational numbers and percentages. While collecting in-game jewels, players control the frog's jumps through barriers that contain mathematical questions, teaching players the placement of fractions and rational numbers on the number-line that the barrier represents. When players make a mistake, hints are provided to help them to find the correct answer [8].
When applying games in education, providing access to information on the interactions of students with the game is not only desirable, but essential. Proving their validity and effectiveness is integral to their educational purpose and to provide the means to evaluate the knowledge obtained by the students through their game-play [9].
A common method to formally evaluate SGs consists of carrying out a test with the students before and after playing the game, and comparing the results through statistical analysis [10]. This pre-post method is both expensive and time consuming, and provides very limited information regarding the student’s learning process. As a consequence, very few games have been formally proved to be effective. Basic information from students has also been collected with learning management systems (LMS) providing a brief insight into student actions [9] but still failing to explain how students learn.
However, as games are highly interactive digital content, a different approach can be used. In e-learning, it is common to
use Learning Analytics (LA) to capture interaction data with the purpose of better understanding or improving the learning process. LA can be defined as “the measurement, collection, analysis and reporting of data about learners and their contexts, for purposes of understanding and optimizing learning and the environments in which it occurs” [11]-[12]. To apply this to serious games, interaction data can be captured by adding a tracker to the SG that sends player interaction data (also referred to as traces) to a server. Analysis of the traces can yield actionable information regarding the students’ interactions with the game, making the set of actions, mistakes and correct actions of the player meaningful [13].
Without analytics, SGs in education are akin to black boxes: they merely provide a final state that shows the students’ gameplay results, usually in the form of simple metrics such as the player’s final score; but that does not provide information regarding the learning process. Opening the box can provide much more information on the use of SGs and how their players interact with them. For instance, through aggregation of data, game developers can determine which game areas present greater challenges for players, which ones are easier and which ones can be improved, either due to excessive complexity, because they suffer from some design problem or because players do not understand what they are expected to do. Eventually, if the game is well designed and the relevant interaction data is captured, it should be possible to trace the evolution of each player’s knowledge at every part of the game, and identify any areas where they struggle or shine.
II. GAME LEARNING ANALYTICS
To obtain the desired information from games, we propose the following complete, scalable, standards-based analytics architecture. We describe the architecture in greater detail in following sections.
A. Educational scenarios
Within this architecture, games send traces to a server that analyzes the data and transforms it into useful information which is then displayed and explored by stakeholders: the teacher or instructor in charge of players, the players themselves, the game
developer or designer, and the researchers. This information can be used in multiple ways:
x At run-time by the game itself, which can then adapt its characteristics on the fly, providing a personalized, adaptive experience.
x At run-time by teachers and instructors, which can use it to locate students that are experiencing problems and help these students out.
x After a game session, to understand how the game was played and measure student knowledge acquisition, allowing the game to be revised and improved for future players; and providing valuable feedback to players regarding the session.
x After a game session, to evaluate students based on their performance. Note that this is the only use-case where pre-test / post-test evaluation would also work. B. Learning analytics and Game analytics
One of the main problems of LA is the lack of widely adopted standards to communicate trace information between games and their tracking modules, due to the ad-hoc nature of different data analysis solutions. As a result, each SG ends up being tied to its own LA solution; whenever the game is updated, game-specific tracking, analysis and visualization assets must be updated in the LA, increasing development costs. As long as such tight coupling between game and analytics is required, LA for SGs – Game Learning Analytics (GLA) – will continue to be rarely used.
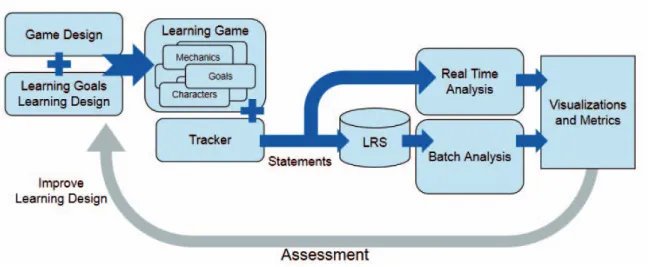
Figure 1 shows an abstract overview of a GLA system. The game engine sends data to a collector via its tracking component. The data collected is then aggregated and analyzed, with the results used to feed reports (either in real-time or for later use). This information may also have other purposes, such as supporting assessment. Finally, an (optional) adapter sends instructions derived from that information back to the game [9].
Apart from the educational goals of LA, GLA also feeds off the tools and technologies from Game Analytics (GA). For many years, the industry of entertainment videogames has used GA
Figure 1. Game Learning Analytics (GLA) conceptual architecture model. The game sends data to a collector for its aggregation. The information obtained is used to feed reports, visualizations, evaluate students and, through the adapter, to turn into instructions that go back to the game. [9]
extensively to obtain information from their players, also collected through non-disruptive tracking tools embedded in the games [14]. The key difference between GA and LA and GLA is GA’s exclusive focus on the game itself. In traditional GA, analytics are only intended for game-developers or, at the very most, to obtain financial information (in the case of games with built-in transactions). Furthermore, traditional GA has no concept of tracking learning, and cannot accommodate teachers that want to explore what players have learnt and, possibly, share results with other teachers for comparison or research purposes. C. Systematizing Game Learning Analytics
The process of GLA for serious games still suffers from lack of widespread standards. In this paper, we describe two key steps towards the systematization of GLA, and examine their use in the GLA system currently under development for use in two EU H2020 SG projects. The two key contributions are:
x The use of a newly-proposed standard to exchange SG traces between the game and the analytics platform. This allows standard, reusable tracker components to be developed for each game engine or development platform, communicating via this standard with the server-based analytics platform. Furthermore, this allows traces to be shared and analyzed by any tool that can handle this upcoming standard, instead of being limited to the analytics system where they were first captured.
x The use of standardized, modular analysis and visualization assets, which can be customized and adapted for particular games if needed, but that already provide useful information out-of-the-box for any SG that sends its data in the aforementioned format. Combining both steps together, we can provide a complete GLA system to be applied to any SG, as long as this SG makes use of a compliant tracking component as described in the following section. Without further requirements or configuration, the proposed system can generate meaningful dashboards for different stakeholders (e.g. developers, teachers).
III. DATA TRACKING
To systematize the tracking step, we use a general tracking model together with its implementation using the Experience API standard. The tracking model was defined after an analysis of the current state of data standards and serious games, in addition to previous experiences applying e-learning standards to serious games [15]-[16]. The resulting interaction model is described in [17]-[18].
A. Experience API (xAPI)
The Experience API (xAPI) is a data format developed by the Advanced Distributed Learning Initiative (ADL) Initiative [19] together with an open community. The xAPI standard derives from Activity Streams, a format that can be used to describe streams composed of actors performing with actions in a specific context. In this sense, each xAPI statement represents a learning activity and has three main attributes: an actor, a verb and an object:who did what action, with a target of the action and certain additional attributes (for example, to provide more
context or describe the results of the action), as shown in Figure 2.
The interaction model makes use of concepts such as completables (tasks, quests or mini-games with a beginning and an end),alternatives and general variables to track interactions in the specific domain of SGs. Custom interactions may also be defined to provide further information in a specific SG. The interactions, events and targets are mapped by the tracker library into their corresponding xAPI statement attributes, verbs and activity types respectively. This interaction model and its implementation in the xAPI standard provide a general, game-independent trace format that can model most, and frequently all, the interactions that a player makes with a SG.
We validated the tracking model with a serious game developed specifically for this purpose: the geography Q&A game Countrix [20]. The game consists of a series of multiple-choice questions (capital, country, continent or flag). Each correct answer increases the score, while each wrong answer decreases the remaining time to play; the game can display the xAPI statements generated either during game-play or when the player runs out of time.
B. Key performance indicators
Obtaining useful information from gameplays may require dealing with large amounts of data, sent by connected clients at high rates. For example, a game that sends many traces and is being played simultaneously by many students could easily overload a naïve collector implementation. However, scalability by itself is not enough: trace data must be analyzed to be useful for stakeholders, and there is considerable value in performing the analysis while the game is being played, instead of only once the session finished. For example, near real-time data allows teachers to perform interventions on students that are still playing, and, should the game contain adaptive mechanics, allows the game to adapt itself to the player’s actions.
Not all classical gamification metrics are suitable or useful for learning and training. For instance, it is common to compare a student’s results with the average of the class. Although this metric may provide an idea of how well the student is doing in the course, it could also discourage those students whose score falls below the class average. Speed, in terms of actions per time unit, is another commonly measured metric in entertainment games that may lead students to rush, being negatively
Figure 2. An example xAPI statement representing the learning activity “John Doe (actor) initialized (verb) the activity serious game Countrix (object)”.
correlated with performance [13]. To provide suitable metrics, educators using our system can provide quantifiable outcomes as key performance indicators (KPIs) to be measured in the analytics. KPIs are used to measure players’ performance denoting their level of success, usually through a quantitative indicator. Examples of KPIs may be the number of errors made or the percentage of game completion.
C. Issues when collecting data
All xAPI statements generated by the game will be collected in a Learning Record Store (LRS). The LRS concept derives from the e-learning domain as a database system to store statements in sequential order [21]. Supporting xAPI input and output, an LRS typically allows authenticated and authorized users to save and query traces.
Collecting data from players’ interactions requires awareness of applicable personal privacy laws and regulations. This issue becomes particularly important in domains such as education with underage students or when dealing with health-related data. An important part of complying with these laws cannot be performed from within a GLA tool: for example, players should be provided with informed-consent forms before collecting any data; and these forms should clearly state information such as the ownership of the collected data, how the data will be used, for which purposes, and who can use the data under which circumstances [9].
Anonymization is another key issue when collecting data. Personal information should either not be collected at all, or it should be anonymized immediately after collection [9]. Users of our GLA system are limited both as to the data they can access and the level of anonymization with which it is provided. Teachers have full access to data from their students; but game developers and researchers can only access anonymized and/or aggregated data.
Finally, when experiments produce interesting data, allowing it to be reused by researchers from different domains with different purposes can greatly increase its value. For example, the OpenAIRE2020 Project seeks to create an open infrastructure for research in Europe, sharing open data (i.e. data free to access, reuse, repurpose and redistribute) in open repositories to make it available for other researchers [22]. xAPI for SGs provides a good candidate for sharing SG-related activity data.
IV. DATA ANALYSIS AND VISUALIZATION
To systematize the analysis and visualization steps, there are two design goals to be met:
1) Given no knowledge of the game beyond the xAPI traces that it produces, which are assumed to comply with the xAPI SG recipe, we are interested in a default set of analyses and visualizations that provides as much insight as possible for zero customization cost.
2) Advanced users must be allowed to add game-specific information to create tailored dashboards and visualizations – while minimizing the amount of configuration, and allowing the resulting visualizations to be reused between SGs with similar requirements.
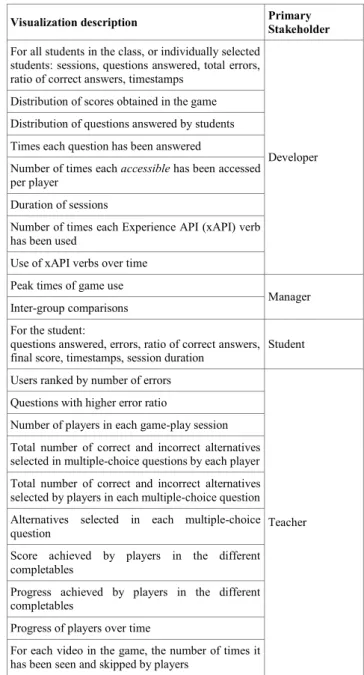
The analysis performed on the tracked data should focus on the suitable metrics and KPIs defined by educators, avoiding metrics that may confuse students or work against their learning process. Additionally, the default set of analysis of visualizations should also be adapted to the needs and interests of the different stakeholders involved in the process of GLA: teachers, students, game developers or designers, managers and researchers. With these considerations, we propose the set of default visualizations depicted in Table 1, each of which is geared towards a specific stakeholder and may require a specific underlying analysis. Note that certain visualizations may be of interest to multiple stakeholders; Table 1 only lists the primary stakeholder.
TABLE I. DEFAULT SET OF VISUALIZATIONS FOR STAKEHOLDERS
Visualization description Primary Stakeholder For all students in the class, or individually selected
students: sessions, questions answered, total errors, ratio of correct answers, timestamps
Developer Distribution of scores obtained in the game
Distribution of questions answered by students Times each question has been answered
Number of times each accessiblehas been accessed per player
Duration of sessions
Number of times each Experience API (xAPI) verb has been used
Use of xAPI verbs over time Peak times of game use
Manager Inter-group comparisons
For the student:
questions answered, errors, ratio of correct answers, final score, timestamps, session duration
Student Users ranked by number of errors
Teacher Questions with higher error ratio
Number of players in each game-play session Total number of correct and incorrect alternatives selected in multiple-choice questions by each player Total number of correct and incorrect alternatives selected by players in each multiple-choice question Alternatives selected in each multiple-choice question
Score achieved by players in the different completables
Progress achieved by players in the different completables
Progress of players over time
For each video in the game, the number of times it has been seen and skipped by players
Figure 4.Some of the default visualizations for developers: pie chart showing the number of times each accessible has been accessed per player; line chart showing the use of xAPI verbs over time; bar chart showing the number of times each xAPI verb has been used; and bar chart showing for each video the number of times it has seen and skipped by players.
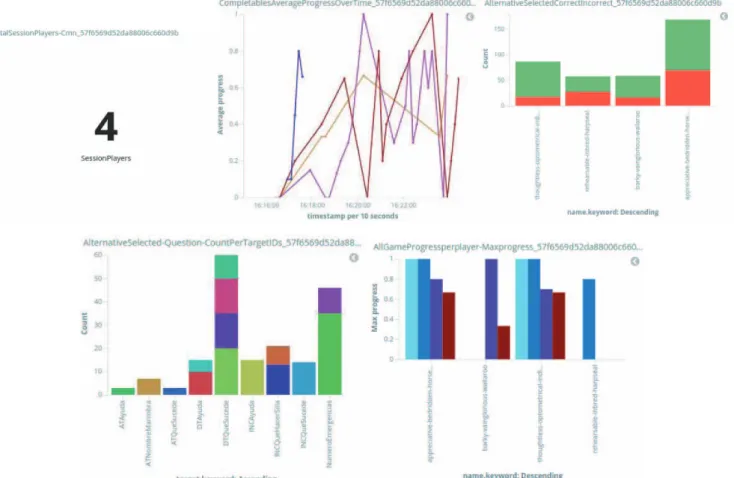
Figure 3.Default visualizations for teachers: number of sessions; line chart of progress of players per timeand bar charts showing correct and incorrect alternatives selected in multiple-choice questions, the alternatives selected and progress achieved in the different completables of the game.
A. Analysis and visualization tools
The information obtained from the analysis is stored in Elasticsearch [23], which can analyze and search a vast amount of data in near real time (with delays measured in few seconds). The visualization dashboards have been developed with Kibana [24], an open source platform that provides a flexible browser-based interface to quickly develop analysis and visualizations. Once created, these dashboards can change dynamically to display updated results as they become available. Our GLA system currently supports all visualizations listed in Table 1.
Figure 3 displays some of the default visualizations for teachers, including total number of sessions registered, progress of players per time; correct and incorrect alternatives selected and progress achieved in multiple-choice questions.
Figure 4 shows some of the relevant information for developers including number of times each accessible has been accessed and use of xAPI verbs over time.
B. Personalization of analysis and visualizations
To allow these analyses and visualizations to be configurable and reusable, we have developed a simple wizard-based tool that allows users to first choose the desired visualization templates, and later connect these templates to the chosen analysis outputs.
For teachers, these dashboards provide both overviews and details of students’ interactions with the game. In particular, teachers can easily switch between individual student view and whole-class view. Many of the whole-class visualizations have direct interpretations in terms of educational interventions. For example, from a visualization showing the number of errors made by students in multiple-choice questions, teachers can quickly zero in on those with higher error ratio for review with their students.
C. Alerts and warnings
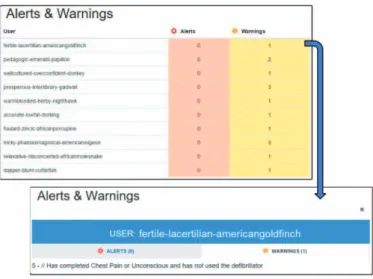
Since analyses are near real time, we have included the possibility of configuring alerts and warnings, mostly intended for teachers that may be present during a SG session. A warning is a message displayed when a certain condition is satisfied (for example, “a student has been inactive for two minutes”); alerts are similar to warnings, but are intended for situations that require immediate action from the teacher, such as “a student has answered a very important question wrong”. During a session, users with outstanding alerts and warnings are marked with icons. When clicking on any user, the full descriptions of any applicable alerts and warnings will be displayed (see Figure 5). We have only identified a single generic alert (“a student has been inactive for 2 minutes”) for default inclusion. In general, unlike visualizations, alerts and warnings are highly game-specific.
D. Data exploitation
The information obtained through the visualizations can be used for several purposes:
x Students’ assessment: analyzing the statements obtained from the students’ gameplay, teachers can evaluate students. From the learning plan, educational goals will become tasks or levels that students need to
complete to pass a certain topic in the course evaluation. Scores could indicate a mark for students. x Personalized and adaptive gameplays: if correctly
tracked and analyzed in near real-time, the collected data could be used to personalize the gameplay while students are still playing. Through that adaptive learning experience, students could benefit from the interaction with the game.
x Serious games’ improvement: the results will also provide an insight into the serious game’s accuracy and suitability. Game bugs or errors, unreachable areas, places with lack of information or difficult to understand and tasks too difficult for students are some of the information obtained from analyzing statements.
V. GLA ARCHITECTURE
Providing a full GLA system requires handling multiple tasks, from data acquisition via tracking to collection, data analysis, and result visualization. A diagram of the proposed GLA architecture, which comprises several modules that work together to analyze data and visualize results, can be found in Figure 6.
x The game design, learning goals and learning design determine the design and implementation of the game (its mechanics, goals and characters). Both the learning and game design are essential as they determine the elements (usually variables) that will appear in the game design containing educational information. Those elements are the ones that should be tracked, as Figure 5.Alerts (messages that appear when a certain condition is satisfied and required immediate action from the teacher) and warnings (also result from a true condition but do not require immediate action) can be configured in the architecture so teachers can receive those notifications in the real-time view. For each user, the number of alerts and warnings satisfied as a result of the user’s gameplay appear. User-specific information can be obtained by clicking on a single user, including the alerts or warnings’ descriptions that user’s gameplay has given rise to.
they can reveal whether players are actually learning or not.
x The game uses a generic Tracker component to send the standardized xAPI statements. The tracker components are available in Unity, Java and C#, for their easy integration with different serious games.
x After passing through an authorization and authentication module, the statements are saved into a Learning Record Store (LRS) that supports xAPI format, and also submitted to a real-time analysis component which calculates an updated state-of-game for each player. Should a different analysis be desired, the LRS can be used to replay the relevant statements; this is labeled as “batch analysis”.
x Finally, the data is displayed in suitable dashboards comprising all relevant metrics for use by the relevant stakeholders. Personalized dashboards as well as configured alerts and warnings are also displayed.
x The process ends when the information obtained is reintroduced as improvements in the game learning design or as personalized and adaptive gameplays for students. Finally, the information may also help in the students’ assessment process.
All components have been developed as open source and are available online1.
VI. CONCLUSIONS AND FUTURE WORK
Game Learning Analytics (GLA) for serious games is no longer an emerging field; however, it is still performed mostly through ad-hoc analysis, and can greatly benefit from a more systematic, standardized approach. Doing so would make GLA
1eUCM Research Group, RAGE Analytics, (2016). https://github.com/e-ucm/rage-analytics
easier to apply to new serious games, greatly reducing the costs of building ad-hoc tools, and helping to drive teacher adoption of serious games. Teacher involvement requires GLA systems that provide value out of the box, and with minimal configuration; while still allowing advanced users to customize and tailor their analytics to specific requirements. We have proposed two important steps to achieve this systematization: First, the use of a an Experience API (xAPI) recipe specific for serious games to allow standardized trace collection and enable sharing; and second, a set of visualizations that we consider to be useful for a wide variety of possible SGs. We have also described the architecture of a system that uses both of these steps. This system is available as open software, and we plan to extend and validate it in multiple educational scenarios during the following months, as part of two EU H2020 SG-related projects.
Currently, creating a template requires using Kibana’s built -in visualization author-ing environment; but we are develop-ing a wrapper around this that should make the process simpler for non-programmers. We are also currently working on the integration of the GLA architecture with LTI (Learning Tools Interoperability) [25] and SAML2 (Security Assertion Markup Language v 2.0) [26] to manage authentication. These would greatly decrease the amount of configuration needed to register students and teachers for large-scale deployments in educational institutions that already rely on one of these technologies.
ACKNOWLEDGMENT
This work has been partially funded by Regional Government of Madrid (eMadrid S2013/ICE-2715), by the Ministry of Education (TIN2013-46149-C2-1-R) and by the European Commission (RAGE H2020-ICT-2014-1-644187, BEACONING H2020-ICT-2015-687676).
Figure 6.Overview of Game Learning Analytics (GLA): from learning goals, learning design and game design; the tracker embedded in the game sends Experience API (xAPI) statements to a Learning Record Store (LRS) for batch analysis, and directly to the real-time analysis. Some visualizations and
REFERENCES
[1] M.J. Mayo, Video Games: A Route to Large-Scale STEM Education?, Science (80-. ). 323 (2009) 79–82.
doi:10.1126/science.1166900.
[2] B.M. Iglesias, C. Fernandez-Vara, B. Fernandez-Manjon, E-Learning Takes the Stage: From La Dama Boba to a Serious Game, IEEE Rev. Iberoam. Tecnol. Del Aprendiz. 8 (2013) 197–204. doi:10.1109/RITA.2013.2285023.
[3] K.H. Evans, W. Daines, J. Tsui, M. Strehlow, P. Maggio, L. Shieh, Septris: a novel, mobile, online, simulation game that improves sepsis recognition and management., Acad. Med. 90 (2015) 180–4. [4] K. Squire, M. Barnett, J.M. Grant, T. Higginbotham,
Electromagnetism supercharged!:learning physics with digital simulation games, Int. Conf. Learn. Sci. (2004) 513–520. [5] L. interFUEL, Darfur is Dying, (2006).
http://www.gamesforchange.org/play/darfur-is-dying/. [6] Center for Game Science at University of Washington in
collaboration with UW Department of Biochemistry., Foldit: Solve Puzzles for Science, (2008). http://fold.it/portal/ (accessed November 4, 2016).
[7] Asociación Servicio Interdisciplinar de Atención a las Drogodependencias (SIAD), Aislados, (2014).
http://www.aislados.es/zona-educadores/ (accessed November 13, 2016).
[8] Center for Game Science at the University of Washington, Treefrog Treasure, (2016).
http://centerforgamescience.org/blog/portfolio/treefrog-treasure/ (accessed November 15, 2016).
[9] M. Freire, Á. Serrano-Laguna, B.M. Iglesias, I. Martínez-Ortiz, P. Moreno-Ger, B. Fernández-Manjón, Game Learning Analytics: Learning Analytics for Serious Games, in: Learn. Des. Technol., Springer International Publishing, Cham, 2016: pp. 1–29. doi:10.1007/978-3-319-17727-4_21-1.
[10] A.C. and M. Ruiz, A systematic literature review on serious games evaluation: An application to software project management, Comput. Educ. 87 (2015) 396–422.
[11] G. Long, P., & Siemens, Penetrating the Fog: Analytics in Learning and Education, Educ. Rev. (2011) 31–40.
[12] G. Siemens, G., Dawson, S., & Lynch, Improving the Quality and Productivity of the Higher Education Sector. Policy and Strategy for Systems-Level Deployment of Learning Analytics., (2013). [13] C.S. Loh, Y. Sheng, D. Ifenthaler, Serious Games Analytics,
Springer International Publishing, Cham, 2015. doi:10.1007/978-3-319-05834-4.
[14] S.S. and M. Vaden, Telemetry and Analytics Best Practices and Lessons Learned, Game Anal. Maximizing Value Play. Data. (2013) 85–109.
[15] A. Serrano, E.J. Marchiori, A. del Blanco, J. Torrente, B. Fernandez-Manjon, A framework to improve evaluation in educational games, in: Proc. 2012 IEEE Glob. Eng. Educ. Conf., IEEE, 2012: pp. 1–8. doi:10.1109/EDUCON.2012.6201154. [16] Á. del Blanco, E.J. Marchiori, J. Torrente, I. Martínez-Ortiz, B.
Fernández-Manjón, Using e-learning standards in educational video games, Comput. Stand. Interfaces. 36 (2013) 178–187.
doi:10.1016/j.csi.2013.06.002.
[17] Á. Serrano-Laguna, I. Martínez-Ortiz, J. Haag, D. Regan, A. Johnson, B. Fernández-Manjón, Applying standards to systematize
learning analytics in serious games, Comput. Stand. Interfaces. (2017) 116–123. doi:http://dx.doi.org/10.1016/j.csi.2016.09.014. [18] eUCM Research Group, xAPI Serious Games Profile, (2016).
http://w3id.org/xapi/seriousgames (accessed October 27, 2016). [19] ADL Initiative, xAPI Specification, 2014. (2016).
https://github.com/adlnet/xAPI-Spec/blob/a752217060b83a2e15dfab69f8c257cd86a888e6/xAPI.md (accessed October 27, 2016).
[20] eUCM Research Group, Countrix Serious Game, (2016). https://github.com/e-ucm/countrix (accessed October 27, 2016). [21] Scorm, what is an lrs learning record store, (2016).
http://scorm.com/tincanoverview/what-is-an-lrs-learning-record-store/ (accessed November 4, 2016).
[22] H2020 Programme Guidelines on Open Access to Scientific Publications and Research Data in Horizon 2020, (2016). http://ec.europa.eu/research/participants/data/ref/h2020/grants_man ual/hi/oa_pilot/h2020-hi-oa-pilot-guide_en.pdf (accessed October 31, 2016).
[23] Elastic, Elasticsearch, (n.d.).
https://www.elastic.co/products/elasticsearch (accessed March 20, 2016).
[24] Elastic, Kibana, (n.d.). https://www.elastic.co/products/kibana (accessed March 18, 2016).
[25] IMS Global Learning Consortium, Learning Tools Interoperability, (2016). https://www.imsglobal.org/activity/learning-tools-interoperability (accessed November 13, 2016).
[26] OASIS, Security Assertion Markup Language (SAML), (2005).
https://www.oasis-open.org/committees/tc_home.php?wg_abbrev=security (accessed November 13, 2016).