11th International Conference on Hydroinformatics HIC 2014, New York City, USA
A WEATHER MONITORING SYSTEM FOR THE STUDY OF
PRECIPITATION FIELDS, WEATHER, AND CLIMATE IN AN URBAN
AREA
F. LO CONTI (1), D. PUMO (1), A. INCONTRERA (1), A. FRANCIPANE (1), L.V. NOTO (1), G. LA LOGGIA (1)
(1): Dipartimento di Ingegneria Civile, Ambientale, Aerospaziale, dei Materiali, Università degli Studi di Palermo, Viale delle Scienze, Palermo, Italy
The possibility to study the precipitation dynamics with advanced and specific tools is an important task of the research activity addressing the understanding, the modeling, and the managing of rainfall events. Over the last years, the hydrology laboratory of the Department of Civil, Environmental, Aerospace Engineering, and Materials (DICAM) at the University of Palermo, has installed several instruments for the monitoring and the study of precipitation within the urban area of Palermo (Italy).
The main instrument of this system is the X-band weather radar, which allows monitoring the precipitation fields with high resolution in space and time. This instrument is supported by a rain gauges network of 18 tipping bucket gauges spread over the observed area, a weight rain gauge, an optical disdrometer, and a weather station. The information provided by different devices can be combined in order to integrate different data and correct errors.
In particular, the disdrometer is able to provide the drop size distribution (DSD) that is directly linked to the parameters used to transform radar reflectivity to precipitation estimates. Moreover, disdrometer observations can be used to classify the precipitation events. The rain gauges network data is used to apply a ground correction to the radar precipitation maps. Such an operation is useful to constrain the radar estimate to the observed ground precipitation value. Results obtained from a prototypal version of the system, that considers only the main applications designed, are discussed for a study event.
Finally, all of the above instruments are embedded in an integrated early warning system able to provide warnings related to possible flood in the urban area of Palermo.
THE WEATHER MONITORING SYSTEM
Monitoring precipitation is a crucial prerequisite for the management of the weather component particularly in a climatic scenario that is affected by changes regarding both the quantities and the spatio-temporal distribution of precipitation. Accurate measurements of rainfall events are required for a variety of applications that range from the hydro-geological risk management to the design of emergency plans, from the hydroelectric power infrastructures to the tourism.
Relevant progresses on measuring precipitation have been achieved in the last decades as advanced and precise instruments became accessible for operative purposes. One of these tools
is represented by short-range X-band mini radars that introduce the possibility of monitoring rain events with high resolution in space and time in a local area. In recent years, this kind of technology is strongly expanding mainly due to the relatively low costs, the lack of any special requirements for installation and the possibility to be remotely controlled.
Weather radar systems have been largely adopted for the precipitation monitoring because of their potentialities related to the possibility of retrieving the spatio-temporal depiction of weather events. Moreover, methods and procedures for dealing with typical issues regarding estimate error and uncertainties have been developed (Strangeways [1], Zawadzki [2]).
The use of radar to estimate rainfall in the hydrology field has had a constant development mainly due to the demand for a more comprehensive understanding of the hydrological systems in the context of some emerging environmental and climatological issues (Delrieu et al. [3]) such as the development of increasingly detailed hydrological models for applications in the landslide risk management, the study of climate change effects, the land use management or other applications in agriculture, flash flood and energy power plants.
The main objective of the present work is to show how the information derived from different instruments can be efficaciously coupled and integrated in a modern rainfall monitoring system. In particular, it is here presented a prototypal rainfall monitoring system supporting an Early Warning System for Rainfall Triggered Landslides (RTL-EWS), developed and realized within the Italian National Research Project SESAMO (SistEma informativo integrato per l’acquisizione, geStione e condivisione di dati AMbientali per il supportO alle decisioni - Integrated Information System for the acquisition, management and sharing of environmental data aimed to decision making).
The system, developed by the Department of Civil, Environmental, Aerospace Engineering, and Materials (DICAM) of the University of Palermo, is composed by a X-band weather radar, a tipping-bucket rain gauges network, a weight rain gauge, an optical disdrometer and a weather station. The monitoring area is represented in Figure 1 and covers a rather wide territory (i.e., ~700 km2) within the urban area of Palermo (Italy). The real-time monitoring system supports providing rainfall measurements that are, eventually, used as input variable to force a hydrological-slope stability model and compute the hillslope stability for a hot-spot localized within the monitoring area.
The system warrants an accurate, high resolution and large coverage, reconstruction of rainfall occurring within the monitored area. More specifically, the X-band mini radar provides the overall rainfall spatial distribution that is calibrated using the disdrometer and is used to create precipitation maps that are subjected to a quantitative adjustment based on the rain gauges network data.
In this brief article, the entire monitoring system and its potentiality are presented, describing the manner by which different data are integrated and showing some examples of measured rainfall events.
Figure 1. The weather monitoring system of the urban area of Palermo (Italy).
MATERIALS AND METHODS X-Band Radar
The weather radar here used (Figure 2a) is a X-Band mini radar developed by EnviSens Technologies, operating at 9.41±30 GHz with a peak power of 10 kW. The maximum range of the instrument is set to 30 km and it has been installed in the eastern mountains overlooking the urban area of Palermo (Sicily, 38°02’N-13°27’E). A robust procedure that operates the correction for ground clutter values is also provided by the same EnviSens Technologies and it is operationally applied to radar images. The X-band radar is able to produce an image map each 1 minute with a “virtual” resolution of 60 m. The produced radar maps are transmitted, via GPRS, to a central server, where they are opportunely processed.
Figure 2. X-Band Radar (a); Weighing Rain Gauge (b); Disdrometer (c); Weather Station (d).
Ground Instruments Network
The original rain gauges network was made by nine ISCO 674 tipping-bucket rain gauges, each one coupled with a data logger to store data. Rainfall, collected with a resolution of 0.1 mm, is first transferred, via GSM, to an ISCO Flowlink® (v. 4.7) database, and then transferred, via FTP (File Transfer Protocol), to the central server. The network has been successively updated,
within the already mentioned project SESAMO, with nine more tipping-bucket rain gauges of TECNO PENTA M1 PLUV 1000 series. Also the new instruments collect rainfall with a resolution of 0.1 mm and transfer data via GPRS to the central server.
In addition to the network of tipping-bucket rain gauges, the calibration of radar measurements is performed through two benchmark instruments, that have been installed within the study area (38° 6'18.48"N, 13°20'52.80"E): a weighing rain gauge (Pluvio2 200, OTT) and a disdrometer (Parsivel2, OTT) shown in Figure 2b and Figure 2c, respectively. Finally, a weather station (Figure 2d) is available with sensor for the measurement of air temperature, relative humidity, air pressure, global solar radiation, wind direction and wind speed.
System for precipitation maps correction
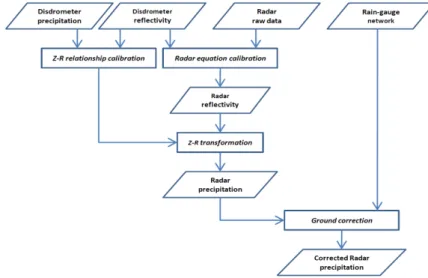
In order to build a reliable and accurate system for the weather monitoring, weather sensors data have been exploited by means of different operational modules. The general structure of the system is provided in Figure 3 where the input data measurements obtained by instruments, the application modules and their outputs are represented and linked in a functional scheme.
The radar raw data and the disdrometer reflectivity are first combined in order to calibrate the radar equation. Therefore, the radar reflectivity is converted into precipitation intensity using the Z-R relationship previously calibrated based on the disdrometer DSD. Finally, the radar estimates are constrained to ground measurement with a correction procedure based on rain gauges measurements.
The system considered in this study is a first prototypal version. The system does not consider some refinement applications such as those related to the possibility of controlling and calibrating the tipping-bucket rain gauges by means of the weighing rain gauge, or the characterization of rainfall events using the weather station data.
Radar Equation Calibration
Radar data are preliminarily corrected for ground clutter and partial beam interceptions by means of an algorithm based on clear sky conditions developed by EnviSens Technologies and distributed with the device (Allegretti et al. [4]).
Conversion of radar measurements into radar reflectivity estimate is based on the meteorological radar equation that can be expressed in the logarithmic form, and associating physical and technical constants, by the following equation:
P
r[dBm]= Z
dBZ−
20
⋅
log
10r
[km]−
const.
(1)
where Pr[dBm] is the power received by the radar, r is the radar-target range, Z is the radar
reflectivity factor, and const. is a constant resuming physical and device losses. A theoretical value for const., based on standard parameters, is provided by developers and is equal to 91.4. The operative functioning of the radar can be affected by power losses not considered in a standard formulation of the radar equation. Such losses can be modeled as the real value of const. variable, that is estimating its value during the instrument operation. In order to perform the estimate of this variable, a calibration procedure has been developed based on the comparison between the disdrometer radar reflectivity factor and the corresponding radar estimate for the disdrometer site. The radar equation calibration has been carried out, for a reference event, computing the RMSE (Root Mean Square Error) value between the radar reflectivity measured by disdrometer and that obtained from Eq. (1) for values of const. ranging from 90 to 100. The value obtained is equal to 96.4.
The Z-R Relationship Calibration
Relationship between radar reflectivity and rainfall intensity is physically based on the DSD of precipitation (Niu et al. [5]). In particular, the theoretical value of reflectivity, Z, and the rainfall intensity, R, can be obtained by means of Eq. (2) and Eq. (3), respectively:
(
)
∫
∞ = 0 6 dD D D N Z(2)
(
) (
)
∫
∞ = 0 3 dD D D v D N R(3)
where N(D) is the number of raindrops with diameter class D for a reference unit volume (mm-1 m-3), v(D) is the raindrop velocity (m s-1), and D is the equivalent spherical diameter (mm).
The Z-R relationship is usually modeled with a synthetic function denoted as Z-R equation. A simple and efficient form for this equation is the Marshall and Palmer equation (hereafter MP equation):
b
R
a
Z
=
⋅
.
(4)
Parameters a and b of this equation can be derived from the literature, where the characterization of their values can be found accordingly with the weather event typology (e.g.,
Joss and Waldvogel [6] [7]). As the disdrometer provides direct measurements of Z and R based on the DSD, an appropriate calibration module has been designed for the parameters calibration of the Z-R equation. Performance of estimated parameters set has been calculated in terms of RMSE between the direct disdrometer R values and R estimated by Eq. (3) and (4), respectively. Values obtained for different continuous ranges of a and b are displayed in Figure 4, where the RMSE surface is plotted with regard to the MP equation parameters. The final estimated couple of parameters, corresponding to the minimum RMSE value, is also highlighted. Such values (a=204, b=1.75) are close to standard values often adopted for this relationship (e.g., a=200, b=1.6). Further insights about the relationship between the radar reflectivity and the precipitation intensity can be derived applying the MP parameters calibration for a set of events and characterizing the obtained values with the events features, e.g. intensity and spatio-temporal characteristics. Since only a prototypal version of the system is here presented, such analysis has not been presented in this study.
Ground Correction
Since ground rain-gauge measurements are usually considered as reference values for quantitative applications, achieving the congruence between radar estimates and rain gauges measurements is assumed as a target for the precipitation monitoring system. The ground correction algorithm adopted for this system is the spatial gauge-radar adjustment technique proposed by Koistinen and Puhakka [8]. This method is based on the estimate of a multiplicative correction map given by two components: a regression radial corrective field and a local residual component weighted with distances between pixel radar value and available rain gauges.
RESULTS
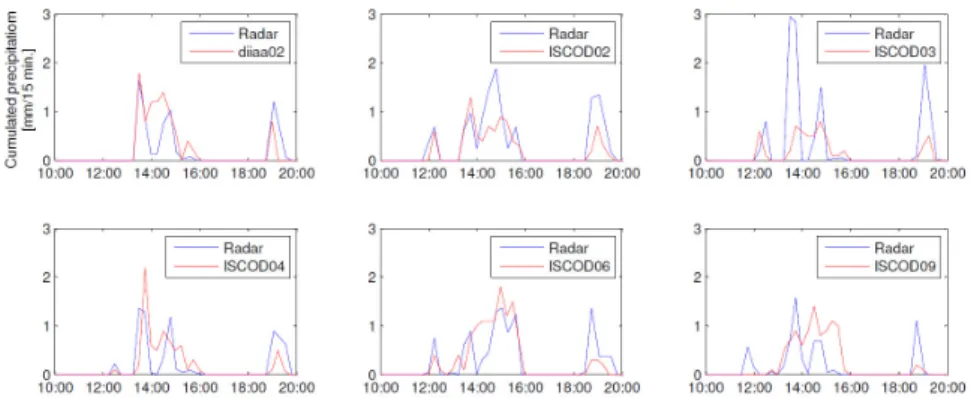
A comparison for a reference event between rain gauges and radar estimates is reported in Figure 5 considering a 15-minutes cumulated precipitation. Datasets show a good level of agreement for most rain gauges both in terms of mean values and correlation. Some inconsistencies can be related to different factors such as the different nature of the physical variable measured by rain gauges and radar, the different elevation where the measurement is performed (whose effect could be exacerbated by the presence of wind), issues related to the not perfect coincidence between the rain gauge and the corresponding radar-pixel value, etc.
As previously described, a higher level of congruence between ground measurements and the spatial distribution provided by radar, is pursued with a specific correction module. In Figure 6, an example of the application of the ground correction procedure above described is reported with regard to a reference event and considering a 15-minute accumulated map. From the observation of original and corrected radar maps, it can be noticed that the procedure succeeds on applying a bias correction to the entire map and modifying some spatial features according to rain gauges values.
Figure 5. Comparison between rain gauges cumulated 15-minute measurements and corresponding radar estimate related to 02/March/2014 events.
CONCLUSIONS
In this study a precipitation monitoring system developed for the urban area of Palermo (Italy) has been described along with first results of an ensemble of applications developed for the joint use of different sensors. The simple radar equation and Z-R calibrations are useful for the estimate of parameters that achieve the retrieval of the best radar estimate, while the ground correction procedure is able to improve the congruence between such estimate and the rain gauges network measurements.
Such a result represents an early prototypal application of the procedure, since, in order to obtain more robust parameters accounting for the effects of rainfall events features on the Z-R equation, the application for a selected set of events will be also required. Moreover, a further module will be introduced for the comparison of weighing gauge and tipping-bucket rain gauges, in order to perform the calibration of the latter.
The role of the developed monitoring system within an EWS for RTL represents just one of the many other possible applications. Moreover, its relative low cost and simplicity, together with the high spatio-temporal resolution, represents a strategic strength for future technical and scientific developments.
REFERENCES
[1] Strangeways I., “Precipitation. Theory, Measurement and Distribution”. Cambridge University Press, Cambridge, (2007).
[2] Zawadzki I., “Factors affecting the precision of radar measurements of rain”. Preprints, 22d Conf. on Radar Meteorology, Zurich, Switzerland, Amer. Meteor. Soc., (1984), pp 251-256.
[3] Delrieu G., Braud I., Berne A., Borga M., Boudevillain B., Fabry F., Freer J., Gaume E., Nakakita E., Seed A., Tabary P. and Uijlenhoet R., “Preface special issue: Weather radar and hydrology”. Advances in Water Resources, 32, (2009), 969–974.
[4] Allegretti M., Bertoldo S., Prato A., Lucianaz C., Rorato O., Notarpietro R., Gabella M., “X-Band Mini Radar for Observing and Monitoring Rainfall Events”. Atmospheric and Climate Sciences, (2012), 2, 290-297.
[5] Niu S., Jia X., Sang J., Liu X., Lu C., Liu Y., “Distributions of Raindrop Sizes and Fall Velocities in a Semiarid Plateau Climate: Convective versus Stratiform Rains.” J. Appl. Meteor. Climatol., (2010), 49, 632–645.
[6] Joss, J., and Waldvogel A., “Raindrop size distribution and sampling size errors”. J. Atmos. Sci., (1969), 26, 566–569.
[7] Joss, J., and Waldvogel A., “A method to improve the accuracy of radar measured precipitation amounts of precipitation”. Preprints, 14th Radar Meteor. Conf., Tucson, (1970), AMS, 237-238.
[8] Koistinen, J., Puhakka, T., “An improved spatial gauge-radar adjustment technique”. Proc. 20th Conference on Radar Meteorology, AMS, (1981), 179-186.