HRRI Working Paper 01-04
An Integrated Model of Application, Admission, Enrollment, and Financial Aid
Stephen L. DesJardins Associate Professor
Center for the Study of Higher and Postsecondary Education University of Michigan
2108-D School of Education Building 610 E. University Ave. Ann Arbor, MI 48109-1259
FAX: (734) 764-2510 Dennis A. Ahlburg
Professor of Human Resources and Industrial Relations and Senior Associate Dean
Carlson School of Management University of Minnesota
321 19th Avenue S. Minneapolis, MN 55455
(612) 624-0260 Brian P. McCall
Professor of Human Resources and Industrial Relations Industrial Relations Center
University of Minnesota 321 19th Avenue S. Minneapolis, MN 55455
(612) 624-9521
Abstract
We jointly model the application, admission, financial aid determination, and enrollment decision process. We simulate how enrollment and application behavior change when important factors like financial aid are permitted to vary. An innovation is the investigation into the role of financial aid expectations and how they relate to application and enrollment behavior.
Introduction
Faced with budget cuts, institutions of higher education have increased tuition in an effort to shore up finances. In each of the last five years, tuition and fees at public universities increased at a rate double that of inflation, and they constitute a growing share of institutional budgets. For example, at the University of Iowa, the institution that is the focus of this study, tuition as a percentage of educational expenditures increased from 27 percent in 1981 to nearly 40 percent in 2003. In an effort to stem adverse impacts on enrollment, institutions are simultaneously increasing their use of tuition discounts. This strategy assumes that the institutions have fairly precise estimates of the impact of tuition and financial aid on enrollment and retention of students, and that they have the autonomy to make such policy changes. It also assumes that students are reacting to announced tuition rates (“sticker prices”) and to the financial aid package offered, rather than to discounted tuition or the sticker price less anticipated or expected financial aid.
Regarding the setting of tuition, it appears institutional autonomy is being threatened and that changes on the horizon may impact institutions’ ability to package financial aid to achieve their
educational mission. Various levels of government have either intervened or have threatened to intervene in the college price-setting market. Attracting the most attention is a proposal by Representative Howard P. (Buck) McKeon, a senior member of the powerful House Education and the Workforce Committee. Representative McKeon has proposed penalizing colleges that raise their tuition excessively by
preventing them from participating in some federal student aid programs. (Burd, 2003). McKeon states, “we can no longer stand idly by while our nation’s students, the future of our country, are being priced out of the promise of higher education” (Burd, 2003, p. A26). One of the implications of McKeon’s statement is that college access, retention, and graduation are sensitive to both tuition and financial aid, and that institutions are well informed about these relationships.
Our understanding of these complex relationships may, however, be deficient. For instance, the modeling strategies used in the past have been successful in improving our understanding of student
college-choice, but these approaches often assume the independence of the application, admission, and enrollment process. Many models designed to explain student access to college also assume that financial aid distribution is exogenous. It has long been known, however, that these assumptions may not be tenable. The modeling strategy employed below allows us to remedy some of the deficiencies of earlier research. We develop a structural model of student choice, whereby we simultaneously estimate
application, admission, and enrollment behavior, plus control for the non-random assignment of financial aid. This model not only permits us to estimate the enrollment effects of changes like those proposed by McKeon, but we can also investigate the impact that these changes have on applications to the institution.
Associated Literature Models of Student Choice
The student college-choice literature details that the college decision-making process involves three broad stages: predisposition, search, and the choice stage (Jackson, 1982; Hanson and Litten, 1982; Hossler and Gallagher, 1987; Hossler, Braxton, and Coopersmith, 1989). In the first stage college aspirations are formed and a myriad of factors and processes influence and shape a student’s
predisposition toward higher education. The formation of these aspirations may take place over a long period of time, from early childhood through high school and beyond. Although it certainly varies by individual, students typically develop the predisposition for college when they are in primary or secondary school (Hossler, Schmit, and Vesper, 1999). For instance, students undertake a number of preparations in anticipation of college attendance (e.g., taking college preparatory courses in high school) and they begin to interact with colleges to form predispositions toward college.
The search stage involves identification of and application to a select number of colleges. During this stage students acquire information from various sources (e.g., institutions, peers, parents) about colleges they are considering (Flint, 1992). During this stage students take entrance examinations (e.g.,
the SAT and ACT) that are required by some two-year and most four-year institutions. When they take these tests they can choose to have their scores sent to a number of colleges or universities, which typically comprises what is known as the student’s “choice set” (Weiler, 1994; Paulsen, 1990).1 The search stage ends when a student applies to one or more institutions.
The final phase, choice, involves admission, college enrollment, and actual attendance. During this stage institutions to which the student applied decide whether to admit the student, and conditional on admission, the student must then decide whether to accept their offer. During this stage individuals also need to decide whether to apply for financial aid to help defray the costs of attendance. Ultimately the student weighs their alternatives and chooses to enroll in one of the institutions included in their choice set.
Student college choice models predict student behavior in choosing a particular school as a function of students’ individual characteristics, perceptions, and preferences about the school (Fuller, Manski, and Wise, 1982; Welki, and Navratil, 1987). Over the past two decades numerous studies have examined the college choice behavior of undergraduate students at each stage of the college choice process (see, Kohn, Manski, and Mundel, 1976; Weiler, 1994). Several studies have reviewed the literature on student college choice (see, Manski and Wise, 1983; Hossler, 1984; Hossler, Braxton, and Coppersmith, 1989; Paulsen, 1990) and have found that the results vary greatly with respect to the data sources and models employed. Typical data sources include the information from internal and external sources. Internal data include the information provide by students on applications for admission and financial aid. External sources include the questionnaire information provide by students when they take the ACT or SAT test. These tests provide profiles and “preferences of high school graduates who took these exams” (Weiler, 1994). To date, most studies of college choice have focused on undergraduates, but several studies have also examined the college choice decisions of graduate students (Hearn, 1987; Kallio, 1995).
The results obtained from these studies suggest that the characteristics of students (e.g., race, gender, marital status, family income, parents’ educational attainment and occupational status, academic ability and achievement), institutional characteristics (e.g., tuition, financial aid, home location,
reputation, selectivity, special programs, and curriculum); and contextual factors (e.g., parental
encouragement, teacher encouragement, and peers’ plans) influence students’ application and enrollment decisions. Generally, these studies have found that as students’ family income, educational aspirations, academic ability, achievement, and parental education increase, students are more likely to choose high cost, highly selective, distant, private, and four-year institutions (Hossler, Braxton, and Coopersmith, 1989; Paulsen, 1990).
Student Costs and Pricing Research
There is another approach that has been used to study student college-going behavior. Student demand models explain enrollments as a function of measures characterizing the population of
prospective students and tend to focus on the role of tuition and costs of attendance (Radner and Miller, 1970; Jackson and Weathersby, 1975; Parker and Summers, 1993). These studies indicate that tuition, financial aid, and costs of attendance are related to enrollment, but that the size of the effect can vary substantially. A number of reasons have been proposed to account for the variation in the size of the estimated effects of tuition and financial aid. Among them are the heterogeneity of the samples upon which these studies are based and the estimation methods used. For instance, if students with different characteristics have varying responses to changes in tuition and/or financial aid, then the makeup of the student body will affect the size of the estimate. Studies have identified the race of the student
(Ehrenberg and Sherman 1984; Kane 1994; Heller, 1999; Light and Strayer, 2002; Tobias, 2002), income of the student’s family (Ehrenberg and Sherman 1984; Leslie and Brinkman 1987, 1988; St John 1990; McPherson and Schapiro, 1991; Heller, 1997; Dynarski, 2000; Van der Klaauw, 2002; Linsenmeirer,
Rosen, and Rouse, 2002; Dynarski, 2003), the education of one’s parents (Keane, 2002), college sector (Heller, 1999), and whether the student is in-state or out-of-state (Curs and Singell, 2002) as
characteristics that affect responsiveness. In addition, the effects of financial aid vary by the type of aid and when the aid is received (Seneca and Taussig, 1987; St John, 1990, 1992; DesJardins, Ahlburg, and McCall, 1999, 2002a, 2002b; Kane 2003) and may further differ by the race of the recipient (Jackson 1990; Linsenmeirer, Rosen, and Rouse, 2002).2
A methodological criticism of many studies that examine the effects of aid on enrollment is that they assume financial aid is exogenous. However, since financial aid packages are often tailored to the characteristics of applicants, this assumption may be untenable, and if it is, can lead to biased coefficient estimates. To remedy this problem a few researchers have modeled the financial aid package offered to each student (Curs and Singell 2002) or a number of recent studies have used discontinuities in financial aid (Van der Klaauw, 2002; Kane 2003) or “natural experiments” to identify aid effects (Dynarski, 2002; 2003).
Another reason for the variation in effect sizes found in these studies is the failure to fully account for the sequential nature of the process by which students eventually enroll in college. Fuller, Manski, and Wise (1982) noted the potential for selection bias that may arise when one assumes college application behavior, institutional admission decisions, and student high school performance are
statistically predetermined with respect to postsecondary choice.3 In all likelihood these decisions are correlated with the unobserved determinants of college choice, and if so then estimation bias will ensue. Fuller, Manski, and Wise argued that a model explaining expected financial aid, expected earnings, and college choice should be estimated simultaneously, but for reasons of tractability, they estimated their model equation-by-equation.
Despite the potential for bias, most studies in the last twenty years have focused either on applications or enrollments only. A few exceptions are Curs and Singell (2002) and Abraham and Clark
(2003). Curs and Singell used a bivariate probit model to jointly estimate applications and enrollments at a large public university. They assume enrollments respond to actual financial aid but applications depend upon expected financial aid. They found that studies that ignore how tuition affects enrollment through its effect on the pool of applicants may result in an underestimation of the tuition elasticity of enrollment. They also found that application elasticity is greater than the enrollment elasticity, that out-of-state students are more price sensitive than in-state students, and that modeling resident and non-resident students together biases the overall price elasticity towards zero.
Abraham and Clark (2003) used the introduction of the District of Columbia’s Tuition Assistance Grant Program to study application and enrollment decisions. The program allowed District of Columbia students to attend out-of-district colleges at in-state tuition rates. After the program was in place for one year, they found application to college by District residents increased substantially, as did enrollment at eligible institutions. However, overall freshman enrollment increased only modestly, implying that the tuition subsidy primarily affected where students went to school rather than whether they went to school. Limitations of this study were 1) using whether SAT scores were sent to a school as a measure of
application and 2) application and enrollment behavior were not jointly estimated.
The implication of these studies is that if one is interested in estimating the impact of tuition and financial aid on enrollment, attention must be paid to the composition of the sample, the potential
endogeneity of financial aid, and the explicit modeling of the complete sequence of decisions that leads to enrollment. In this paper we jointly estimate application, admission, and enrollment behavior and
endogenize financial aid receipt.
The Empirical Approach
Studies of student choice have typically focused on the very end of the search stage, where students make decisions about which institution to attend among the group of schools to which they have
been admitted. Thus, many studies have focused on the effects of factors thought to influence enrollment decisions (conditional on admission), like the tuition rates students face and the types and amounts of financial aid offered to the individual (Manski and Wise, 1983; St. John, 1990; Brooks, 1996; Braunstein, McGrath, and Pescatrice, 1999). The literature also contains a number of studies that model application behavior (Venti & Wise, 1982; Weiler, 1994; and DesJardins, Dundar, and Hendel, 1999), but few if any models of the admission-decision process within institutions.
As noted above, there may be problems with an analytic strategy that focuses only on enrollment conditional on admission. The application, admission, aid determination, and enrollment processes are sequential and correlated and should be modeled as such. Also, we believe students make decisions based on their expectations, and that these expectations should also be included in student choice models.4 For instance, students tend to apply to institutions where they have a reasonable expectation of being admitted. Likewise, students form their choice sets based on their expectations of financial aid. If the latter is true, then changes in aid packaging not only affect enrollments directly, but also have an impact on application decisions. Modeling the structure of student choice (the structure is outlined in Figure 1) and incorporating student expectations allows us to remedy some of the aforementioned limitations of college choice research, thereby adding to the literature in this area of study
[FIGURE 1 ABOUT HERE]
Controlling for the Non-Random Nature of Financial Aid Application and Receipt 5
Whether students receive financial aid is not randomly distributed among all applicants to an institution. Some students choose not to apply for aid, others apply for aid but do not receive it, and based on their individual characteristics many students apply for and receive some sort of financial support from government, institutional, and/or outside sources. In order to control for the non-random nature of aid distribution, we estimate the receipt of aid and the amount students would receive if they applied for aid.
Conditional on being admitted to the institution, we estimate the probability that a prospective student will receive financial aid controlling for personal and demographic factors (e.g., race, gender, siblings in college); prior educational characteristics (including high school performance and ACT Composite scores), college intentions and institutional preferences (e.g., type of institution they prefer, major); location specific factors (e.g., year-specific unemployment rates/the average public four-year tuition/measures of population growth in one’s state of residence) and trend variables (e.g., dummies for year of matriculation); and information from the application for admission (e.g., high school rank
percentile). (see Table 1A for the regressors included). The predicted probabilities produced by this model are saved and used in the structural model discussed below
Next we regress total aid awarded on a number of factors thought to predict how much aid individuals could expect given their observable characteristics. Note that this is an ordinary least squares regression model and is conditional on a student having applied to the institution and having received financial aid. We include many of the factors used in the aid probability model discussed above (see Table 2A for the variables included in this model) and we use the results to provide us with a predicted amount of total aid for each person who applied to the institution. These estimates are also saved and used in the structural model discussed below. 6
Estimating the Probability of Admission
Conditional on applying to the institution, whether a student is admitted is regressed on many of the variables used in the financial aid equations discussed above (see Table 3A for the variables included in the admissions model). Noteworthy is that we added variables that parse the admissions index score [defined as (2*ACT)+HSR%)] used by the institution into categories that represent the automatic admission range, the review range, and the rejection range. These variables represent a linear “spline” of the admissions index with “knots” at the relevant decision making thresholds. The coefficients on these
variables measure the slopes for the defined intervals of the admissions index, allowing us to observe whether admissions probabilities differ greatly (as expected) over the range of index scores. The main function of the admission model is to establish the probability of admission for each student in the sample, which is then used in subsequent equations.
Modeling Application and Enrollment
Next we model the probability of application for each student in the sample (conditional on having sent their entrance examination scores to the institution). Application behavior is estimated using many of the regressors used in the equations discussed above. However, we now include as regressors controls for a) the probability of admission given application to the institution (produced by the admission regression), b) the expected aid amount for all applicants (equal to the probability of aid receipt times the predicted aid amount), c) the expected aid amount for applicants weighted by their probability of
admission, and the squares of a) and b). We include c) because the value of this variable will be much different than the unweighted aid amount (denoted by b) for students who are very unlikely to be admitted (see Table 4A for the variables included). The basis for inclusion of these structural variables is that we believe application behavior is based on a prospective student’s assessment of the net benefits derived by applying to a particular institution. These net benefits are a function of a) the probability of acceptance and b) the expected amount of aid, given acceptance. We have no reason to suspect that the net benefits are linear in these variables so we also include the squares of these structural variables to capture any non-linearity in these regressors.
The final piece of the modeling is to estimate the probability of enrollment conditional on being admitted to the institution. Again we include as regressors many of the variables known to affect enrollment behavior, but we also include two variables that measure differences in aid expectations. These variables (denoted “positive aid” and “negative aid”) allow us to investigate whether students who
receive aid awards that exceed (are less than) the amount predicted by their characteristics will have higher (lower) enrollment probabilities than students who are awarded less (more) aid than predicted. Also included in the enrollment model is a structural variable that incorporates the amount of aid an applicant is predicted to receive, multiplied (or weighted) by the probability of receiving aid. This measure, labeled Expected Aid, is the expected value of aid for all applicants. We include the square of this variable to capture any non-linearity in this regressor (see Table 2 for the variables included in this model).
The Sample
Our sample includes students who sent their ACT scores to the study institution for admission consideration in the academic years 1997-1998 through 2001-2002. Our original sample is quite large (N = 97,636) and consists of individual-, institutional-, and state-level data for each of these five academic years. Individual-level variables include demographic (e.g., race/ethnicity, family income, gender, age, region of residence), high school information (e.g., type attended, grade point average, and scores on admission’s tests), preference information (e.g., type of college preferred, aspirations for post
baccalaureate study), and financial information (e.g., financial aid awarded). It is important to control for these (potentially) confounding effects because student responsiveness to important factors such as aid and tuition often varies across individuals, thereby affecting the composition of enrollments.
Institutional-level data includes information from the application for admission (e.g., parents’ education level, whether the student was a legacy, and additional academic information) and information included on the student’s financial aid application. State-level data includes the yearly unemployment and public four-year tuition rates in the prospective student’s home state, and information about the
population growth in one’s state of residence. Unemployment information is included because work is an alternative to college and enrollments tend to be counter-cyclical. We include measures of population
growth in the state of residence to control for the competition for seats in colleges in one’s home state. High growth rates among college-aged individuals may increase the competition for seats, reduce the chances of acceptance, and/or lower one’s chances for some types of financial aid, thereby driving some students to seek alternatives out-of-state. Inclusion of institutional- and state-level factors is important because the responsiveness of students to changes in these variables may be related to institution-specific factors (Duffy and Goldberg 1998) and opportunities in one’s state of residence (Card, 1995; Curs and Singell, 2002).
[TABLE 1 ABOUT HERE]
Based on observable characteristics, and as suggested above, there are differences in the sample of score senders, applicants, admits, and enrollees (see Table 1). After deleting records with missing information, we have an effective sample of over 86,000 score senders, over 40 percent of whom apply to the institution. Of the over 36,000 applicants in the five years examined, nearly 90 percent of these prospective students were granted admission, and 47 percent of the admits eventually enrolled.
There is evidence that students self select throughout the college choice process. For instance, the average ACT composite score and high school rank percentile scores are higher for applicants than score senders, suggesting that lower scoring students are less likely to apply to the institution than their higher scoring counterparts. There is also evidence that students with deficiencies in the high school preparation requirements are less likely apply to the institution than their score sending behavior would suggest. For instance, the application percentages of students with deficiencies in English and natural sciences are 4 percentage points lower than score senders without these deficiencies. Also, only 90 percent of score senders meet the foreign language requirement, whereas over 95 percent of applicants have two years of foreign language in high school. Similar patterns are evident with regard to the taking of advanced placement courses in high school. Students who have taken these courses have application rates that exceed what we would expect given their score sending patterns.
With regard to racial and ethnic distributions at each stage, African Americans comprise 2.8 percent of all score senders, 2.6 percent of applicants, and 2.2 percent of admitted and enrolled students. Although the percentage of enrollees is slightly lower than that of score senders, the institution is enrolling an equal percentage of all African American students who meet the admissions requirements. Latino/a students are about 1.7 percent of all score senders, yet they comprise 2.1 percent of applicants, admits, and enrollees. Based on these descriptive statistics, it appears the institution is attractive to the Latin community, which is growing rapidly in the state of Iowa. About 19 percent of all score senders are from states other than Iowa or Illinois (the latter being a major source of prospective students), 14 percent of whom apply and are admitted, yet only 8.2 percent of these students eventually enroll. This result is consistent with the literature that documents the difficulty in attracting students from out-of-state.
Another important source of prospective students for any institution of higher education is the children and relatives of graduates of the institution. Although we lack information about these “legacies” at the score sending stage, we do have this information for all applicants (this information is collected on the application for admission). Not surprisingly the descriptive data indicate that legacies enroll at rates higher than their admission rate would suggest. However, in the regressions conducted below, we do find that legacies enroll at rates higher than their non-legacy counterparts, even after controlling for
confounding factors.
Although we can garner insights into the reasons for the differences in the application, admission, and enrollment pools, the bivariate relationships discussed above are only descriptive and the implications suggestive. One needs to properly control for factors that may confound these simple relationships, and one way to do so is by employing multivariate statistical techniques.
[TABLE 2 ABOUT HERE] The Results
Although it is conventional to report odds ratios when estimating logistic regression results these statistics may be of limited utility in general and specifically when estimating the types of equations used in this study. Regarding the structural equations estimated in this study, they are highly non-linear thus any interpretation of individual effects is very difficult. Thus, we opt to calculate and save predicted probabilities for each individual in the sample and then chart these probabilities for selected subgroups (Long and Freese, 2001). One advantage of this process is that the analyst can choose to set the values of variables of interest while holding other regressors in the model constant at their mean values (or policy relevant values). We believe this is an effective method of examining how changes in important variables affect the probabilities of an event, and we employ this strategy in our discussion of the results.
Financial Aid Determination
Given the likely endogeneity of financial aid, we estimate the probability of aid receipt (whether a student received aid or not) and we predict the total aid amount all applicants could expect based on their observable characteristics. (The results are presented in the Appendix in Tables 1A and 2A, respectively). The predicted values produced by these two equations are used in subsequent equations so that we can test the effect that changes in aid probabilities and amounts have not only on enrollment behavior but also on application behavior.
The Congruence of the Admission Index and the Probability of Admission
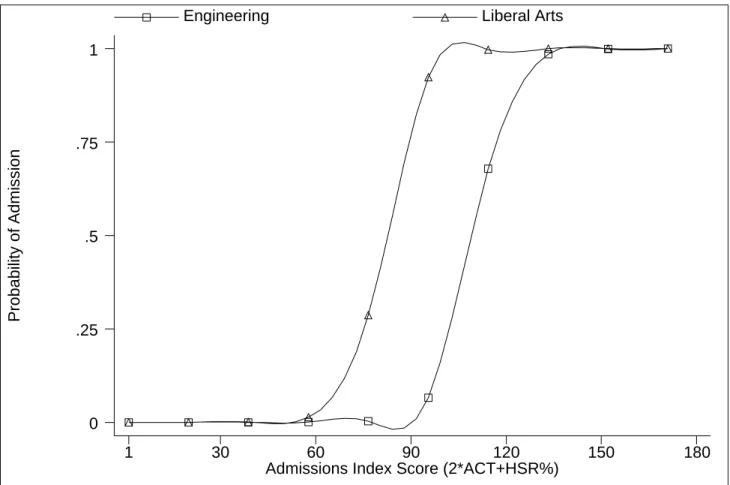
Next we estimate the probability of admission for all applicants (results displayed in Table 3A). As noted in the methods section above, the inclusion of a spline of the admission index score (AIS) to test whether there are specific points at which the probabilities of admission change dramatically seems effective. For instance, the regression results (see Table 3A) indicate that the probability of being admitted to the study institution is very low for students with admissions index scores in the 0 to 70
range. However, students with scores in the 71 to 110 range have rapidly increasing probabilities of admission (the function is very steep over these ranges). Toward the top end of the AIS distribution (111 plus), the function is relatively flat, as virtually all students with scores in this range are admitted.
[FIGURE 2 ABOUT HERE]
In order to present these results graphically, we produced adjusted probabilities of admission for students who applied to the two largest freshman-admitting colleges at the study institution. Figure 2 provides evidence that the admission distribution is consistent with the entrance requirements of each of these colleges. For instance, students applying to the School of Engineering typically need a minimum admissions index score of 120 to be automatically admitted, whereas Liberal Arts applicants need only a 90. As is the case in most institutions, these requirements are somewhat flexible depending on other factors considered by the institution (e.g., deficiencies in the high school preparation requirements, special talents). The spline results discussed above accurately describe the shape of the admissions probabilities at different levels of the admissions index score. At very low AIS scores students have virtually no chance of being admitted, near the lower cutoff points admission probabilities increase rapidly, and when one’s AIS score reaches the upper bound for automatic admission the probabilities are near one. Thus, splines appear to be an effective way of modeling the non-linearity in admissions probabilities rather than using higher order polynomials that are often hard to interpret.
Application Probabilities
Next we model application probabilities as a function of a host of factors including the following structural variables: the probability of admission given application to the institution, the expected aid amount for all applicants, the expected aid amount for applicants weighted by their probability of
admission, and the squares of the probability of admission and the expected aid amount (see Table 4A for the variables included and the regression results). The inclusion of these structural variables allows us to
incorporate student expectations of admission and aid receipt and how these factors are related to a student’s application probability.
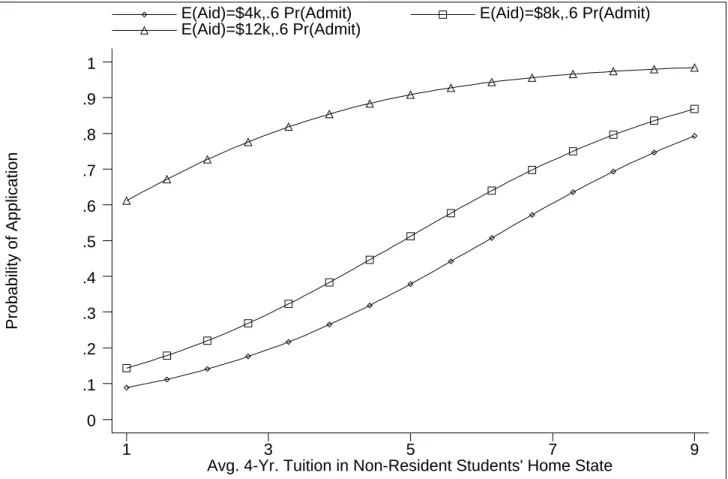
In Figure 3 we use the results of the structural model of application to examine the responsiveness of a subgroup of students to changes in their expected levels of financial aid (see the note at the bottom of the figure for detailed information about the characteristics of the students included in this simulation). In this simulation we allow the expected amount of aid to vary, and hold the probability of admission constant at the mean value (.6) of the group of students being examined. Generally we observe that increases in expected aid increase the probabilities of application, but these effects vary quite dramatically by the level of tuition in one’s home state and by the amount of expected aid assumed. What is interesting is that at very low tuition levels in one’s state of residence, expected aid does not appear to have a
powerful effect on getting students to apply to the study institution. At low levels of tuition in the state of residence it takes very high aid expectations to increase one’s application probability appreciably.
[FIGURE 3 ABOUT HERE]
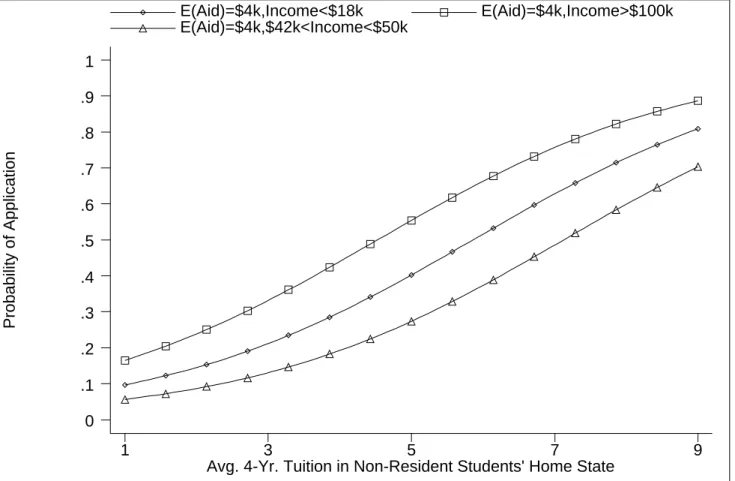
One of the arguments for having aid programs is to equalize access for groups with differing abilities to pay. We are curious whether aid expectations can be used to equalize application probabilities. Figure 4 provides the results of a simulation designed to answer this question. Initially we set expected aid to $4,000 for each of three incomes groups (< $18,000, $42,000 to $50,000, and $100,000 plus) and we held these students’ admissions probabilities constant at .6. When this simulation is run we observe the following pattern: high-income students have the highest probabilities of applying (depicted by a line with boxes in Figure 4), the next highest set of probabilities is for low-income students (depicted by a line with small diamonds), and the curve with triangles represents middle income students’ probabilities. Our objective is to see how much we need to increase middle-income students’ expected aid in order to equate their probabilities of application to those of the low-income group. That is, how much do we need to increase expected aid in order to move the bottom function up to be coterminous with the low-income
curve? We find that expected aid needs to be increased to $8,000 for middle-income students in order to equate low- and middle-income application chances.
[FIGURE 4 ABOUT HERE] Estimating the Probability of Enrollment
Table 3 presents predicted probabilities of enrollment by family income and race/ethnicity. The top panel of the table presents these results for students in the sample using their actual values for each of the regressors included in the model. We see that enrollment chances increase with income, but that the probabilities of enrollment are less variable within an income group.
In the middle panel we examine the effect of changes in expected aid. We set expected aid equal to zero and find that enrollment probabilities are very low compared to the baseline displayed in the top panel. For instance, low-income white students have a baseline probability of enrollment of .38 (see top panel) but when they do not expect to receive aid their predicted probability falls to .08, a 79 percent reduction.
In the bottom panel we assume expected aid levels of $4,000 for all students (the average expected aid is about $2,450) and the probabilities of enrollment increase dramatically compared to the baseline results. Low-income white students’ probabilities of enrollment increase to .66 over the baseline of .38, a 74 percent increase. These results suggest enrollment propensities are related to expectations, and institutional efforts to inform students about their chances of receiving aid and the amounts they can expect may have positive enrollment effects. Although there are many studies documenting the effect of actual aid on enrollment behavior, these results provide clear evidence that student enrollment behavior is also influenced by students’ expectations of aid.
[TABLE 3 ABOUT HERE]
We also estimate how discrete changes in aid affect students’ enrollment probabilities (presented below but not tabled). Examination of these marginal effects permits us to determine the enrollment
responsiveness of students to changes in financial aid (again, all other regressors are held constant at their mean values). Recall that the aid measure used in the structural equation is expected aid, not actual aid as is often used in enrollment equations. We find that the effect sizes first rise then fall. For instance, when expected aid increases from zero to $1,000, the enrollment probability increases by .11; the marginal effect is .21 when expected aid increases from $1,000 to $2,000; .44 when aid changes from $2,000 to $3,000; .23 when aid is increased from $3,000 to $4,000; and .08 when aid changes from $4,000 to $5,000. After that the marginals decline to near zero (.01 for the $5,000 to $6,000 range) and remain at these very low levels thereafter.
We also ran an enrollment equation (results not shown) conditional on admission that included actual aid rather than expected aid. This is the type of model specification often used by institutional researchers and enrollment management consultants. Compared to the marginals produced by the traditional enrollment regression, the structural results indicate that enrollment probabilities are more responsive (within some aid ranges) to expected aid than to actual aid. For instance, when aid is changed from $2,000 to $3,000, the marginal effect of expected aid is .44 whereas it is only .21 in that range in the traditional enrollment equation. In the $3,000 to $4,000 range we observe marginals of .23 and .15 for the structural and traditional models, respectively. These results suggest that aid responsiveness varies depending on how one models the enrollment process.
Table 4 presents the results when we simulate all combinations of expected and actual aid from zero to $10,000. That is, we set actual aid equal to zero and allow expected aid to vary over the zero to $10,000 range. Then we set actual aid to $1,000 and allow expected aid to vary over the zero to $10,000 range (etc.; other regressors included in the model are set to their actual values). A careful examination of this table reveals that students who receive less aid than they expect (based on their observable
characteristics) are less likely to enroll than students who receive aid in excess of their expectations. The diagonal in Table 4 (in bold) represents every actual/expected aid combination where the two aid values
are equal. A calculation of the average predicted probabilities of enrollment above the diagonal reveals that students who are disappointed (receive less aid than expected) have about a .58 chance of enrolling. Below the diagonal are the probabilities of enrollment for students who receive aid in excess of their expectations, and the average probability of enrollment for this group is .89. One should note that the magnitudes of the enrollment probabilities are very different above and below the diagonal. For instance, students who expect and receive aid of $3,000 have enrollment probabilities of .816. If actual aid exceeds their $3,000 expectation by $1,000 (actual aid equals $4,000), their enrollment probability increases to .882, an 8 percent increase. If actual aid is less than their $3,000 expectation by $1,000 (actual aid equals $2,000), their enrollment probability decreases to .665, an 18 percent decrease in enrollment probability. These results indicate that aid expectations are important and asymmetric, and that the congruence between a students aid expectations and what they are offered can dramatically affect enrollment probabilities.
[TABLE 4 ABOUT HERE]
These simulations document the utility of developing a structural model in that one can examine how student expectations are related to their probabilities of applying and enrolling and how differences in expectations and aid actualizations affect these decisions.
Continuing This Line of Inquiry
Although we have made substantial progress in the development of a structural model of student choice with the research discussed above, there are other innovations and improvements that we intend to incorporate. For instance, we use total aid paid to students as the aid measure in our equations, yet we know that aid effects vary by the type of aid and the timing of aid (St. John, 1990; DesJardins, Ahlburg, and McCall, 1999, 2002a, 2002b). In the near future we will have disaggregated aid data by type and we will estimate the model using loan, work-study, grant, institutional aid, and outside sources of aid instead
of total aid. Once we estimate the model using financial aid by type we can then simulate what would happen to applications and enrollments if a policy such as the one proposed by Representative McKeon is implemented. We will zero out campus-based programs such as Federal work-study, Supplemental Educational Opportunity Grants, and Perkins loans to investigate the effects of the loss of these funding sources on application and enrollment probabilities.
In the model estimated above, we included average four-year tuition in the state of residence as a measure of competing institutions tuition rates. We intend to collect more detailed tuition information about competing institutions, especially those in the states contiguous to Iowa, which generate about 90 percent of all applications to the institution. Incorporation of these tuition rates will permit us to estimate cross-price elasticities of enrollment. For instance, we could estimate the effect on University of Iowa applications and enrollments when the University of Illinois-Urbana-Champaign (one of Iowa’s main competitors) raises its tuition rates.
Eventually we would like to link this structural model of student choice with a longitudinal model of student departure we have been developing over the past few years (see AUTHORS). If this exercise is successful, we will be able to model the entire sequence from the time a student sends their scores to an institution until they depart from college (whether due to transfer, dropout, or graduation). Construction of such a model will permit us to learn much more about the interactions of events that take place before college and those that happen after a student enters college, and how individual and other characteristics affect these events.
Our study improves upon prior student choice research by jointly modeling application, admission, financial aid determination, and enrollment behavior, thereby correcting for the possible selection bias that may occur when enrollment is modeled without consideration of these other decisions. In doing so we are able to simulate how a host of factors affect not only enrollment behavior, but also application propensities.
We find that application behavior is related to one’s probability of admission and the expectation of aid, and that these results can be used to simulate how changes in these variables affect student
application probabilities. Like other student choice research, we find enrollment chances increase with income, but that these probabilities are less variable by race/ethnicity within a particular income group. We find that the probabilities of enrollment at the study institution increase as the average tuition in a non-resident student’s home state increases.
We find different marginal effects on enrollment depending on how the enrollment process is modeled. Our results indicate that aid (both actual and predicted) has non-linear effects, that is, aid effects vary depending on the base from which one starts and the dollar value of the aid increments. We find that aid expectations have powerful and asymmetric effects on enrollment propensities. We feel the most important finding is thatdisappointing students with regard to their aid expectations can have serious negative effects on enrollment. This is an important innovation as some researchers have argued that students act on the basis of their expectations, but few, if any investigators have developed a model capable of testing these assumptions.
We believe structural models like the one presented above improve our collective understanding of the interactions among application, admission, financial aid expectations, and enrollment behavior. Not only is the research conducted herein of academic interest, our simulations demonstrate that these models also have practical utility in that they can be used to simulate the impacts of changes in the factors that affect the structure of college choice. A better understanding of the college choice process, combined
with the ability to simulate changes in important policy variables, will be beneficial to the many constituents of higher education.
References
Abe, M. (1998). Measuring consumer, nonlinear brand choice response to price. Journal of Retailing
74(4), 541-68
Abraham, K. and Clark, M.A. (2003). Financial aid and student’s college decisions: Evidence from the District of Columbia’s tuition assistance grant program. Education Research Section Working Paper #2, Princeton University.
Bishop, J. (1977). The effect of public policies on the demand for higher education. The Journal of Human Resources, 12(3), 285-307.
Braunstein, A., McGrath, M., and Pescatrice, D. (1999). Measuring the impact of income and financial aid offers on college enrollment decisions. Research in Higher Education,
40(3), 247-259.
Brooks, S. H. (1996). Econometric modeling of enrollment behavior. Journal of Student Financial Aid, 26(3), 7-17.
Burd, S. (2003). Republican introduces bill to penalize colleges for tuition increases. Chronicle of Higher Education 50(9), (October 24), A26.
Card, D. (1995). Using geographic variation in college proximity to estimate the returns to schooling. In L.N. Christofides, E.K. Grant, and R. Swidinsky (eds.), Aspects of Labor Market Behaviour: Essays in Honour of John Vanderkamp. Toronto:University of Toronto Press.
Clotfelter, C.T., and Rothschild, M. (1993). Studies of Supply and Demand in Higher Education. (A National Bureau of Economic Research Project Report). Chicago, IL: University of Chicago Press. Cortjens, M.L. and Gautschi, D.A. (1983). Conjoint analysis: A comparative analysis of specification tests for the utility function. Management Sciences, 29(12), 1393-1413.
Curs, B. and Singell, L D. (2002). An analysis of the application and enrollment process for in-state and out-of-state students at a large public university. Economics of Education Review, 21, 111-124.
DesJardins, S.L., Dundar, H., and Hendel, D.D. (1999) Modeling the application decision process at a land grant university. Economics of Education Review, 18, 117-132.
DesJardins, S.L., Ahlburg, D.A., and McCall, B.P. (1999). An event history model of student departure.
Economics of Education Review, 18(3): 375-390.
DesJardins, S.L., Ahlburg, D.A., and McCall, B.P. (2002a). Simulating the longitudinal effects of changes in financial aid on student departure from college. Journal of Human Resources, 37(3): 653-679.
DesJardins, S.L., Ahlburg, D.A., and McCall, B.P. (2002b). A temporal investigation of factors related to timely degree completion. Journal of Higher Education, 73(5): 555-581.
Dey, E. L., and Astin, A. W. (1993). Statistical alternatives for studying college student retention: A comparative analysis of logit, probit, and linear regression. Research in Higher Education, 34(5): 569-581.
Duffy E.A., and Goldberg, I. (1998). Crafting a Class. Princeton, NJ: Princeton University Press. Dynarski, S. (2000). Hope for whom? Financial aid for the middle class and its impact on college attendance. National Tax Journal 53(3), 629-662.
Dynarski, S. (2002). The behavioral and distributional implications of aid for college. American Economic Review 92(2), 279-285.
Dynarski, S. (2003). Does aid matter? Measuring the effect of student aid on college attendance and completion. American Economic Review, 93(1), 279-288.
Ehrenberg, R.G. and Sherman, D.R. (1984). Optimal financial aid policies for a selective university.
Journal of Human Resources 19(2), 202-230.
Flint, T.A. (1992). Parental and planning influences on the formation of student college choice sets.
Research in Higher Education, 33, 689-708.
Fuller, W.C., Manski, C.F., and Wise, D.A. (1982). New evidence on the economic determinants of postsecondary school choice. Journal of Human Resources, 17, 477-498.
Greene, W.H. (1993). Econometric Analysis. New York, NY: Macmillan Publishing Co.
Hanson, K.H., and Litten, L.H. (1982). Mapping the road to academia: A review of research on women, men and the college-selection process. In P. Perun (ed.), The Undergraduate Woman: Issues in Education. Lexington, MA: Lexington Books.
Hanushek, E.A., and Jackson, J.E. (1977). Statistical Methods for Social Scientists. San Diego, CA: Academic Press.
Hearn, J. (1987). Impacts of undergraduate experiences on aspirations and plans for graduate and professional education. Research in Higher Education, 27, 119-141.
Heller, D.E., (1997). Student price response in higher education: An update to Leslie and Brinkman.
Journal of Higher Education, 68(6), 624-659.
Heller, D.E. (1999). The effects of tuition and state financial aid on public college enrollment. The Review of Higher Education, 23(1), 65-89.
Hossler, D. (1984). Enrollment Management: An Integrated Approach. New York: College Entrance Examination Board.
Hossler, D., & Gallagher, K.S. (1987). Studying student college choice: A three-phase model and the implications for policymakers. College and University, 62, 207-221.
Hossler, D., Braxton, J., and Coopersmith, G. (1989). Understanding student college choice. In J. C. Smart (ed.), Higher Education: Handbook of Theory and Research. Vol. 5. New York: Agathon Press. Hossler, D., Schmit, J., and Vesper, N. (1999). Going to College: How Social, Economic, and
Educational Factors Influence the Decisions Students Make. Baltimore: The John Hopkins University Press.
Jackson, G. A. (1982). Public efficiency and private choice in higher education. Educational Evaluation and Policy Analysis, 4, 237-247.
Johnston, J. and DiNardo, J. (1997). Econometric Methods. New York: McGraw-Hill Companies, Inc. Jackson, G.A. (1990). Financial aid, college entry, and affirmative action. American Journal of Education, 98(4), 523-550.
Jackson, G.A., and Weathersby, G.B. (1975). Individual demand for higher education. Journal of Higher Education, 46(6), 623-652.
Kallio, R.E. (1995). Factors influencing the college choice decisions of graduate students. Research in Higher Education, 36(1), 109-124.
Kane, T.J. (1994). College entry by blacks since 1970: The role of college costs, family background, and the returns to education. The Journal of Political Economy, 102(5), 878-911.
Kane, T.J. (2003). A quasi-experimental estimate of the impact of financial aid on college-going. National Bureau of Economic Research Working Paper #9703.
Keane, M.P. (2002). Financial aid, borrowing constraints, and college attendance: Evidence from structural estimates. American Economic Association (Papers and Proceedings), 92(2), 293-297.
Kodrzycki, Y.K. (1999). Geographic shifts in higher education, New England Economic Review, July-August, 27-47.
Kohn, M.G., Manski, C.F., and Mundel, D.S. (1976). An empirical investigation of factors which influence college-going behavior. Annals of Economics and Social Measurement, 5(4), 391-419. Leslie, L.L. and Brinkman, P.T. (1987). Student price response in higher education: The student demand studies. Journal of Higher Education, 58(2), 181-204.
Leslie, L.L. and Brinkman, P.T. (1988). The Economic Value of Higher Education. New York: Macmillan.
Light, A., and Strayer, W. (2002). From Bakke to Hopwood: Does race affect college attendance and completion? The Review of Economics and Statistics, 84(1), 34-44.
Linsenmeier, D.M., Rosen, H.S., and Rouse, C.E. (2002). Financial aid packages and college enrollment decisions: An econometric case study. National Bureau of Economic Research working paper #9228.
Long, J. S. (1997). Regression Models for Categorical and Limited Dependent Variables. Thousand Oaks, CA: Sage Publications.
Long, J. S. and Freese, J. (2001). Regression Models for Categorical Dependent Variables Using Stata. College Station, TX: A Stata Press Publication.
Manski, C.F. (1977). The structure of random utility models. Theory and Decision, 8, 229-254.
Manski, C.F. and Wise, A. D. (1983). College Choice in America. Cambridge, MA: Harvard University Press.
Marschak, J., DeGroot, M., and Becker, G. (1963). Stochastic models of choice behavior. Behavioral Sciences, 8, 51-55.
McFadden, D. (1976). Aggregate travel demand forecasting from disaggregated behavioral models.
Transportation Research Record, 534, 24-37.
McPherson, M.S. and Schapiro, M.O. (1991). Does student aid affect college enrollment? New evidence on a persistent controversy. American Economic Review, 81, 309-318.
Parker, F. and Summers, J. (1993). Tuition and enrollment yield at selective liberal arts colleges.
Economics of Education Review, 12, 311-324.
Parsons, G.R. (2000). Narrow choice sets in a random utility model of recreation demand fishing in Maine. Land Economics 76(1), 86-99.
Paulsen, M.B. (1990). College Choice: Understanding Student Enrollment Behavior. ASHE-ERIC Higher Education Report 90-6. Washington D.C.: The George Washington University.
Radner, R., and Miller, L. (1970). Demand and supply in U.S. higher education: A progress report.
American Economic Review, 60, 326-334.
St. John, E.P. (1990). Price response in enrollment decisions: An analysis of the high school and beyond sophomore cohort. Research in Higher Education, 31(2), 161-176.
St. John, E.P. (1992). Workable models for institutional research on the impact of student financial aid.
Journal of Student Financial Aid, 22(3), 13-26.
Seneca, J., and Taussig, M. (1987). The effects of tuition and financial aid on enrollment decisions at a state university. Research in Higher Education,26(4), 337-362.
Thurnstone, L. (1927). A law of comparative judgment. Psychological Review, 34, 273-286.
Tobias, J.L. (2002) Model uncertainty and race and gender heterogeneity in the college entry decision.
Economics of Education Review, 21, 211-219.
Van Soest, A. (1995). A structural model of family labor supply: A discrete choice approach. Journal of Human Resources, 30, 63-88.
Van der Klaauw, W. (2002). Estimating the effect of financial aid offers on college enrollment: A regression-discontinuity approach. International Economic Review, 43(4), 1249-1287.
Venti, S.F. and Wise, D.A. (1982). Test scores, educational opportunity, and individual choice. Journal of Public Economics, 18, 35-63.
Weiler, W.C. (1994). Transition from consideration of a college to the decision to apply. Research in Higher Education, 35(6), 631-646.
Welki, A.M. and Navratil, F.J. (1987). The role of applicants’ perceptions in their choice of college.
Table 1: Descriptive Statistics of the Sample
ACT Score
Variable Senders Applicants Admits Enrollees
Sample Size 86,149 36,234 32,487 15,240
ACT Composite 22.88 24.27 24.62 24.13
High School Rank % 70.09 73.05 75.95 73.86
High School GPA 0.5 to 0.9 0.1% 0.1% 0.1% 0.1%
High School GPA 1.0 to 1.4 0.2% 0.1% 0.1% 0.1%
High School GPA 1.5 to 1.9 1.3% 0.3% 0.1% 0.1%
High School GPA 2.0 to 2.4 6.5% 3.0% 1.3% 1.6%
High School GPA 2.5 to 2.9 15.3% 11.4% 8.0% 9.1%
High School GPA 3.0 to 3.4 33.1% 33.7% 34.6% 36.5%
High School GPA 3.5 to 4.0 43.6% 51.5% 55.9% 52.5%
Female 52.8% 56.5% 57.9% 57.5% White 88.2% 88.0% 88.5% 88.5% African Americans 2.8% 2.6% 2.2% 2.2% Asian Americans 2.7% 3.5% 3.4% 3.1% Latino/a 1.7% 2.1% 2.1% 2.1% Other Ethnicity 3.9% 3.6% 3.6% 3.6%
No. of Siblings < 21 Years Old 1.43 1.39 1.39 1.38
From Big City 9.3% 10.5% 10.1% 9.0%
From Iowa 56.3% 51.0% 51.2% 64.8%
From Illinois 25.0% 34.9% 34.8% 27.0%
From Other States 18.8% 14.1% 14.0% 8.2%
Income < $18,000 5.0% 4.5% 4.2% 5.2% Income $18,000-$24,000 4.8% 3.1% 2.9% 3.3% Income $24,000-$30,000 5.7% 3.6% 3.5% 3.8% Income $30,000-$36,000 6.5% 4.1% 3.9% 3.9% Income $36,000-$42,000 7.8% 5.0% 4.7% 4.7% Income $42,000-$50,000 10.3% 7.4% 7.3% 7.5% Income $50,000-$60,000 12.7% 10.3% 10.3% 10.2% Income $60,000-$80,000 18.2% 19.2% 19.4% 20.0% Income $80,000-$100,000 11.8% 15.4% 15.7% 15.3% Income > $100,000 17.0% 27.6% 28.2% 26.0%
Miles from Institution (in Hundreds) 1.82 1.72 1.70 1.41 Attended Public High School 89.2% 87.7% 88.2% 89.7% Attended Religious High School 9.7% 11.2% 10.8% 9.6%
Attended Private High School 0.7% 0.7% 0.6% 0.4%
Less Than 4 Years English 11.3% 7.3% 7.0% 8.3%
Less Than 3 Years Math 4.9% 2.8% 2.4% 2.7%
Less Than 3 Years Natural Science 10.0% 6.0% 5.2% 5.6% Less Than 3 Years Social Science 10.9% 9.1% 8.8% 9.1% Met Foreign Language Requirements 90.3% 95.4% 96.2% 95.9%
Took English AP Course(s) 37.7% 45.4% 47.7% 44.1%
Took Math AP Course(s) 36.9% 43.6% 46.1% 41.5%
Took Social Science AP Course(s) 26.0% 33.4% 35.1% 30.6% Took Natural Science AP Course(s) 31.7% 40.1% 42.3% 37.5% Took Foreign Language AP Course(s) 17.2% 22.8% 24.1% 19.8%
Table 1: Descriptive Statistics of the Sample (cont’d)
ACT Score
Variable Senders Applicants Admits Enrollees
Agriculture 1.5% 0.5% 0.4% 0.4%
Architecture 2.1% 1.3% 1.2% 1.1%
Business 12.6% 12.9% 12.6% 12.8%
Marketing 0.6% 0.5% 0.5% 0.5%
Communication 5.1% 6.0% 5.9% 5.7%
Community & Personal Services 2.3% 1.3% 1.2% 1.3%
Computer Science 3.3% 2.5% 2.4% 2.5%
Cross Disciplinary Studies 0.1% 0.2% 0.2% 0.2%
Education 8.1% 6.6% 6.4% 6.1% Engineering 8.8% 8.0% 8.0% 7.3% Languages 0.4% 0.4% 0.4% 0.4% Health 20.0% 22.5% 23.3% 24.2% Home Economics 0.5% 0.3% 0.3% 0.3% Letters 1.2% 1.6% 1.6% 1.5% Mathematics 0.6% 0.7% 0.8% 0.8% Philosophy 0.2% 0.2% 0.2% 0.2% Sciences 4.9% 5.4% 5.5% 5.3% Social Sciences 9.0% 10.6% 10.7% 11.1% Arts 4.7% 4.9% 4.8% 4.8% Undecided 11.0% 11.2% 11.1% 11.1%
Prefer College > 20,000 Students 22.4% 27.5% 27.5% 30.0% Aspire to Post Bach. Degree 59.2% 69.4% 70.8% 68.5%
Iowa Unemployment Rate 2.97 3.00 3.00 3.01
Other States Unemployment Rate 4.23 4.36 4.36 4.40
Iowa Population Growth 1.2% 1.4% 1.4% 1.4%
Other States Population Growth 2.5% 2.7% 2.7% 2.8%
Avg. 4 Year Public Tuition in Iowa $3,060.3 $3,047.8 $3,047.5 $3,044.6 Avg. 4 Year Public Tuition in Other States $3,767.9 $3,885.7 $3,884.6 $3,926.1
1997 Cohort 17.3% 18.2% 18.2% 18.9% 1998 Cohort 19.5% 21.2% 21.2% 21.3% 1999 Cohort 22.1% 21.2% 21.1% 20.9% 2000 Cohort 21.1% 19.9% 19.7% 19.6% 2001 Cohort 20.0% 19.6% 19.7% 19.2% Legacy - 21.0% 21.3% 27.1%
Parents Have College Degree - 64.3% 65.2% 61.8%
Age at Application - 17.74 17.72 17.74
High School Size - 315.1 312.9 284.5
Total Aid Awarded ($1,000) - - $5.6 $5.2
Table 2: Structural Estimates of the Probability of Enrollment
Variable Odds Ratio Std. Err. z P>|z|
ACT Composite 0.93 0.01 -12.86 0.00 0.92 0.94 Female 1.02 0.04 0.67 0.50 0.96 1.10 African Americans 0.10 0.02 -10.16 0.00 0.06 0.16 Asian Americans 0.83 0.08 -2.01 0.05 0.69 1.00 Latino/a 0.27 0.04 -8.14 0.00 0.20 0.37 Other Ethnicity 1.04 0.09 0.48 0.63 0.88 1.23
No. of Siblings < 21 Years Old 0.86 0.01 -8.96 0.00 0.83 0.89
From Big City 1.16 0.06 2.79 0.01 1.05 1.30
From Illinois 0.18 0.20 -1.53 0.13 0.02 1.63
From Other States 0.12 0.14 -1.87 0.06 0.01 1.11
Income $18,000-$24,000 0.88 0.16 -0.66 0.51 0.61 1.27 Income $24,000-$30,000 1.04 0.18 0.21 0.84 0.74 1.46 Income $30,000-$36,000 1.10 0.20 0.52 0.60 0.77 1.56 Income $36,000-$42,000 1.43 0.25 2.06 0.04 1.02 2.02 Income $42,000-$50,000 2.16 0.37 4.50 0.00 1.54 3.01 Income $50,000-$60,000 2.69 0.47 5.61 0.00 1.90 3.80 Income $60,000-$80,000 3.97 0.71 7.74 0.00 2.80 5.64 Income $80,000-$100,000 6.82 1.37 9.58 0.00 4.60 10.09 Income > $100,000 10.86 2.42 10.72 0.00 7.02 16.80 Miles from Institution (in Hundreds) 0.88 0.02 -5.57 0.00 0.84 0.92
Miles Squared 1.00 0.00 4.46 0.00 1.00 1.00
Attended Public High School 1.30 0.38 0.91 0.36 0.73 2.32 Attended Religious High School 1.16 0.34 0.51 0.61 0.65 2.07 Attended Private High School 1.26 0.45 0.65 0.52 0.62 2.55 Prefer College > 20,000 Students 1.27 0.04 6.99 0.00 1.19 1.36 Aspire to Post Bach. Degree 1.01 0.04 0.21 0.84 0.94 1.08 Iowa Unemployment Rate 0.74 0.17 -1.35 0.18 0.48 1.15 Other States Unemployment Rate 0.83 0.06 -2.49 0.01 0.72 0.96 Iowa Population Growth 0.99 0.07 -0.18 0.85 0.85 1.14 Other States Population Growth 1.01 0.01 0.78 0.44 0.99 1.02 Avg. 4 Year Public Tuition in Iowa 1.00 0.00 0.21 0.83 1.00 1.00 Avg. 4 Year Public Tuition in Other States 1.00 0.00 3.63 0.00 1.00 1.00
1998 Cohort 0.66 0.07 -3.65 0.00 0.53 0.83
1999 Cohort 0.47 0.07 -5.06 0.00 0.36 0.63
2000 Cohort 0.37 0.06 -5.87 0.00 0.26 0.51
2001 Cohort 0.32 0.06 -6.51 0.00 0.22 0.45
High School GPA 1.0 to 1.4 0.51 0.47 -0.74 0.46 0.08 3.08 High School GPA 1.5 to 1.9 6.57 4.87 2.54 0.01 1.54 28.10 High School GPA 2.0 to 2.4 1.85 1.09 1.05 0.30 0.58 5.90 High School GPA 2.5 to 2.9 1.24 0.71 0.37 0.71 0.40 3.84 High School GPA 3.0 to 3.4 1.38 0.79 0.56 0.58 0.45 4.23 High School GPA 3.5 to 4.0 1.55 0.89 0.77 0.44 0.51 4.77
Legacy 1.72 0.06 14.27 0.00 1.59 1.85
Applied to School of Engineering 0.83 0.06 -2.51 0.01 0.71 0.96 High School Rank Percentile 0.96 0.00 -20.28 0.00 0.96 0.96
Agriculture 0.71 0.17 -1.42 0.16 0.44 1.14 Architecture 1.01 0.14 0.08 0.94 0.77 1.34 Business 1.15 0.07 2.34 0.02 1.02 1.29 Marketing 0.95 0.20 -0.23 0.82 0.62 1.45 Odds Ratio 95% Confidence Interval
Table 2: Structural Estimates of the Probability of Enrollment (cont’d)
Variable Odds Ratio Std. Err. z P>|z|
Communication 0.92 0.07 -1.16 0.25 0.79 1.06
Community & Personal Services 1.05 0.15 0.36 0.72 0.80 1.39
Computer Science 0.95 0.10 -0.46 0.65 0.77 1.18
Cross Disciplinary Studies 1.16 0.41 0.42 0.67 0.58 2.34
Education 0.99 0.07 -0.18 0.86 0.86 1.14 Engineering 0.90 0.07 -1.32 0.19 0.76 1.05 Languages 0.97 0.25 -0.12 0.90 0.59 1.60 Health 0.95 0.06 -0.83 0.40 0.85 1.07 Home Economics 0.97 0.27 -0.11 0.92 0.56 1.69 Letters 1.03 0.14 0.24 0.81 0.79 1.34 Mathematics 1.23 0.23 1.11 0.27 0.85 1.79 Philosophy 1.45 0.47 1.15 0.25 0.77 2.74 Sciences 0.93 0.08 -0.92 0.36 0.79 1.09 Social Sciences 0.94 0.06 -0.96 0.34 0.82 1.07 Arts 0.82 0.07 -2.35 0.02 0.69 0.97
Took English AP Course(s) 0.97 0.04 -0.90 0.37 0.90 1.04 Took Math AP Course(s) 1.01 0.04 0.30 0.76 0.94 1.09 Took Social Science AP Course(s) 1.00 0.04 0.12 0.91 0.93 1.08 Took Natural Science AP Course(s) 0.99 0.04 -0.21 0.84 0.92 1.07 Took Foreign Language AP Course(s) 1.01 0.04 0.18 0.86 0.93 1.09 Expected Financial Aid 5.52 0.62 15.22 0.00 4.43 6.87 Expected Financial Aid Squared 0.92 0.01 -6.27 0.00 0.90 0.94 Amount of Aid in Excess of Expected 1.97 0.06 22.35 0.00 1.85 2.09 Amount of Aid Less Than Expected 2.92 0.07 44.78 0.00 2.78 3.06
Log likelihood -12854.41 LR Chi-square with 73 df 19206.50 Prob >Chi-square 0.00 Pseudo R-square 0.43 Odds Ratio 95% Confidence Interval
Table 3: Predicted Probabilities of Enrollment by Family Income and Race/Ethnicity Students With Average Characteristics
African Asian Other
Family Income White American American Latino/a Ethnic
Less than $18,000 0.38 0.36 0.35 0.34 0.33 $18,000-$24,000 0.42 0.41 0.39 0.38 0.37 $24,000-$30,000 0.46 0.45 0.44 0.42 0.41 $30,000-$36,000 0.51 0.49 0.48 0.47 0.46 $36,000-$42,000 0.55 0.54 0.53 0.51 0.50 $42,000-$50,000 0.59 0.58 0.57 0.56 0.54 $50,000-$60,000 0.64 0.62 0.61 0.60 0.59 $60,000-$80,000 0.68 0.66 0.65 0.64 0.63 $80,000-$100,000 0.71 0.70 0.69 0.68 0.67 Greater than $100,000 0.75 0.74 0.73 0.72 0.71
Students With Expected Aid=0 and Otherwise Average Characteristics
African Asian Other
Family Income White American American Latino/a Ethnic
Less than $18,000 0.08 0.07 0.07 0.07 0.06 $18,000-$24,000 0.09 0.09 0.08 0.08 0.07 $24,000-$30,000 0.11 0.10 0.10 0.09 0.09 $30,000-$36,000 0.12 0.12 0.11 0.11 0.10 $36,000-$42,000 0.14 0.14 0.13 0.13 0.12 $42,000-$50,000 0.17 0.16 0.15 0.15 0.14 $50,000-$60,000 0.19 0.19 0.18 0.17 0.16 $60,000-$80,000 0.22 0.21 0.20 0.20 0.19 $80,000-$100,000 0.25 0.24 0.24 0.23 0.22 Greater than $100,000 0.29 0.28 0.27 0.26 0.25
Students With Expected Aid=$4,000 and Otherwise Average Characteristics
African Asian Other
Family Income White American American Latino/a Ethnic
Less than $18,000 0.66 0.65 0.64 0.63 0.62 $18,000-$24,000 0.70 0.69 0.68 0.67 0.66 $24,000-$30,000 0.74 0.73 0.72 0.71 0.70 $30,000-$36,000 0.77 0.76 0.75 0.74 0.73 $36,000-$42,000 0.80 0.79 0.78 0.77 0.77 $42,000-$50,000 0.83 0.82 0.81 0.80 0.80 $50,000-$60,000 0.85 0.84 0.84 0.83 0.82 $60,000-$80,000 0.87 0.87 0.86 0.85 0.85 $80,000-$100,000 0.89 0.88 0.88 0.87 0.87 Greater than $100,000 0.91 0.90 0.90 0.89 0.89
Table 4: Probabilities of Enrollment Under Various Actual and Expected Aid Assumptions
Actual Total Expected Total Financial Aid
Financial Aid $0 $1,000 $2,000 $3,000 $4,000 $5,000 $6,000 $7,000 $8,000 $9,000 $10,000 $0 0.149 0.209 0.258 0.289 0.295 0.277 0.236 0.180 0.120 0.067 0.031 $1,000 0.230 0.374 0.438 0.474 0.482 0.460 0.410 0.335 0.243 0.151 0.077 $2,000 0.334 0.497 0.632 0.665 0.672 0.652 0.605 0.527 0.418 0.291 0.168 $3,000 0.454 0.619 0.739 0.816 0.821 0.807 0.772 0.710 0.613 0.477 0.317 $4,000 0.577 0.728 0.825 0.882 0.914 0.906 0.886 0.847 0.778 0.667 0.507 $5,000 0.692 0.817 0.889 0.928 0.948 0.959 0.949 0.928 0.889 0.818 0.694 $6,000 0.789 0.883 0.932 0.957 0.970 0.977 0.979 0.969 0.950 0.912 0.836 $7,000 0.862 0.928 0.960 0.976 0.983 0.987 0.988 0.988 0.980 0.962 0.922 $8,000 0.915 0.958 0.977 0.987 0.991 0.993 0.994 0.993 0.992 0.985 0.967 $9,000 0.949 0.976 0.988 0.993 0.995 0.996 0.997 0.997 0.996 0.994 0.987 $10,000 0.971 0.987 0.993 0.996 0.997 0.998 0.998 0.998 0.998 0.997 0.995
Avg. Pr(Enrollment) if:
Expected>Actual 0.58
Figure 1: The Structure of the College Decision-Making Process
Score Senders
(N=97,636)
Non-Applicants
(N=55,909)
Applicants
(N=41,727)
Enrollees
(N=17,200)
Non-Enrollees
(N=19,962)
Admitted
(N=37,162)
Rejected
(N=4,565)
20,691 (56%) admits applied for
financial aid, 13,096 (63%) of
them received some form of aid
Figure 2: Probability of Admission by Index Score and College of Application
Probability of Admission
Admissions Index Score (2*ACT+HSR%)
Engineering Liberal Arts
1 30 60 90 120 150 180 0 .25 .5 .75 1
Figure 3: Probability of Application by Home State Tuition
Responsiveness Given Changes in Expected Aid
Probability of Application
Avg. 4-Yr. Tuition in Non-Resident Students' Home State E(Aid)=$4k,.6 Pr(Admit) E(Aid)=$8k,.6 Pr(Admit) E(Aid)=$12k,.6 Pr(Admit) 1 3 5 7 9 0 .1 .2 .3 .4 .5 .6 .7 .8 .9 1
Note: Figure is for non-resident, African American males with probabilities of admission held constant at their mean value (.6) and expected aid values of $4,000, $8,000 and $12,0000. All other regressors held constant at their respective means.
Figure 4: Probability of Application by Home State Tuition
Increasing Expected Aid to Equate Application Probabilities of Low/Middle Income
Probability of Application
Avg. 4-Yr. Tuition in Non-Resident Students' Home State
E(Aid)=$4k,Income<$18k E(Aid)=$4k,Income>$100k E(Aid)=$4k,$42k<Income<$50k 1 3 5 7 9 0 .1 .2 .3 .4 .5 .6 .7 .8 .9 1
Note: Figure is for non-resident, African American males with probabilities of admission held constant at their mean value (.6). Expected aid values of $4,000 for all income groups (approximate average for black non-residents). All other regressors held constant at their respective means. Expected aid must be increased to $8,000 for students from middle-income families to equate their probabilities with those of low-income students.
Appendix
Table 1A: Probability of Financial Aid Given Application
Variable Odds Ratio Std. Err. z P>|z|
ACT Composite 0.95 0.00 -13.86 0.00 0.94 0.95 Female 0.96 0.03 -1.72 0.09 0.91 1.01 African Americans 0.49 0.04 -8.93 0.00 0.42 0.57 Asian Americans 1.00 0.06 -0.04 0.97 0.88 1.13 Latino/a 0.54 0.05 -7.32 0.00 0.46 0.64 Other Ethnicity 1.03 0.07 0.53 0.60 0.91 1.17
No. of Siblings < 21 Years Old 0.96 0.01 -3.72 0.00 0.94 0.98
From Big City 1.23 0.05 4.85 0.00 1.13 1.33
From Illinois 0.00 0.00 -6.76 0.00 0.00 0.02
From Other States 0.00 0.00 -6.85 0.00 0.00 0.02
Income $18,000-$24,000 1.26 0.11 2.64 0.01 1.06 1.49 Income $24,000-$30,000 1.30 0.11 3.18 0.00 1.11 1.53 Income $30,000-$36,000 1.55 0.12 5.45 0.00 1.32 1.81 Income $36,000-$42,000 1.64 0.13 6.44 0.00 1.41 1.90 Income $42,000-$50,000 1.73 0.12 7.78 0.00 1.51 1.99 Income $50,000-$60,000 1.86 0.12 9.29 0.00 1.63 2.12 Income $60,000-$80,000 1.88 0.12 10.14 0.00 1.67 2.13 Income $80,000-$100,000 2.42 0.16 13.65 0.00 2.13 2.74 Income > $100,000 3.23 0.20 18.74 0.00 2.86 3.66
Miles from Institution (in Hundreds) 1.04 0.02 2.28 0.02 1.00 1.07
Miles Squared 1.00 0.00 -1.37 0.17 1.00 1.00
Attended Public High School 0.72 0.15 -1.56 0.12 0.48 1.09
Attended Religious High School 0.80 0.17 -1.08 0.28 0.53 1.20
Attended Private High School 0.93 0.24 -0.29 0.77 0.56 1.53
Prefer College > 20,000 Students 0.93 0.03 -2.72 0.01 0.88 0.98
Aspire to Post Bach. Degree 1.01 0.03 0.39 0.69 0.96 1.07
Iowa Unemployment Rate 0.27 0.05 -7.68 0.00 0.19 0.38
Other States Unemployment Rate 0.95 0.04 -1.03 0.30 0.87 1.04
Iowa Population Growth 0.85 0.05 -2.75 0.01 0.76 0.96
Other States Population Growth 0.97 0.01 -5.13 0.00 0.95 0.98
Avg. 4 Year Public Tuition in Iowa 1.00 0.00 -2.42 0.02 1.00 1.00
Avg. 4 Year Public Tuition in Other States 1.00 0.00 1.90 0.06 1.00 1.00
1998 Cohort 0.52 0.05 -7.47 0.00 0.44 0.62 1999 Cohort 0.28 0.03 -12.25 0.00 0.23 0.34 2000 Cohort 0.12 0.01 -18.47 0.00 0.09 0.15 2001 Cohort 0.09 0.01 -19.59 0.00 0.07 0.12 Agriculture 1.17 0.21 0.88 0.38 0.82 1.67 Architecture 1.09 0.12 0.74 0.46 0.87 1.36 Business 1.02 0.05 0.32 0.75 0.93 1.11 Marketing 1.05 0.18 0.25 0.80 0.74 1.47 Communication 0.91 0.05 -1.64 0.10 0.81 1.02
Community & Personal Services 1.10 0.12 0.89 0.38 0.89 1.37
Computer Science 1.02 0.08 0.26 0.80 0.87 1.20
Cross Disciplinary Studies 1.49 0.46 1.30 0.20 0.81 2.74
Education 1.01 0.06 0.22 0.83 0.90 1.13
Odds Ratio 95% Confidence Interval