Performance Evaluation
of Signaling in the IP QoS System
Halina Tarasiuk
a, Jarosław Śliwiński
a, Piotr Arabas
b,c
, Przemysław Jaskóła
b,c,
and Witold Góralski
aa
Institute of Telecommunications, Warsaw University of Technology, Warsaw, Poland b
Research and Academic Computer Network (NASK), Warsaw, Poland c
Institute of Control and Computation Engineering, Warsaw University of Technology, Warsaw, Poland
Abstract—The IP QoS System is based on next generation networks (NGN) and differentiated services (DiffServ) archi-tectures. Its main part is a signaling system, which allows to send a request from a user to the system for establishing new connection with predefined quality of service assurance. In this paper we present trial results of the proposed signalling system. The experiments were performed to measure setup delay utilizing artificial call generator/analyzer. To obtain re-sults we assumed different distributions of interarrival and call holding times based on the literature. The results show that the setup delay strongly depends on access time to net-work devices, however also on the assumed call holding time models.
Keywords—IP QoS System, Quality of Service, signaling system.
1. Introduction
The aim of the paper1is to present the performance
evalu-ation of signaling in the IP QoS System. The system offers functionalities to assure quality of service (QoS) guarantees for selected flows. We assume that the system is based on differentiated services (DiffServ) [1] and next generation network (NGN) [2] architectures.
To assure QoS for selected flows the system supports five end-to-end QoS classes of service (CoSes) and one best effort CoS. The end-to-end CoSes for data transfer are as follows: telephony for voice over IP applications, RT in-teractivefor interactive games,MM streamingfor video on
demand, high throughput data for handling traffic
gener-ated by greedy TCP sources, and standard CoS (best
ef-fort). Moreover, in the network nodes we map end-to-end
telephony andRT interactive CoS to one aggregated real time CoS. For the purpose of defining end-to-end CoSes
concept, we follow [3] and [4].
We developed the system for a single IP domain. In this system, Internet service provider (ISP) can provision re-sources (that is link and buffer capacities) of the domain for each CoS in each network node. In each DiffServ IP router of the domain, an appropriate classifier classifies
1This work is partially funded by Polish Ministry of Science and
Higher Education, under contract number PBZ-MNiSW-02-II/2007 “Next Generation Services and Networks – technical, application and market aspects”.
packets of selected flows to CoSes based on DSCP field of the IP packet header. In addition, edge and core routers offer an appropriate set of mechanisms to support QoS for packet transfer.
In the IP QoS System, we distinguish three types of cesses, which operate in different time scales. These pro-cesses are:
– management, which manages routing and network provisioning,
– call setup/release, – packet transfer.
In this paper we focus on call setup and release processes. These processes are handled by so calledsignaling system,
which is the main part of the considered IP QoS System. The implemented and next evaluated signaling system con-sists of signaling entities and protocols developed for trans-port stratum of the NGN architecture. For handling signal-ing messages exchanged between functional entities of the architecture, during call setup or release process we uti-lize a dedicated CoS. We name this CoS assignaling. The
performance of signaling CoS as well as performances of
signaling protocols and entities impact on call setup/release delay and as a consequence they impact on user quality of experience (QoE). Following [5], recommended target values of acceptable by user call setup times for national IP network under normal load conditions are: mean de-lay = 5 s or for 95% of calls setup dede-lay should be not greater than 8 s. For international IP network, the target values are 8 s an 11 s, respectively.
In our approach, we tested signaling system assuming ar-tificial call generator with different call arrival and call holding models. For choosing adequate analytical models2
to test the signaling system, we selected from the
litera-ture a number of analytical assumptions, which are based on measurement results obtained in pilot or real networks. However, it is worth to mention that it is a lack of maturity of the signaling system solutions developed by the
opera-tors [6]. Therefore, the call arrival and holding time models
2This work is partially funded by Polish Ministry of Science and Higher
Education, under contract number N N517 385838 “Modeling and analysis of signaling in QoS Internet”.
follow only some pilot trials [7] or measurements from ser-vice operators in best effort networks. First approach for modeling call arrivals in IP QoS network is Poisson pro-cess [8] as for PSTN network. However, based on [9] we conclude that user behaviors differ in multi-service network comparing with PSTN. For example, [7] presents fractal analysis and modeling of voice over IP traffic in station-ary dedicated IP network with 800 users. Based on the obtained results authors conclude that more adequate ana-lytical model of call holding time is based on generalized Pareto distribution (GPD) than exponential distribution. In [10] and [11], authors focus on call analysis of stream-ing media, e.g., reality show and live news, and sport TV or access to e-teach, video, or audio servers. The call ar-rivals and call holding times are essentially different than those assumed for PSTN networks. For sake of simplic-ity, we tested the proposed signaling system for analyti-cal models considered in [7] for voice over IP applica-tion. In particular, we compared the system performance for call holding models based on exponential distribution and GPD.
In this paper, we continue our previous work on signaling systems as presented in [12], [13] and [14]. Comparing with that work, we show results for the signaling system based on NGN architecture. It is worth to mention that the system presented in [12]–[14] was developed simulta-neously with NGN architecture details. Moreover, we en-hance our trials with new analytical models for call arrival and holding times for voice over IP application.
The paper is organized as follows. Section 2 presents de-tails of signaling in IP QoS System. Section 3 describes trial topology. Section 4 presents the obtained trial results for performance evaluation of the signaling system. Sec-tion 5 concludes the paper.
2. Signaling in the IP QoS System
The IP QoS System follows the functional decomposition that is similar to the one defined in [15] for NGN archi-tecture. The system focuses strongly on management and control of resources, therefore most of its operations reside in the resource and admission control functions (RACF). In particular, from RACF we selected policy decision tional entity (PD-FE) and transport resource control func-tional entity (TRC-FE) as essential entities for QoS control. In the subsections below, first we provide an overview of the architecture and then we show typical signaling scenar-ios when system handles new call.
2.1. Architecture Overview
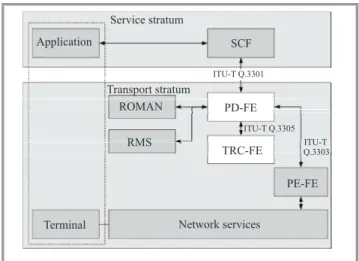
The architecture of the IP QoS System follows the isolation of functions into service and transport strata. In Fig. 1, we show all considered functional entities mapped over the par-ticular strata. Moreover, the figure indicates the interfaces between particular entities and provides the recommenda-tions defining those interfaces.
Fig. 1. Functional architecture of the IP QoS System.
In theservice stratum, there are 2 entities:
• Applicationis available to the end use. We assume that it operates in 2 processes:
– first it uses application signaling to collect all necessary information about interested parties, – then it preforms communication by sending and
receiving the user’s data.
• Service control functions(SCF) is a set of services, which are essential to establish a session for the ap-plication, e.g., they could cover user registry, authen-tication and accounting. Nevertheless, for successful integration with the IP QoS System, the SCF must communicate with elements available in the transport stratum.
In thetransport stratum, we distinguish following entities:
• Policy decision functional entity(PD-FE) plays the role of the connecting hub between different elements of the RACF. Especially, it is a gateway from service stratum for SCF. This entity routes all messages and performs final decision about acceptance or rejection of the requests.
• Transport resource control functional entity
(TRC-FE) is responsible for abstract representation of the resources available in the network. Moreover, it performs the connection admission control and it also maintains the database of accepted connections.
• Policy enforcement functional entity (PE-FE) di-rectly interacts with network devices. It is able to translate requests into a set of instructions known by the device. For example, it is able to introduce traffic conditioning into the edge routers or packet schedul-ing configuration over network interfaces.
• Routing management (ROMAN) establishes paths in the network between pairs of access networks. Moreover, for each path it assigns the amount of sources which are available for traffic with QoS
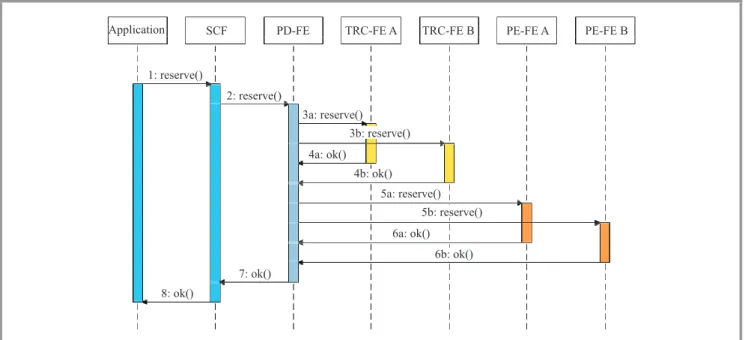
re-Fig. 2. Message sequence diagram for establishing a session.
quirements. Notice that this entity operates in the long time scale mainly performing management op-erations.
• Resource management subsystem (RMS) is re-sponsible for mapping of end-to-end QoS require-ments into the resources available in the network. In particular, these are weights assigned to the sched-ulers and buffer sizes. Similar to the ROMAN, this entity performs management operations, which are independent of call setups and call releases.
In the proposed architecture, we assume that the network consists only of a singleDiffServautonomous system. This
means that the resources are split among a set of CoSes. Moreover, the traffic introduced into the network is condi-tioned on the edges, while new connections are controlled by an admission control function.
Notice that the Q-series interfaces that are defined for the NGN architecture in most cases use DIAMETER proto-col for transferring signaling messages. However DIAME-TER is well defined and standardized, for the purpose of simpler implementation we mapped the structures into the specification language for ICE (SLICE). Those structures were used for implementation of particular signaling nodes, which were built upon the ICE middleware.
2.2. Call Handling Scenarios
The IP QoS System handles 2 main signaling scenarios: – establishing a session (call setup),
– closing a session (call release).
Below, we present the exemplary message sequence dia-grams for both scenarios for the following topology:
• The session is established between two users A and B. Each user is located in different access net-work, which are connected to the core network using edge routers. Consequently, the traffic between users always crosses 2 edge routers and the routers in the core network.
• The deployment of the system assumes that each ac-cess network is handled by one TRC-FE and one PE-FE server. For example, operations for access network A are performed by TRC-FE A server and PE-FE A server.
Establishing a session. Figure 2 depicts the message ex-change between entities in the IP QoS System for estab-lishing a session. We distinguish the following steps.
1. Initially, the user A decides to establish a session to the user B. This request is translated by the appli-cation into a reserve message which is sent to the
SCF.
2. The SCF locates user B and performs application level negotiation, e.g., it establishes a codec sup-ported by both sides. Moreover, it must resolve all in-formation required to classify the data streams in the network, i.e., IP addresses, transport protocol type (UDP/TCP) and port numbers. When this process is complete, the SCF sendsreserve message to the
PD-FE. Note that the signature of thereserve
mes-sage may be different in each step. Even though they share the common name, they correspond to different interfaces.
3. The PD-FE verifies that description of the session if the message is complete. Then it decomposes a ses-sion into multiple connection structures; one
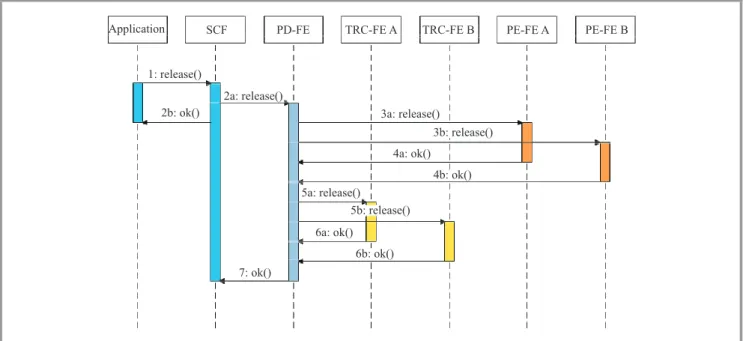
connec-Fig. 3. Message sequence diagram for closing a session.
tion structure represents a single data stream to be es-tablished in the network. Before the handling of the connection starts, the PD-FE must map them into appropriate points of control. In case of the IP QoS System, the point of control is mapped directly to the ingress point of the network, i.e., all traffic generated by users belonging to single edge router share the same control point. In our example, we have 2 users attached to different edge routers. Therefore, the sce-nario will have 2 sets of control points: {TRC-FE A, PE-FE A}and{TRC-FE B, PE-FE B}. Steps num-ber 3a and 3b cover the sending of reserve messages to the TRC FE elements.
4. TRC-FE elements verify that connections are unique and then they perform admission control function. If the result is positive, then they perform reservation by reducing the amount of available resources for given control point. Moreover, they store the connection information as in the IP QoS System, state of the connection is managed by TRC-FE elements. In our example, we assume that the result is positive and that they return theokmessage to the PD-FE.
5. The PD-FE performs a synchronization upon the re-sult of TRC-FE operation. When all responses are received, it performs the second part of the connec-tion handling, i.e., it sends the reserve message to
the PE-FE elements.
6. PE-FE elements communicate with edge routers and they enable traffic conditioning mechanisms for ac-cepted connections. They configure policing, shaping and marking mechanisms, as necessary for particular connections. The result is returned to the PD-FE; in our example, theokmessages are sent.
7. At this point the resources in the network are re-served. The PD-FE synchronizes the responses for particular connections from PE-FE elements, then merges back connection into a session. This results in a response withok message to the SCF.
8. The SCF forwards the response to the application. Note that the SCF is responsible for refreshing the soft state of the session by periodically sending therefreshmessages
to the PD-FE. We do not show this exchange in our example as it seems to be straightforward.
Closing a session. Figure 3 depicts the message exchange between entities in the IP QoS System for closing a session. The steps for closing a session are similar as in case of establishing a session, which are:
1. User A decides to close a session with user B. In this case, the application sends areleasemessage to
the SCF.
2. The SCF verifies that given session is indeed active in the network. Recall that SCF maintains soft state of the sessions, therefore it has a knowledge whether the session is active or not. The SCF removes the ses-sion from the list of active sesses-sions and sends confir-mation to the application: ok message. At the same
time it sendsreleasemessage to the PD-FE. Note that
the signature of thereleasemessage may be different
in each step. Even though they share the common name, they correspond to different interfaces. 3. The PD-FE verifies that description of the session
in the message is complete. Then it decomposes a session into multiple connections; one connection represents a single data stream to be established in
the network. Each connection is mapped into a set of control points, e.g., {TRC-FE A, PE-FE A} and
{TRC-FE B, PE-FE B}. Steps number 3a and 3b cover the sending ofreleasemessages to the PE-FE
elements.
4. PE-FE elements communicate with edge routers and they disable traffic conditioning mechanisms which were prepared previously for particular connections. The result is returned to the PD FE:okmessages are
sent.
5. The PD-FE performs a synchronization upon the re-sult of PE-FE operation. When all responses are received, it performs the second part of the connec-tion handling, i.e., it sends thereleasemessage to the
TRC-FE elements.
6. TRC-FE elements release the resources. Moreover, they remove the connection information from lo-cal storage. We assume that the result is positive (there are no errors); they return the ok message to
the PD-FE.
7. At this point the resources in the network are re-leased. The PD-FE synchronizes the responses for particular connections from TRC-FE elements, then merges back connections into a session. This results in a response withok message to the SCF.
Note that in case of closing a session, neither application or SCF should wait for receiving a response. In fact, the return messages are just informative. For application the session is closed almost immediately, while SCF removes the session information upon reception of first release message.
3. Trial Environment
In this section we present details about call genera-tor/analyzer utilised in the trials and trial topology.
3.1. Call Generator/Analyzer
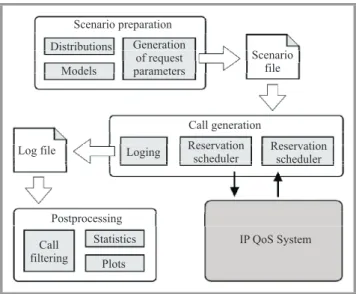
To allow automatic tests of signaling subsystem perfor-mance call generator/analyzer was implemented. It con-sists of three programs: one for off-line preparation of experiment scenarios, next carrying out experiment itself, i.e., sending requests to the system and collecting data, and the last for postprocessing of results. The reason for per-forming most operations off-line, was to minimize a delay in the call generation process. As the aim of experiments was to test the signaling system, only call setup and release requests were sent to the system and no data between appli-cation hosts were transmitted. The architecture of the call generator is presented in the Fig. 4.
Various characteristics of different services were modeled by the set of distributions used for generating call inter-arrival times and durations. There are two groups of mod-els implemented in the generator. The first one involves simple models in which inter-arrivals and durations are
Fig. 4. Call generator architecture.
generated independently using, e.g., exponential or GPD. The second group is represented by a generalized Markov modulated Poisson process (MPPP), brought into play to prepare scenarios with correlations between events. While using Pareto distribution helps to introduce some bursti-ness as observed in [7], [16], and [17] the last model helps in preparation of more complex scenarios as suggested in [18] and [9].
The call generating program implements two schedulers serving reservation and release requests via independent polls of threads to avoid blocking and reveal full perfor-mance of the system. For the same reason logging is post-poned to the end of program operation. The communica-tion with the IP QoS System (precisely SCF) is provided by standard user interface using ICE middleware.
The postprocessing of previously collected logs allows to filter data and prepare statistics and various types of plots (time-plots, histogram etc.) without influencing the call generating process.
Fig. 5. Trial network topology with call generator and IP QoS System.
Figure 5 shows the topology of the trial network in which presented tests were performed. The trial network consists of two core routers (CR1, CR2 that are Cisco 7201) and two edge routers (ER1 – Cisco 2811 and ER2 – Cisco 1801). In addition, the network uses two Cisco Catalyst 2960G switches (S1 and S2) connected to the edge routers ER1 and ER2. The IP QoS System is connected to the trial core
network. It is responsible for resource provisioning as well as call handling processes.
Call generator/analyzer connects through the network to the IP QoS System in order to generate calls and to make measurements of the setup time in the signaling system. The server with the IP QoS System is running an Fe-dora 12 operating system on a computer with 3 GHz Intelr
Pentiumr4 CPU.
4. Performance Evaluation of the
Signaling System
The aim of experiments was to test performance of the IP QoS System in conditions similar to those occurring in op-erational network and to identify which elements introduce highest delays. Two sets of experiments were performed. In the first one, all system modules except routers were em-ployed. In the second experiment, fully configured system composed of all software modules and network equipment. In this way, it was possible to assess the time necessary to configure edge routers, which turned out to be the main component of total call setup delay.
The scenarios were prepared for end-to-end telephony CoS based on measurement results of VoIP call load, from [7], scaled to the range which allows to estimate the perfor-mance limit. The process of call generation used expo-nential distribution for interarrival times and expoexpo-nential distribution or GPD for call holding times. No data traffic was generated during experiments as only signaling sys-tem was tested, however all signaling syssys-tem functionali-ties, including admission control function, were operating. Consequently all requests were processed, stored in database, etc. and sufficient resources (i.e. bandwidth) for telephony CoS were provided. The parameters of experi-ments are presented in Table 1 and Table 2.
Table 1
Parameters of experiments with exponential call holding times
Variant of the Call intensity Mean holding Call request experiment range [1/s] time [s] [kbit/s] Without routers 1–10 114.27 8 configuration
Full – with routers
0.25–1.25 114.27 8 configuration
Table 2
Parameters of experiments with exponential call interarrival time
Variant of the
Call Holding time – Call experiment
intensity GPD parameters request range shape scale resulting
[kbit/s] [1/s] (k) (s) mean [s] Without routers 1–10 –0.39 69.33 49.88 8 configuration
Full – with routers
0.25–1.25 –0.39 69.33 49.88 8 configuration
Table 1 presents parameters of experiments with Poissonian interarrival time and exponential call holding times. Table 2 presents parameters of experiments with Poissonian call interarrival time and GPD call interarrival time.
It is worth to mention that according to [7] parameters pre-sented in Table 2 better approximate measurement results than those presented in Table 1. As we mentioned above, the aim of trial is also check an impact of the assumed model on the signaling system performance.
The referenced work [7] provided study of VoIP calls for corporate network of approximately 800 subscribers which generated 0.164 call/s. The scenarios used during tests have call intensity significantly up-scaled to test the system performance, while holding times are generated in a way conformant to observations of authors in order to retain typical holding time characteristics.
For each call the system was requested for resources for single VoIP connection, the resources in the IP QoS System were provisioned to allow submit all calls. No calls were reject.
To gather amount of data sufficient for analyzis calls were generated during 32 minutes.
4.1. Experiments without Routers
Two series of ten experiments were performed. As it was previously mentioned their aim was to test performance of the system alone without communication with routers which we expect is so time consuming that may hinder be-havior of the software. Such a procedure allows to validate correctness of the implementation and to find the limit of the system performance.
Fig. 6. Call setup times, exponential interarrival times, call intensity 4 call/s, holding times exponential (a) and GPD (b).
Characteristics in Fig. 6 show call setup times measured during experiments with moderate intensity (4 call/s) and exponential holding times (a graph) and GPD holding times (b graph).
Next, two characteristics in Fig. 7 show call setup times measured during experiments with high intensity (9 call/s) and holding times generated according to exponential (a graph) and GPD (b graph) distributions.
In the case when calls are generated with moderate inten-sity some variation of the service times may be observed in both (exponential and GPD holding time) cases, however
Fig. 7. Call setup times, exponential interarrival times, call intensity 9 call/s, holding times exponential (a) and GPD (b).
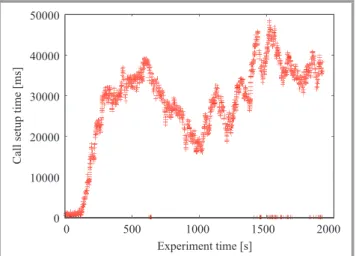
the overall system performance may be considered suffi-cient. When calls are generated with higher rate the graph becomes more rugged and call setup time increases sig-nificantly to the level of seconds. Such increase may be attributed mostly to queuing request at database and rate of 9 calls/s may be considered as maximum for the sys-tem. The argument for this may be also in characteristics in Fig. 8 presenting performance of the system in scenario
Fig. 8. Call setup times, exponential interarrival times, call in-tensity 10 call/s, GPD holding times – case of massive congestion.
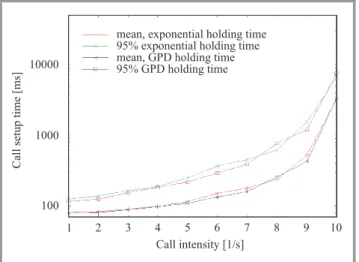
Fig. 9. Call setup times versus call intensity.
with rate of 10 call/s. The significant rise not only in max-imum but also minmax-imum call setup time suggests massive queuing occurring in one of the IP QoS System elements, possibly database holding reservation list.
To summarize results of experiments a graph showing call setup time versus call intensity (Fig. 9) was prepared. Two lines for each distribution are presented – one for mean service time and another for 95% – the value much better describing user perception of the system performance. As we observe the characteristics for both models of hold-ing times are very similar and they are below the target values of setup times.
4.2. Experiments with Router Configuration
Finally similar set of experiments was performed in fully configured signalling system, i.e., with configuring of the routers. The intensities were scaled down as communica-tion time was taken into account, the rest of parameters and procedure following these described previously. Character-istics in Fig. 10 show call setup times for experiments with moderate rate which in this case is 0.25 call/s.
Fig. 10. Call setup times, exponential interarrival times, call intensity 0.25 call/s, holding times exponential (a) and GPD (b).
Next set of graphs (Fig. 11) represents situation of higher load, close to maximum which can be served in acceptable time.
Fig. 11. Call setup times, exponential interarrival times, call intensity 0.75 call/s, holding times exponential (a) and GPD (b).
In these examples some call setup times exceed 2s which is close to the value typically perceived as acceptable for users, so the system limit lays approximately between 0.75 and 1 call/s. As an argument for this another graph,
showing heavy load condition at intensity of 1.25 call/s, is presented in Fig. 12.
Fig. 12. Call setup times, exponential interarrival times, call intensity 1.25 call/s, GPD holding times.
Rapid grow of service time beyond values observed in ex-amples lacking router configuration suggests that requests are queued in the router access module due to the overload of the control software in the router. It is important to remind that performance limit of the system when router communication was excluded was approximately 9 times higher so the limitation visible in Fig. 12 can be attributed only to the routers. To systematize this findings, character-istics showing average and 95% of call setup time versus call intensity are presented in Fig. 13.
Fig. 13. Call setup times versus call intensity.
As we can see an impact of holding times models play an essential role on the obtained results in this scenario. Moreover, for call intensity above 1 call/s the characteristics for GPD holding time model are above the target values. On the other hand for exponential holding time model are in the acceptance area. So, we observe an impact of the assumed call holding time model on the obtained characteristics.
5. Conclusions
The experiments allowed to evaluate the system perfor-mance and to identify elements contributing the most to the experienced delay. The overall performance of fully configured system (0.75 call/s) may be considered low, however it must be stated that it is significantly higher than necessary to serve requests generated by 800 subscribers in [3]. Considering that each edge router can be config-ured in parallel, the system capacity may be scaled up by partitioning each large access network into a number of smaller ones (analogous as in radio access of the mobile networks). Furthermore, the main delay is connected with configuring routers (around 500 ms under moderate load), so finding more efficient equipment is necessary for real life application. Another source of delay (due to queuing) is database, which may be optimized with help of well-known techniques. The results show also the impact of the assumed call holding time models on setup delay in some scenarios.
Acknowledgement
We would like especially thank all the partners involved in the project for their support as well as for their work on developing the IP QoS System.
References
[1] Y. Bernet et al., “An Informal Management Model for DiffServ Routers”, Internet RFC 3290, May 2002.
[2] “Functional Requirements And Architecture Of Next Generation Networks”, ITU-T Rec. Y.2012, 04/2010.
[3] J. Babiarz et al., “Configuration Guidelines for DiffServ Service
Classes”, Internet RFC 4594, Aug. 2006.
[4] K. Chan, J. Babiarz, and F. Baker, “Aggregation of Diffserv Service Classes”, Internet RFC 5127, Feb.2008.
[5] “Network Post-selection Delay in PSTN/ISDN Networks Using In-ternet Telephony for a Portion of the Connection”, ITU-T Rec. E.671, March 2000.
[6] T. Aoyama, “A new generation network: Beyond the Internet and NGN”, ITU-T Kaleidoscope, IEEE Commun. Magazine, vol. 47, no. 9, pp. 82–87, 2009.
[7] T. D. Dang, B. Sonkoly, and S. Molnar, “Fractal analysis and modeling of VoIP traffic”, in Proc. 11th Int. Telecommun. Netw. Strategy Planning Symp. NETWORKS 2004, Vienna, Austria, 2004, pp. 123–130.
[8] J. W. Roberts, “Traffic theory and the Internet”, IEEE Commun. Mag., Jan. 2001, pp. 94–99.
[9] W. Chenet al., “Modeling VoIP call holding times for
telecommu-nications”,IEEE Network, Nov/Dec, pp. 22–28, 2007.
[10] C. Costaet al., “Analyzing client interactivity in streaming media”, inProc. WWW 2004, New York, USA, 2004, pp. 534–543. [11] E. Veloso et al., “A hierarchical characterization of a live
stream-ing media workload”,IEEE/ACM Trans. Networking, vol. 14, no. 1,
pp. 133–146, 2006.
[12] H. Tarasiuket al., “Designing the simulative evaluation of an
archi-tecture for supporting QoS on a large scale”, inProc. QoSim 2008,
Marseille, France, 2008.
[13] J. Mongay Batalla, J. Śliwiński, H. Tarasiuk, and W. Burakowski, “Impact of signaling system performance on QoE in next generation networks”,J. Telecommun. Inform. Technol., no. 4, 2009.
[14] E. Mingozziet al., “EuQoS: end-to-end quality of service over
het-erogeneous networks”,Computer Commun., vol. 32, iss. 12, Elsevier,
2009.
[15] “Resource and Admission Control Functions in Next Generation Net-works”, ITU-T Rec. Y.2111, Nov. 2008.
[16] A. Brampton et al., “Characterising user interactivity for sports video-on-demand”, inProc. 17th Int. Worksh. Netw. Oper. Sys. Sup. Dig. Audio Video, Urbana-Champaign NOSSDAV 2007, IL, USA,
ACM, 2007.
[17] Sh. Jin and A. Bestavros, “Generating internet streaming media objects and workloads”, inWeb Content Delivery, S. T. Chanson, X. Tang, and J. Xu, Eds. Springer, 2005.
[18] T. Qiuet al., “Modelling user activities in a large IPTV system”, in Proc. IMC’09, Chicago, Illinois, USA, ACM, 2009, pp. 430–442.
Piotr Arabas received his Ph.D. in Computer Science from the Warsaw University of Technology, Poland, in 2004. Currently he is an Assistant Professor at Institute of Con-trol and Computation Engineer-ing at the Warsaw University of Technology. Since 2002 with Research and Academic Com-puter Network (NASK). His re-search area focuses on modeling computer networks, pre-dictive control and hierarchical systems.
E-mail: [email protected]
Institute of Control and Computation Engineering Warsaw University of Technology
Nowowiejska st 15/19 00-665 Warsaw, Poland E-mail: [email protected]
Research and Academic Computer Network (NASK) Wąwozowa st 18
02-796 Warsaw, Poland
Przemysław Jaskóła received his M.Sc. in Computer Science from the Warsaw University of Technology, Poland, in 1999. Currently he is a Ph.D. stu-dent in the Institute of Con-trol and Computation Engineer-ing at the Warsaw University of Technology. Since 2005 with Research and Academic Com-puter Network (NASK). His re-search area focuses on hierarchical optimization and com-puter networks.
E-mail: [email protected]
Research and Academic Computer Network (NASK) Wąwozowa st 18
02-796 Warsaw, Poland
Witold Góralski was born in 1985. He graduate The Faculty of Electronics and Information Technology (2009). Since 2009 he is Ph.D. student on The Faculty of Electronics and In-formation Technology. His re-search interest focus mainly on QoS, testbeds and queueing mechanisms.
E-mail: [email protected] Warsaw University of Technology Nowowiejska st 15/19
00-665 Warsaw, Poland
Halina Tarasiuk, Jarosław Śliwiński – for biographies, see this issue, p. 10.