Asian Social Science; Vol. 9, No. 15; 2013 ISSN 1911-2017 E-ISSN 1911-2025 Published by Canadian Center of Science and Education
Factor Retention Decisions in Exploratory Factor Analysis Results: A
Study Type of Knowledge Management Process at Malaysian
University Libraries
Che Rusuli M. s.', Tasmin R.', Takala J . ~ & Norazlin H . ~ 1
Department of Production and Operation, Faculty of Technology Management and Business, Universiti Tun Hussein Onn Malaysia, Batu Pahat, Malaysia
Department of Production, Faculty of Technology, University of Vaasa, City of Vaasa, Finland 3
Department of Information Technology, Center For Diploma Studies, Universiti Tun Hussein Onn Malaysia, Batu Pahat, Malaysia
Correspondence: Che Rusuli M. S., Department of Production and Operation, Faculty of Technology Management and Business, Universiti Tun Hussein Onn Malaysia, Batu Pahat 86400, Malaysia. E-mail: [email protected]
Received: July 24,2013 Accepted: August 30,2013 Online Published: October 29,2013 doi: 10.5539/ass.v9nl5p227 URL: http://dx.doi.org/ass.v9n15p227
Abstract
Structural equation modeling (SEM) is a versatile statistical modeling tool which uses in the social sciences research. Recently, in Library and Information Science (LIS) environment, structural equation modeling has gained popularity across many disciplines, due to its generality and flexibility. Its estimation techniques, modeling capabilities and breadth of application are expanding rapidly. This paper reported a structural equation modeling through an Exploratory Factor Analysis (EFA) result, which involves 300 lead users at six selected Malaysian university libraries through survey. The decision of how many factors to retain is a critical component of exploratory factor analysis. Evidence is presented that parallel analysis is one of the most accurate factor retention methods. SPSS 20 was utilized to analyze the factor analysis data. In this regards, the results of EFA could provide empirical evidence of each hypotheses construct. It is hoped that the EFA results could be used to level Confirmatory Factor Analysis (CFA) to perform full Structural Equation Modeling.
Keywords: structural equation modeling, exploratory factor analysis, confirmatory factor analysis (CFA), library and information science
1. Introduction
Structural Equation Modeling (SEM) is an extension of the general linear model (GLM) that enables a researcher to test a set of regression equation simultaneously. Structural Equation Modeling (SEM) is a technique used for specifying and estimating models of linear relationships among variables (Hair, Black, Babin, Anderson & Tatham, 2006; MacCallum & Austin, 2000). More specifically, various theoretical models can be tested in SEM that hypothesis how sets of variables define constructs and how these constructs are related to each other (Schumacker & Lomax, 2004). The use of structural equation modeling (SEM) techniques in this study is the most suitable way to evaluate the fit of the proposed model (Hair et al., 2006; MacCallum & Austin, 2000; Schurnacker & Lomax, 2004). In addition, Hair et al. stated that SEM is a "new analytical tool" which in the recent decade, gains a wider acceptance to be "the dominant multivariate technique" in academic and social science studies. In fact, SEM is also a technique which has many advantageous capabilities such as SEM is able to estimate multiple and interrelated dependence relationships; it is able to characterize unobserved conceptions in these relationships; it is capable to correct measurement errors in estimation processes; and it is capable to identify a model describes the whole set of relationships. This research aimed to utilize SEM to evaluate KM processes type measurement through EFA for each of one process that could be retained. One major reason for SEM being applied in this study is due to its ability to execute simultaneous multiple assessments comprehensively (Hair et al., 2006). In addition to, Schumacker and Lomax (2004) note that researchers which use SEM are becoming more aware of the need to use multiple observed variables to better understand their area. Factor analvsis is a statistical a ~ ~ r o a c h e s that can be used to analvzed interrelationshi~s among large number of
www.ccsenet.orglass Asian Social Science Vol. 9, No. 15; 2013
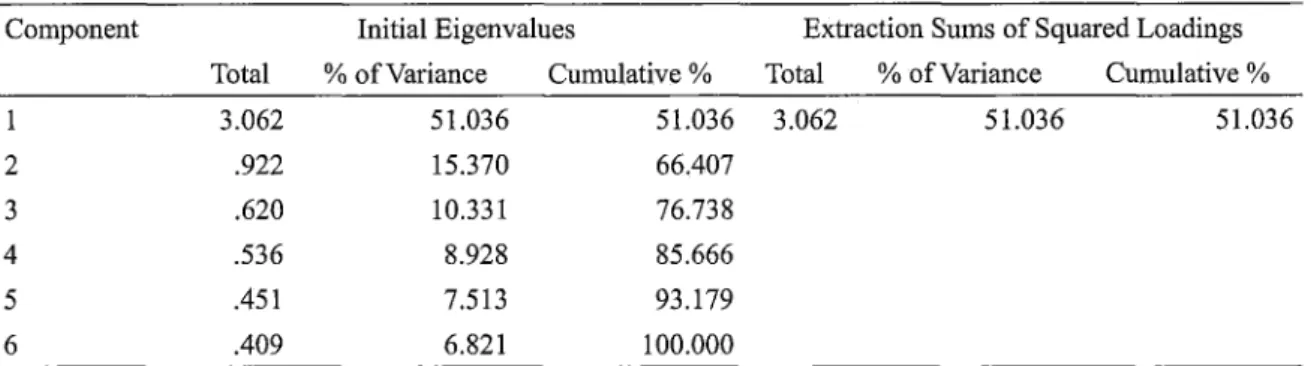
Table 20. Total variance explained for variables of the library users' satisfaction factor
Component Initial Eigenvalues Extraction Sums of Squared Loadings
Total % of Variance Cumulative % Total % of Variance Cumulative %
1 3.062 51.036 51.036 3.062 51.036 51.036
3 .620 10.331 76.738
4 .536 8.928 85.666
5 .45 1 7.513 93.179
6 .409 6.821 100.000
Extraction Method: Principal Component Analysis.
All variables of knowledge preserving factor have loading value higher than 0.50 as shown in Table 21. Therefore, these values indicate that they are highly interrelated with each other.
Table 2 1. Component matrix of the library users' satisfaction variables
Component 1 LUS 1 LUS2 LUS3 LUSS .775 LUS6 .581
Extraction Method: Principal Component Analysis.
4. Discussion
Afier presenting the analyses, three important results have been shown. Firstly, Kaiser-Meyer-Olkin (KMO) measures of sampling adequacy for knowledge creation, knowledge acquisition, knowledge capture, knowledge sharing, knowledge record, knowledge preserving and library users' satisfaction factors) are within the required range. Therefore, the KMO value of 0.70 and above indicates strong partial correlation and is suitable for factor analysis (Hair et al., 2006). The KMO values are 0.735, 0.767, 0.769, 0.826, 0.869, 0.799, and 0.821 for knowledge creation, knowledge acquisition, knowledge capture, knowledge sharing, knowledge record, knowledge preserving and library users' satisfaction factors respectively. The highest KMO value is 0.869 (knowledge record factor). The lowest KMO value is 0.735 (knowledge creation factor). Thus, all factors will be included in the further analysis. All Bartlett's tests of Sphericity have shown good results. All small values which less than 0.05 indicate that there are significant relationships among variables (Hair et al., 2006; Tabachnick & Fidell, 2007). Lastly, EFA for all factors (knowledge creation, knowledge acquisition, knowledge capture, knowledge sharing, knowledge record, knowledge preserving, and library users' satisfaction factors) attain good loadings to become a factor retention. The value of loadings for all indicators are above 0.50 (good level), except for one indicator. There is indicator of KSh5 (0.405) from the knowledge sharing process factor. This indicator was excluded from the subsequent SEM analysis due to overlaps factor loading (less than 0.5). The low factor loadings indicate that the explained variance is much less in the measure than the error variance. In these instances, the researcher or analyst requires that exploratory factor analysis take into confirmatory approach, that is, access the degree to which data meet the expected structure of the analyst.
Acknowledgements
The authors would like to acknowledge their supervisor for the guidance in preparing this paper. The authors are also indebted to prior literature research that has been made related to Knowledge Management (KM) area