DESIGN A SOLAR HYBRID
AIR CONDITIONING COMPRESSOR
SYSTEM
by
Thomas Chin Jun Yen
14982
Dissertation submitted in partial fulfilment of
the requirements for the
Bachelor of Engineering (Hons)
(Mechanical)
JANUARY 2015
Universiti Teknologi PETRONAS
Bandar Seri Iskandar
31750 Tronoh
ii
CERTIFICATION OF APPROVAL
Design a Solar Hybrid Air Conditioning Compressor System
by
Thomas Chin Jun Yen 14982
A project dissertation submitted to the Mechanical Engineering Programme
Universiti Teknologi PETRONAS in partial fulfilment of the requirement for the
BACHELOR OF ENGINEERING (Hons) (MECHANICAL)
Approved by,
_______________________ (Dr. Morteza Khalaji Assadi)
UNIVERSITI TEKNOLOGI PETRONAS TRONOH, PERAK
iii
CERTIFICATION OF ORIGINALITY
This is to certify that I am responsible for the work submitted in this project, that the original work is my own except as specified in the references and acknowledgements, and that the original work contained herein have not been undertaken or done by unspecified sources or persons.
_______________________ THOMAS CHIN JUN YEN
iv
ABSTRACT
This thesis presents the investigation into the feasibility of solar assisted vapour compression air conditioning system in providing thermal comfort in Malaysia. Conventional vapour compression air conditioning system consumes large amount of energy which is a clear disadvantage considering the high fuel price and electric tariff. Therefore, this research was intended to develop and integrate solar hybrid system into conventional air conditioning system which provides the same cooling load with considerably less electricity demand. In addition, Microsoft Excel spreadsheet is also prepared to facilitate the calculation of refrigerant temperature and energy saving of the system. DC compressor and evacuated tube solar compressor is introduced to assist the electric compressor in compressing the refrigerant, effectively reducing the air conditioning electricity consumption by up to 45%. Meanwhile, during night time, energy saving is only contributed by the DC compressor which reduces electricity consumption by up to 25%. The development and utilization of solar energy reduces the dependency on energy generation from fossil fuel which emits greenhouse gases and worsen the global warming while also pushing Malaysia one step closer to their aim in reducing CO₂ emissions and harnessing renewable energy. Malaysia as a tropical country with average solar radiation of 4500Wh/m² per day, has endless potential in solar energy (Borhanazad, 2013). This project provides technical overview which involves the study of solar energy conversion system and viability of solar hybrid vapour compression air conditioning system under Malaysia climate.
v
ACKNOWLEDGEMENTS
In completing my Final Year Project, it is sufficed to say that it has taught me valuable insights from the difficulties and struggles that I have encountered. With that, I would like express my heartiest gratitude to all relevant personnel that has assisted me throughout the project.
First and foremost, I would like to express my gratitude towards my supervisor, Dr. Morteza Khalaji Assadi who has been the thrust of this entire project. Your lessons and aid have surely provided me with a clear guidance and understanding along the way. Besides that, I would like to thank my examiner, Dr. Syed Ihtsham Ul Haq Gilani for his critical comments and evaluations given during the completion of this study. I would not be able to complete the study without their assistance and warm hospitality. I would also like to extend my appreciation to all my family members, especially my father, Chin Wui Hon and mother, Chong Kiaw Lan for being very supportive and caring all the time.
Last of all, thanks to all my friends for all the support and encouragement that has enlightened me to succeed brilliantly in my study. All of the contribution, knowledge and experience are very much appreciated. Above all, such special traits as these can hardly be gained elsewhere, and shall be treasured and used as guidance in the complexity of work, society and corporate life near future.
vi
TABLE OF CONTENTS
CERTIFICATION OF APPROVAL ... ii
CERTIFICATION OF ORIGINALITY ... iii
ABSTRACT ... iv
ACKNOWLEDGEMENTS ... v
TABLE OF CONTENTS ... vi
LIST OF FIGURES ... vii
LIST OF TABLES ... ix
ABBREVIATIONS AND NOMENCLATURES ... x
CHAPTER 1 ... 1
INTRODUCTION ... 1
1.1 BACKGROUND ... 1
1.1.1 Malaysia Renewable Energy Target ... 2
1.1.2 Potential of Solar Energy in Malaysia ... 3
1.2 Problem Statement ... 4
1.3 Objectives ... 4
1.4 Scope of Study ... 4
CHAPTER 2 ... 5
LITERATURE REVIEW... 5
2.1 Solar Hybrid Air Conditioning Compressor System ... 5
2.2 Refrigeration Cycle ... 6
2.3 Pressure-Enthalpy Diagram ... 7
2.4 Temperature-Entropy Diagram ... 7
2.5 Evacuated Tube Solar Collector ... 8
2.6 Type of Evacuated Solar Collector ... 11
2.7 Direct Current (DC) Compressor ... 12
CHAPTER 3 ... 14
METHODOLOGY ... 14
3.1 Research Methodology ... 14
3.2 Gantt Chart ... 16
3.3 Key Project Milestone ... 17
CHAPTER 4 ... 18
vii
4.1 Refrigeration Cycle Parameter ... 18
4.2 Calculation on Air Conditioning Performance ... 19
4.3 Solar Hybrid Vapour Compression Refrigeration Cycle... 20
4.4 Calculation on Condenser Sizing ... 21
4.5 Calculation on Solar Compressor Energy Saving Performance ... 23
4.6 Solar Hybrid Air Conditioning System Energy Saving Performance ... 26
4.7 Justification for Evacuated Tube Solar Compressor Position ... 28
4.8 ANSYS Simulation ... 32
4.9 Discussion on Calculation: ... 37
4.10 Performance comparison with manufacturer’s data sheet ... 42
4.11 Cost Analysis ... 44
CHAPTER 5 ... 51
CONCLUSION AND RECOMMENDATION ... 51
REFERENCES ... 52
APPENDICES ... 56
Appendix 1: R22 Superheated Vapour – Constant Pressure Table ... 56
Appendix 2: U-tube Evacuated tube solar collector product data sheet ... 57
Appendix 3: Microsoft Excel Calculation Spreadsheet (Model 1 – 12PM) ... 58
LIST OF FIGURES
FIGURE 1. Malaysia Annual Average Daily Solar Radiation (MJ/m² per day) (Borhanazad, 2013) ... 3FIGURE 2. Malaysia Monthly Average Daily Solar Radiation (kWh/m² per day) (Borhanazad, 2013) ... 3
FIGURE 3. Solar Air Conditioning System (Kalkan, 2011) ... 5
FIGURE 4. P-h diagram of vapour compression refrigeration cycle (Demma, 2005) 7 FIGURE 5. T-s diagram of vapour compression refrigeration cycle (Demma, 2005) 8 FIGURE 6. Thermal network for U-tube evacuated solar collector ... 10
viii
FIGURE 8. Air conditioning compressor performance comparison chart (Lamanna,
2010) ... 13
FIGURE 9. Methodology Flow ... 15
FIGURE 10. Final Year Project (FYP) Project Key Milestone ... 17
FIGURE 11. P-h diagram of solar hybrid vapour compression refrigeration cycle . 20 FIGURE 12. T-s diagram of solar hybrid vapour compression refrigeration cycle . 20 FIGURE 13. Air Conditioner Condenser Coil (TechChoice Part) ... 22
FIGURE 14. Comparison Graph of Compressor Energy Saving vs Refrigerant Temperature at Condenser Inlet ... 25
FIGURE 15. Comparison graph of System Energy Saving vs Refrigerant Temperature at Condenser Inlet ... 27
FIGURE 16. Comparison graph of System Power Consumption vs Refrigerant Temperature at Condenser Inlet ... 27
FIGURE 17. Refrigerant temperature comparison for different solar compressor position ... 30
FIGURE 18. Compressor energy saving comparison for different solar compressor position ... 31
FIGURE 19. U-tube evacuated tube sizing ... 32
FIGURE 20. Temperature contour of U-tube evacuated solar collector ... 33
FIGURE 21. Average temperature of refrigerant at different position in U-tube evacuated solar collector ... 33
FIGURE 22. Evacuated Tube Solar Collector for Model 1 ... 34
FIGURE 23. Solar Radiation at Universiti Teknologi Petronas ... 35
FIGURE 24. Graph of System Energy Saving vs Time ... 36
FIGURE 25. Graph of System Power Consumption Saving vs Time ... 37
FIGURE 26. Thermal network for U-tube evacuated solar collector ... 40
FIGURE 27. Breakeven analysis - Model 1 ... 48
FIGURE 28. Breakeven analysis - Model 2 ... 49
FIGURE 29. Breakeven analysis - Model 3 ... 49
FIGURE 30. Breakeven analysis - Model 4 ... 49
FIGURE 31. Breakeven analysis - Model 5 ... 50
ix
LIST OF TABLES
TABLE 1. Targeted Renewable Energy Capacity in Malaysia (National Renewable
Energy Policy & Action Plan, 2008)... 2
TABLE 2. York Cooling King L Series (York Air Conditioner Brochure, 2014) .... 14
TABLE 3. Final Year Project (FYP) Gantt Chart ... 16
TABLE 4. Ideal Refrigeration Cycle Parameter ... 18
TABLE 5. Air conditioning performance comparison ... 19
TABLE 6. Solar hybrid air conditioning system condenser length... 22
TABLE 7. Compressor energy saving performance comparison ... 24
TABLE 8. Solar hybrid air conditioning system energy saving and power consumption ... 26
TABLE 9. Energy saving and refrigerant temperature comparison for different solar compressor position ... 30
TABLE 10. Evacuated tube solar collector sizing ... 34
TABLE 11. Solar Radiation at Universiti Teknologi Petronas ... 35
TABLE 12. Refrigerant output temperature after evacuated tube solar collector ... 42
TABLE 13. Solar Hybrid Air Conditioner Performance... 42
TABLE 14. SolAir World Hybrid Solar AC Specification – Wall Mounted Units (SolAir World International, 2014) ... 42
TABLE 15. Solar Hybrid Air Conditioning System Performance (8am-6pm) ... 44
TABLE 16. Air Conditioner Saving Comparison (8am-6pm) ... 44
TABLE 17. Solar Hybrid Air Conditioning System Performance (10pm-6am) ... 45
TABLE 18. Air Conditioner Saving Comparison (10pm-6pm) ... 45
TABLE 19. Solar Hybrid Air Conditioning System Performance (24hours) ... 46
TABLE 20. Air Conditioner Saving Comparison (24hours) ... 46
TABLE 21. Solar Hybrid Air Conditioner Saving Summary ... 47
TABLE 22. Conventional and solar hybrid air conditioner estimated price (Yuen Kong Electrical & Ningbo Soenbo Energy Technology, 2015) ... 48
TABLE 23. R22 Superheated Vapour - Constant Pressure Table ... 56
TABLE 24. R22 Superheated Vapour - Constant Pressure Table (cont') ... 56
TABLE 25. Glass cover temperature calculation 1st iteration ... 58
TABLE 26. Glass cover temperature calculation 2nd iteration ... 59
x
ABBREVIATIONS AND NOMENCLATURES
AC – Alternating Current
BLDC – Brushless Direct Current CO₂ – Carbon Dioxide
COP – Coefficient of Performance DC – Direct Current
FYP – Final Year Project P – Pressure
RM – Ringgit Malaysia
SEDEX – Science and Engineering Design Exhibition T – Temperature
TNB – Tenaga National Berhad UTP – Universiti Teknologi Petronas V – Volume
1
CHAPTER 1
INTRODUCTION
1.1BACKGROUND
The demand of air conditioning has greatly increased since the last decade due to the effect of climate change and global warming. For instance, two-thirds of residents in Malaysia have air conditioners (Daut, 2013). Ochi (1989) states that air conditioning is defined as the simultaneous processing of temperature, humidity, purification and distribution of air current in compliance with the requirement of space needing air conditioning. Generally, air conditioning is a refrigeration cycle which promotes heat removal.
There are several types of vapour compression air conditioning system, ranges from window unit, portable unit, split unit to central air conditioning unit. Regardless of the types, all systems consists of four basic elements which are compressor, condenser, expansion valve and evaporator coil.
According to Rona (2004), conventional air conditioning system would easily drain half of the building total electricity consumption. This translates to worsen of global warming as current electricity is generated from fossil fuels which emits greenhouse gases.
Harvesting solar energy to run the air conditioning system is a highly feasible technique to replace conventional electricity. As a clean and renewable energy source, the widely available solar energy is expected to produce important part of energy needed by the world.
In this project, the author is to develop an evacuated tube solar collector to be integrated to the conventional air conditioning system to further improve the cooling efficiency.
2
1.1.1 Malaysia Renewable Energy Target
Malaysia is among the most enthusiastic developing country to promote utilization of renewable energy. Recently, Prime Minister Datuk Seri Najib announced the National Green Technology Policy which focuses on renewable energy sector. Some suitable renewable energy sources for Malaysia are biogas, biomass, solid waste, hydro and solar power. Malaysia is targeting for 4000MW of power generated from renewable energy source by year 2030 as shown is Table 1. However, the targeted capacity were not successfully achieved as of year 2013 with just 190MW of total renewable energy (Malaysia Primary Energy Supply Summary, 2013).
Under the policy, Low Carbon Cities Framework and Assessment System is designed to reduce carbon dioxide emission by up to 40% in year 2020, compared to 2005 (National Renewable Energy Policy & Action Plan, 2008). Renewable energy is one of the key element to push forward Malaysia to achieve developed country target by year 2020.
TABLE 1. Targeted Renewable Energy Capacity in Malaysia (National Renewable
Energy Policy & Action Plan, 2008) Year Biogas (MW) Biomass (MW) Solid Waste (MW) Small Hydro (MW) Solar (MW) Total (MW) 2011 20 110 20 60 9 219 2012 35 150 50 110 20 365 2013 50 200 90 170 33 543 2014 75 260 140 230 48 753 2015 100 330 200 290 65 985 2016 125 410 240 350 84 1209 2017 155 500 280 400 105 1440 2018 185 600 310 440 129 1664 2019 215 700 340 470 157 1882 2020 240 800 360 490 190 2080 2025 350 1190 380 490 455 2865 2030 410 1340 390 490 1370 4000
3
1.1.2 Potential of Solar Energy in Malaysia
Malaysia is a tropical country located at Earth equator
The sunshine per day is approximately 12 hours.
Average Solar Radiation: 14–22 MJ/m² per day
FIGURE 1. Malaysia Annual Average Daily Solar Radiation (MJ/m² per day)
(Borhanazad, 2013)
FIGURE 2. Malaysia Monthly Average Daily Solar Radiation (kWh/m² per day)
4
1.2Problem Statement
1. High fuel price and electric tariff makes conventional air conditioner not economical in the long run
2. Generating electricity from fossil fuel emits greenhouse gases and worsen the global warming
3. Fossil fuel source is depleting
1.3Objectives
1. To design and integrate solar hybrid system into conventional air conditioning system
2. To reduce air conditioning electricity consumption by up to 45% 3. To reduce electric peak load during the day
1.4Scope of Study
1. Understanding the principle of solar energy conversion systems.
2. Understanding the techniques to harvest solar power to improve the conventional air conditioning system.
5
CHAPTER 2
LITERATURE REVIEW
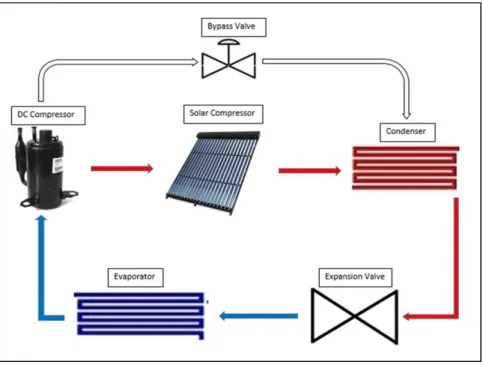
2.1 Solar Hybrid Air Conditioning Compressor SystemSolar hybrid air conditioning system operates the same way as conventional system with one component added, evacuated tube solar collector.
The evacuated tube solar collector is installed between the compressor and condenser. The solar collector consists of high efficient vacuum tube which provides part of compression pressure and heating by further superheating the refrigerant. The higher pressure and larger temperature difference enhance the condensation process in the condenser, resulting in high pressure liquid refrigerant. This configuration greatly reduces energy consumption by reducing the load on electric compressor (Daut, 2013). Furthermore, the alternating current (AC) compressor is replaced with high efficiency direct current (DC) compressor which consumes considerably less energy at the same load compared to AC compressor (Henning, 2007). DC compressor is powered by high torque brushless motor which is smaller in size and able to operate at variable speed.
6 2.2 Refrigeration Cycle
During refrigeration process, the refrigerant experiences huge change in thermodynamic properties and involves heat energy transfer to the surroundings through the heat exchangers (Admiraal, 1993). During the operation of a vapor compression refrigeration system, the following processes occurs:
Process 1-2s: Compression
A reversible, adiabatic (isentropic) compression of the refrigerant. The saturated vapour at state 1 is superheated to state 2.
𝑤𝑐 = ℎ2𝑠− ℎ1
Process 2s-3: Condensation
An internally, reversible, constant pressure heat rejection in which the refrigerant is de-superheated and then condensed to a saturated liquid at 3.
𝑞ℎ = ℎ2𝑠− ℎ3
Process 3-4: Throttling and expansion
An irreversible throttling process in which the temperature and pressure decrease at constant enthalpy.
ℎ3 = ℎ4
Process 4-1: Evaporation
An internally, reversible, constant pressure heat interaction in which the refrigerant is evaporated to a saturated vapour at state point 1. The latent enthalpy necessary for evaporation is supplied by the refrigerated space surrounding the evaporator. The amount of heat transferred to the working fluid in the evaporator is called the refrigeration load.
𝑞𝐿 = ℎ1− ℎ4
The thermal efficiency of the cycle can be calculated as:
𝜂 = 𝑞𝑒𝑣𝑎𝑝 𝑤𝑐𝑜𝑚𝑝
= ℎ1− ℎ4 ℎ2𝑠− ℎ1
7 2.3 Pressure-Enthalpy Diagram
The pressure-enthalpy, P-h diagram is deemed as most important graphical tool in any refrigeration analysis. For instance, two pressure region is involved in a single stage refrigeration cycle, namely high and low pressure region. The P-h diagram clearly illustrates any changes in pressure and enthalpy of the refrigerant which are the key elements in calculation and analysis of performance, heat and work transfer of the refrigeration cycle (Demma, 2005).
On the P-h diagram, the x-axis shows the enthalpy, h (kJ/kg), while the y-axis displays the pressure, P (kPa). The y-axis pressure, P is plotted in logarithmic scale. The two-phase region is separated from the subcooled liquid and superheated vapour region by the ‘bell’ curve which is jointly formed by the saturated liquid and vapour line. Within the two-phase region, the dryness fraction determines the properties of the refrigerant.
FIGURE 4. P-h diagram of vapour compression refrigeration cycle (Demma, 2005)
2.4 Temperature-Entropy Diagram
The temperature-entropy, T-s diagram is useful in evaluating the isentropic efficiency of the refrigeration cycle. For instance, the T-s diagram is able to clearly show the actual and ideal entropy of refrigerant after passing through the compressor, which is needed to determine the compressor isentropic efficiency (Demma, 2005). The analysis of irreversibilities helps to determine the optimum operating parameters to improve the refrigeration system performance. On the T-s diagram, the x-axis shows the entropy, h (kJ/kg-K), while the y-axis displays the temperature, T (K).
8
FIGURE 5. T-s diagram of vapour compression refrigeration cycle (Demma, 2005)
2.5 Evacuated Tube Solar Collector
Evacuated tube solar collectors consists of series of glass tubes which has the air evacuated out, creating a vacuum between the glass tube surface and absorber surface. The vacuum layer eliminates heat loss through conduction and convection, leaving radiation as the only heat loss mechanism (Jafarkazemi, 2012). The lower heat loss contributes to more absorbed heat energy, which translates to higher overall efficiency of the solar collector. Furthermore, the cylindrical shape of each evacuated tube allows the solar collector to passively track the sun throughout the day (Karim, 2014). For instance, an evacuated facing south will have the sunlight always striking at right angle to the cylindrical surface. This design provides advantage in term of maximum exposed solar radiation and also reduced reflection. In addition to the vacuum, special absorbing film with high absorptivity is used to absorb up to 90-92% of the sun’s ultraviolet rays (Budihardjo, 2008).
The solar collector provides part of compression pressure by heating the refrigerant under constant volume. Ideal gas law states that PV=nRT, where P is absolute pressure of gas, V is volume of gas, n is number of moles of gas, R is ideal gas constant, and T is absolute temperature of gas. During the 2nd stage compression, V, n, and R are kept
constant, deriving the ideal gas law into 𝑃1
𝑇1 =
𝑃2
𝑇2 , where 𝑃1 is the input pressure, 𝑇1 is
input temperature, 𝑃2 is the output pressure, and 𝑇2 is output temperature. Therefore, the higher the temperature of solar collector, the higher the pressure of refrigerant.
9
Heat loss coefficient:
(i) Radiation coefficient between the copper tube and the glass cover:
ℎ𝑟,𝑡−𝑐 =𝜎(𝑇𝑡 2+ 𝑇 𝑐2)(𝑇𝑡+ 𝑇𝑐) 1 𝜀𝑡+ 1 𝜀𝑐− 1
(ii) Radiation coefficient for the glass cover to the air:
ℎ𝑟,𝑐−𝑎 = 𝜀𝑐𝜎(𝑇𝑐2+ 𝑇𝑠2)(𝑇𝑐+ 𝑇𝑠)
(iii) Convection coefficient for the glass cover to the air:
ℎ𝑐,𝑐−𝑎 = 𝑘 𝐷𝑐𝑁𝑢 𝑅𝑎𝑦𝑙𝑒𝑖𝑔ℎ 𝑛𝑢𝑚𝑏𝑒𝑟, 𝑅𝑎 =𝑔𝛽(𝑇𝑐− 𝑇𝑎)𝐷𝑐 3 𝜐2 𝑃𝑟 𝑁𝑢𝑠𝑠𝑒𝑙𝑡 𝑛𝑢𝑚𝑏𝑒𝑟, 𝑁𝑢 = [ 0.6 + 0.387𝑅𝑎 1 6 [1 + (0.559𝑃𝑟 ) 9 16 ] 8 27 ] 2
(iv) Top loss coefficient:
𝑈 = ( 1 (𝐴𝑡)(ℎ𝑟,𝑡−𝑐) + 1 (𝐴𝑐)(ℎ𝑟,𝑐−𝑎+ ℎ𝑐,𝑐−𝑎) ) −1
(v) Glass cover temperature
𝑇𝑐 = 𝑇𝑡− 𝑈 [ℎ ℎ𝑟,𝑐−𝑎 𝑟,𝑐−𝑎+ ℎ𝑐,𝑐−𝑎(𝑇𝑡−𝑇𝑠) + ℎ𝑐,𝑐−𝑎 ℎ𝑟,𝑐−𝑎+ ℎ𝑐,𝑐−𝑎(𝑇𝑡−𝑇𝑎)] (𝐴𝑡)ℎ𝑟,𝑡−𝑐
Rate of energy balance equation:
ℎ𝑟,𝑡−𝑐 = ℎ𝑟,𝑐−𝑎+ ℎ𝑐,𝑐−𝑎 𝜎𝐴𝑡(𝑇𝑡4− 𝑇𝑐4) 1 𝜀𝑡+ 1 − 𝜀𝑐 𝜀𝑐 ( 𝐷𝑡 𝐷𝑐) = 𝜀𝑐𝜎𝐴𝑐(𝑇𝑐4− 𝑇𝑠4) + ℎ𝑐,𝑐−𝑎𝐴𝑐(𝑇𝑐− 𝑇𝑎)
10
Where:
𝜀𝑡 = copper tube emittance
𝜀𝑐 = glass cover emittance
𝑇𝑎 = ambient temperature (K)
𝑇𝑠 = sky temperature (K)
𝑇𝑡 = mean tube temperature (K)
𝑇𝑐 = glass cover temperature (K)
𝐴𝑡 = area of absorber tube, m²
𝐴𝑐 = area of glass cover, m²
𝜎 = Stefan-Boltzman constant (5.67𝑥10−8𝑊/𝑚2𝐾4)
11 2.6 Type of Evacuated Solar Collector
(i) Heat Pipe Evacuated Solar Collector
Heat pipe solar collector has a metal heat pipe, attached to selective absorber plate in the evacuated tube. The heat pipe contain a small quantity of liquid, such as alcohol, acetone or purified water plus special additives. Inside, the heat pipe is evacuated which lowers the boiling point of the working fluid, enabling the system to start working even at low temperatures (Kalogirou, 2014). When solar radiation strikes the collector, the working liquid quickly evaporate and rises to the copper header. The refrigerant flows through a manifold and absorb the heat from the copper header, causing the working fluid to condense and flow back down to the heat tube where the heat exchange process is repeated.
Since there is no direct connection between the evacuated tubes with the flowing refrigerant, the system is still functional despite one broken tube. Moreover, installation process is easier where individual tube can be replaced without shutting down the system or emptying the refrigerant. However, heat pipe solar collector must be mounted at a minimum tilt angle of 25° as the condensed working fluid rely on gravitational pull to return to the absorber area (Ong, 2012).
(ii) U-tube Evacuated Solar Collector
U-tube collector consists of long copper tube which directs the refrigerant flow through the evacuated tube (Kalogirou, 2014). This allows a greater heat exchanging area which is highly desirable due to the low thermal conductivity of refrigerant vapour. The copper tube has fin which is covered with special coating to maximise absorption of solar radiation. The radiation and convection heat loss is effectively prevented by the evacuated tube.
U-tube collector is better than the heat pipe in terms of initial cost and smaller sizing. Moreover, U-tube collector has less constrain on installation position where it can be mounted perfectly horizontal or vertical (Ong, 2012). However, U-tube collector falls behind in terms of maintenance and reliability. Since the refrigerant is flowing through the evacuated tube, a broken tube will affect the whole system and changing tubes will require the refrigerant to be emptied.
12
FIGURE 7. Heat Pipe and U-tube evacuated solar collector (Ong, 2012)
2.7 Direct Current (DC) Compressor
Direct current (DC) compressor has become more popular due to its advantages over the conventional alternating current (AC) compressor in air conditioning system (Kohlenbach, 2014). Conventional AC compressor utilises 3-phase AC induction motor due to the simple design, low initial cost and high reliability. However, it is difficult to control the speed of AC motor so most air conditioning systems are using single speed AC compressor (Brown, 2007). Therefore, the air conditioning system needs to constantly switch on and off the compressor to maintain the desired temperature which leads to high energy consumption and noisy operation. While AC inverter motor enable the compressor to work at variable speed, the AC inverter system is expensive and have lower efficiency compared to DC brushless motor.
DC compressor uses brushless dc (BLDC) motor which has relatively flat speed-torque output and high power to size ratio. Therefore, BLDC motor are able to operate at variable speed without compromising torque which allows the system to dynamically adjust its capacity based on cooling requirement. The variable speed operation ensures
13
continue delivery of cool air which contributes to less temperature fluctuation and more comfortable environment for the occupant (Brown, 2007). Furthermore, while BLDC motor has permanent magnets on rotor and no brushes for commutation, the motor is highly efficient and reliable. However, BLDC motor is has higher initial cost than the simpler AC motor. Nevertheless, the DC compressor are more economical in the long run due to their energy saving capability (Lamanna, 2010).
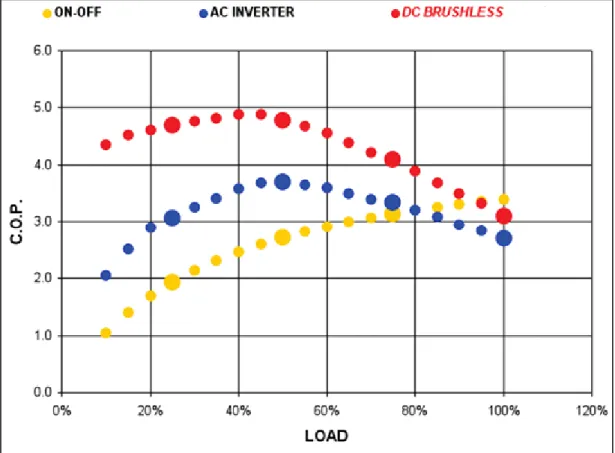
Figure 8 displays the performance comparison chart among conventional on-off AC compressor, AC inverter compressor, and DC brushless compressor. The comparison chart shows that DC brushless compressor has the highest efficiency over the entire load range.
FIGURE 8. Air conditioning compressor performance comparison chart (Lamanna,
14
CHAPTER 3
METHODOLOGY
3.1 Research MethodologyIn this project, five York Cooling King L Series conventional air conditioner model with capacity ranging from 10000btu/h to 24000btu/h are selected for analysis.
TABLE 2. York Cooling King L Series (York Air Conditioner Brochure, 2014)
Model 1 2 3 4 5 Cooling Capacity (Btu/h) 10000 13000 18000 19500 24000 Power (W) 815 1015 1360 1540 2230 Current (A) 4.38 5.36 7.16 8.12 12 Compressor Power (W) 735.0 915.0 1222.5 1387.5 2006.3 Refrigerant R22 R22 R22 R22 R22 COP 3.99 4.16 4.31 4.12 3.51
ANSYS software is used extensively to determine the required length of evacuated tube solar collector and refrigerant output temperature at different hours in a day. The results are then compared with theoretical calculations to determine the energy saving performance. Meanwhile, the results are compared with experiment of other researchers using actual air conditioner and evacuated tube solar collector to further verify the results. In addition, Microsoft Excel spreadsheet is also prepared to facilitate the calculation of refrigerant temperature and energy saving of the system.
15
Figure 9 below shows the overall progress of the methodology flow in order to conduct Final Year Project (FYP) smoothly and efficiently.
FIGURE 9. Methodology Flow
No
Yes
START
Select Project Title
Research and Literature Review
Calculation and Simulation
Analyse and Compare Results with
Experiments of other Researchers Improve
Design
Conclusion and Recommendation
END
16 3.2 Gantt Chart
17 3.3 Key Project Milestone
FIGURE 10. Final Year Project (FYP) Project Key Milestone
FYP 1 - Week 2
• Title Selection• "Design a Solar Hybrid Air
Conditioning Compressor System"
FYP 1 - Week 14
• Complete literature review and research • Calculation of Solar Hybrid Air
Conditioning Energy Saving Performance • Submission of Interim Report
FYP 2 - Week 10
• Simulation of Solar Hybrid Air Conditioning System
• Analysis of simulation result • Pre-SEDEX
FYP 2 - Week 14
• Viva Presentation18
CHAPTER 4
RESULTS AND DISCUSSIONS
4.1 Refrigeration Cycle ParameterThe conventional air conditioning system uses R22 as the refrigerant and operates on an ideal vapour compression refrigeration cycle between 550kPa and 1700kPa. The ideal refrigeration cycle parameter using R22 refrigerant is shown in the table below:
TABLE 4. Ideal Refrigeration Cycle Parameter
State 1 2 3 4 Pressure, P (kPa) 550 1700 1700 550 Temperature, T (°C) 10.00 69.20 40.00 3.09 Enthalpy, h (kJ/kg) 411.3 440.9 249.6 249.6 Entropy, s (kJ/K-kg) 1.765 1.765 1.166 1.180 Quality Superheated vapour Superheated vapour Subcooled liquid 0.227 COP 𝐶𝑂𝑃 =ℎ1− ℎ4 ℎ2 − ℎ1 = 411.3 − 249.6 440.9 − 411.3= 5.46
An actual vapour compression refrigeration cycle differs from the ideal one in several ways. In the ideal cycle, the refrigerant leaves the evaporator and enters the compressor as saturated vapour. In practice, however, it may not be possible to control the state of the refrigerant so precisely. Instead, it is easier to design the system so that the refrigerant is slightly superheated at the compressor inlet. This slight overdesign ensures that the refrigerant is completely vaporized when it enters the compressor. Next, in the ideal case, the refrigerant is assumed to leave the condenser as saturated liquid at the compressor exit pressure. In reality, however, it is not easy to execute the condensation process with such precision that the refrigerant is a saturated liquid at the end, and it is undesirable to route the refrigerant to the throttling valve before the refrigerant is completely condensed. Therefore, the refrigerant is subcooled somewhat before it enters the throttling valve (Cengel Y.A. & Boles M. A., 2013).
19
4.2 Calculation on Air Conditioning Performance
Model 1: (Same calculation method for model 2, 3, 4, and 5)
𝐶𝑂𝑃 = ℎ1− ℎ4 ℎ2𝑎 − ℎ1 → 3.99 = 411.3 − 249.6 ℎ2𝑎 − 411.3 𝐴𝑐𝑡𝑢𝑎𝑙 𝐸𝑛𝑡ℎ𝑎𝑙𝑝𝑦, ℎ2𝑎 = 451.8 𝑘𝐽 𝑘𝑔⁄ 𝐶𝑜𝑚𝑝𝑟𝑒𝑠𝑠𝑜𝑟 𝐼𝑠𝑒𝑛𝑡𝑟𝑜𝑝𝑖𝑐 𝐸𝑓𝑓𝑖𝑐𝑖𝑒𝑛𝑐𝑦, 𝜂𝑐 = ℎ2𝑠− ℎ1 ℎ2𝑎 − ℎ1 = 440.9 − 411.3 451.8 − 411.3= 0.731 𝐶𝑜𝑚𝑝𝑟𝑒𝑠𝑠𝑜𝑟 𝑝𝑜𝑤𝑒𝑟 = 𝑚̇𝑟(ℎ2𝑎− ℎ1) → 735.0𝑥10−3= 𝑚̇𝑟(451.8 − 411.3) 𝑅𝑒𝑓𝑟𝑖𝑔𝑒𝑟𝑎𝑛𝑡 𝑚𝑎𝑠𝑠 𝑓𝑙𝑜𝑤 𝑟𝑎𝑡𝑒, 𝑚̇𝑟 = 0.0181 𝑘𝑔/𝑠
Each air conditioner model has different compressor isentropic efficiency and refrigerant mass flow rate. Model 3 has the compressor with highest isentropic efficiency of 78.9%, followed by Model 2, 4 and 1. Model 5 has the lowest compressor isentropic efficiency of 64.2%. Meanwhile, the refrigerant mass flow rate increases with the cooling capacity of air conditioner. Therefore, Model 5 has the highest refrigerant mass flow rate of 0.0435kg/s, followed by Model 4, 3, 2 and 1. The table below shows the compressor isentropic efficiency and refrigerant mass flow rate for each air conditioning model.
TABLE 5. Air conditioning performance comparison
Air Conditioning Model 1 2 3 4 5
Actual Enthalpy 𝒉𝟐𝒂 (kJ/kg)
451.8 450.2 448.8 450.5 457.4
Compressor Isentropic Efficiency 𝜼𝒄 =
𝒉𝟐𝒔− 𝒉𝟏 𝒉𝟐𝒂 − 𝒉𝟏
0.731 0.761 0.789 0.755 0.642
Refrigerant mass flow rate
20
4.3 Solar Hybrid Vapour Compression Refrigeration Cycle
The evacuated tube solar collector is installed between the compressor and condenser, providing part of compression pressure and heating by further superheating the refrigerant. Figure 11 and 12 shows the P-h and T-s diagram of solar hybrid vapour compression refrigeration cycle at maximum energy saving where the refrigerant temperature achieved 160°C at the solar collector outlet. The electric DC compressor workload is significantly reduced due to the lower output pressure of 1280kPa compared to the original 1700kPa.
FIGURE 11. P-h diagram of solar hybrid vapour compression refrigeration cycle
FIGURE 12. T-s diagram of solar hybrid vapour compression refrigeration cycle Process 1-x: Electric compressor
Process x-2: Solar compressor Process 2-3: Condenser Process 3-4: Expansion valve Process 4-1: Evaporator
21 4.4 Calculation on Condenser Sizing
Model 1: (Sample Calculation)
Conventional air conditioning system:
𝑄̇𝑐 = 𝑚̇𝑟𝐶𝑝(𝑇𝑜𝑢𝑡− 𝑇𝑖𝑛) = 0.0181(57.2)(69.2 − 40) = 30.23 𝑊 𝑇𝑠 = 𝑇𝑖𝑛+ 𝑇𝑜𝑢𝑡 2 = 69.2 + 40 2 = 54.6℃ 𝑄̇𝑐 = ℎ𝐴𝑠(𝑇𝑠 − 𝑇𝑎) = ℎ(𝜋𝐷𝐿𝑐)(54.6 − 30) = 30.23 𝑊
○
1Solar hybrid air conditioning system:
𝑄̇𝑠 = 𝑚̇𝑟𝐶𝑝(𝑇𝑜𝑢𝑡 − 𝑇𝑖𝑛) = 0.0181(57.2)(160 − 40) = 124.24 𝑊 𝑇𝑠 =𝑇𝑖𝑛+ 𝑇𝑜𝑢𝑡 2 = 160 + 40 2 = 100℃ 𝑄̇𝑠 = ℎ𝐴𝑠(𝑇𝑠− 𝑇𝑎) = ℎ(𝜋𝐷𝐿𝑠)(100 − 30) = 124.24 𝑊
○
2 Comparing○
1 to○
2 : ℎ(𝜋𝐷𝐿𝑐)(54.6 − 30) = 30,23 → ℎ(𝜋𝐷)𝐿𝑐 = 1.22 ℎ(𝜋𝐷𝐿𝑠)(100 − 30) = 124.24 → ℎ(𝜋𝐷)𝐿𝑠 = 1.77 𝐿𝑠 𝐿𝑐 = 1.77 1.22 ∴ 𝐿𝑠 = 1.45 𝐿𝑐 Where:𝐿𝑠 = Solar hybrid air conditioning system condenser length
22
TABLE 6. Solar hybrid air conditioning system condenser length
Solar hybrid air conditioning system
Condenser Length, 𝑳𝒔 Model 1 1.45 𝐿𝑐 Model 2 1.44 𝐿𝑐 Model 3 1.44 𝐿𝑐 Model 4 1.44 𝐿𝑐 Model 5 1.44 𝐿𝑐
From Table 6, all the condensers need to be 45% longer, regardless of models, in order to cool down the refrigerant to 40°C from up to 160°C. The extra refrigerant heat is produced by the solar compressor which uses the solar thermal energy to increase the refrigerant pressure. In contrast, the conventional unit only has to cool down the refrigerant temperature from 69.2°C to 40°C. The refrigerant is further subcooled before entering the throttle valve while pressure drop in the extra length of condenser is insignificant and can be neglected (Cengel Y.A. & Boles M. A., 2013).
23
4.5 Calculation on Solar Compressor Energy Saving Performance
Set E: Pᵪ = 1300 kPa; Tᵪ = 54.1°C; sᵪ = 1.765 kJ/kg-K (Same calculation method for Set A, B, C, D, and F) (i) Ideal cycle:
hᵪ = 432.9 kJ/kg
𝐶𝑜𝑚𝑝𝑟𝑒𝑠𝑠𝑜𝑟 𝑒𝑛𝑒𝑟𝑔𝑦 𝑠𝑎𝑣𝑖𝑛𝑔 = 1 −ℎ𝑥− ℎ1
ℎ2− ℎ1 𝑥 100% = 1 −432.9 − 411.3
440.9 − 411.3 𝑥 100% = 27%
(ii) Model 1: (Same calculation method for model 2, 3, 4, and 5) Replace electric compressor to DC compressor with 90% efficiency.
𝜂𝑐 = ℎ𝑥𝑠− ℎ1 ℎ𝑥𝑎− ℎ1 → 0.90 =432.9 − 411.3 ℎ𝑥𝑎− 411.3 ℎ𝑥𝑎 = 435.3 𝑘𝐽 𝑘𝑔⁄ 𝐶𝑜𝑚𝑝𝑟𝑒𝑠𝑠𝑜𝑟 𝑒𝑛𝑒𝑟𝑔𝑦 𝑠𝑎𝑣𝑖𝑛𝑔 = 1 −ℎ𝑥𝑎− ℎ1 ℎ2𝑎− ℎ1 𝑥 100% = 1 −435.3 − 411.3 451.8 − 411.3 𝑥 100% = 40.7%
With evacuated tube solar collector, compressor energy saving of 28.6% can be achieved. When combined with high efficiency DC compressor, the solar compressor can achieve energy saving up to 49.4%, depending on the model. Table 7 shows the compressor energy saving performance for all model at different refrigerant temperature at condenser inlet.
24
TABLE 7. Compressor energy saving performance comparison
Set A B C D E F
Refrigerant Temperature after Solar Compressor, °C
69.2 86.7 106.8 129.2 154.7 160.0 (1) Electric Compressor Inlet P₁ (kPa) 550 550 550 550 550 550 T₁ (°C) 10 10 10 10 10 10 ℎ1 (kJ/kg) 411.3 411.3 411.3 411.3 411.3 411.3 (x) Solar Compressor Inlet Pᵪ (kPa) N/A 1600 1500 1400 1300 1280 Tᵪ (°C) N/A 65.7 62.1 58.2 54.1 53.0 ℎ𝑥𝑠 (kJ/kg) N/A 438.9 436.9 434.9 432.9 432.7 (2) Condenser Inlet P₂ (kPa) 1700 1700 1700 1700 1700 1700 T₂ (°C) 69.2 86.7 106.8 129.2 154.7 160.0
Compressor Energy Saving, %
Ideal 0 6.8 13.5 20.3 27.0 28.6 Model 1 18.8 24.2 29.9 35.3 40.7 41.3 Model 2 15.4 21.2 27.0 32.6 38.3 39.7 Model 3 12.3 18.1 24.3 30.1 36.0 38.1 Model 4 16.1 21.7 27.6 33.2 38.8 40.5 Model 5 28.6 33.4 38.4 43.2 47.9 49.4
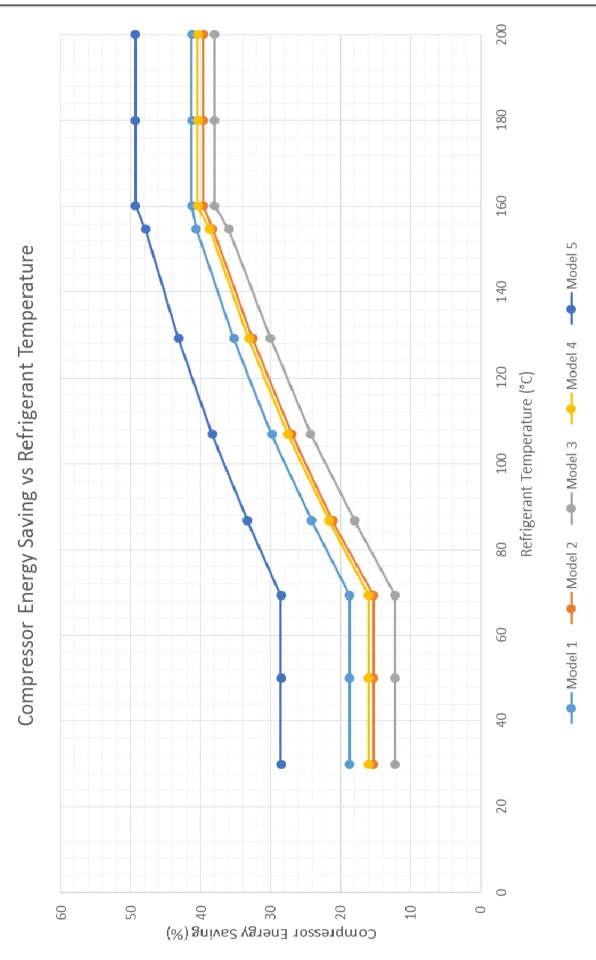
The higher the refrigerant temperature, the higher the compressor energy saving, thus contributing to lower power consumption. However, the maximum compressor energy saving is limited at 160°C of refrigerant temperature at condenser inlet. The designated condenser is unable to remove any excess heat energy from the refrigerant at temperature higher than 160°C. In short, the solar compressor provide energy saving when refrigerant temperature at condenser inlet is in the range of 69.2°C up to 160°C. At refrigerant temperature lower than 69.2°C, the energy saving is solely supported by the highly efficient DC compressor. Figure 14 shows the compressor energy saving at different refrigerant temperature.
25
FIGURE 14. Comparison Graph of Compressor Energy Saving vs Refrigerant
26
4.6 Solar Hybrid Air Conditioning System Energy Saving Performance
Model 1: (Same calculation method for model 2, 3, 4, and 5) Conventional air conditioning system power consumption – 815 W Conventional AC compressor power consumption – 735 W
(i) Solar hybrid air conditioning system energy saving, S
𝑆 =(735 𝑥 𝐶𝑜𝑚𝑝𝑟𝑒𝑠𝑠𝑜𝑟 𝐸𝑛𝑒𝑟𝑔𝑦 𝑆𝑎𝑣𝑖𝑛𝑔)
815 𝑥 100%
(ii) Solar hybrid air conditioning system power consumption, P
𝑃 = 815 𝑥 𝑆𝑦𝑠𝑡𝑒𝑚 𝐸𝑛𝑒𝑟𝑔𝑦 𝑆𝑎𝑣𝑖𝑛𝑔
The higher the compressor energy saving, the higher the system energy saving, thus contributing to lower power consumption. Table below shows the solar hybrid air conditioning system energy saving and power consumption for all models.
TABLE 8. Solar hybrid air conditioning system energy saving and power consumption
Refrigerant
Temperature after Solar Compressor, °C
69.2 86.7 106.8 129.2 154.7 160.0
Solar Hybrid Air Conditioning System Energy Saving, %
Model 1 17.0 21.8 27.0 31.8 36.7 37.2
Model 2 13.9 19.1 24.3 29.4 34.5 35.8
Model 3 11.1 16.3 21.8 27.1 32.4 34.2
Model 4 14.5 19.6 24.9 29.9 35.0 36.5
Model 5 25.7 30.0 34.5 38.9 43.1 44.4
Solar Hybrid Air Conditioning System Power Consumption, W
Model 1 676.8 637.1 595.2 555.5 515.9 511.4
Model 2 874.1 821.0 768.0 716.7 664.6 651.7
Model 3 1209.6 1138.7 1062.9 992.0 919.9 894.2
Model 4 1316.6 1238.9 1157.1 1079.4 1001.7 978.1
27
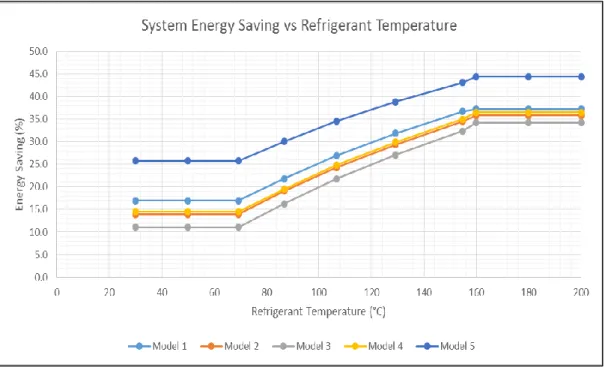
The solar hybrid air conditioning system energy saving comes from the energy saving achieved by compressor unit. The system energy saving is slightly lower than the compressor energy saving due to the energy consumptions of other components such as indoor air blower and electronic control system. There is a strong relationship between energy saving and power consumption where the higher the energy saving, the lower the power consumption, and vice versa. Figure 15 and 16 shows the solar hybrid air conditioning system energy saving and power consumption for all models.
FIGURE 15. Comparison graph of System Energy Saving vs Refrigerant
Temperature at Condenser Inlet
FIGURE 16. Comparison graph of System Power Consumption vs Refrigerant
28
4.7 Justification for Evacuated Tube Solar Compressor Position
Set E: (Same calculation method for Set A, B, C, D, and F) (i) After electric compressor:
Electric Compressor:
Increase pressure from 𝑃1 = 550kPa to Pᵪ = 1300kPa Tᵪ = 54.1°C ; hᵪ = 432.9 kJ/kg ; sᵪ = 1.765 kJ/kg-K
ℎ𝑥− ℎ1 = 432.9 − 411.3 = 21.6 𝑘𝐽/𝑘𝑔
Evacuated Tube Solar Compressor:
Increase pressure from Pᵪ = 1300kPa to P₂ = 1700kPa
𝑃𝑥 𝑇𝑥 = 𝑃2 𝑇2 → 1300𝑘𝑃𝑎 327.1𝐾 = 1700𝑘𝑃𝑎 𝑇2 ∴ 𝑇2 = 427.7𝐾 = 154.7℃ 𝐶𝑜𝑚𝑝𝑟𝑒𝑠𝑠𝑜𝑟 𝑒𝑛𝑒𝑟𝑔𝑦 𝑠𝑎𝑣𝑖𝑛𝑔 = 1 −ℎ𝑥− ℎ1 ℎ2− ℎ1 𝑥 100% = 1 −432.9 − 411.3 440.9 − 411.3 𝑥 100% = 27.0%
In this configuration, the electric compressor needs 27% less energy than the conventional method. Furthermore, T₂ = 154.7°C is achievable by evacuated tube solar collector. Therefore, the evacuated tube solar compressor should be placed after the electric compressor.
29
(ii) Before electric compressor: Evacuated Tube Solar Compressor: Let Tᵪ be 154.7℃ 𝑃1 𝑇1 = 𝑃𝑥 𝑇𝑥→ 550𝑘𝑃𝑎 283𝐾 = 𝑃𝑥 427.7𝐾 ∴ 𝑃𝑥 = 831.2𝑘𝑃𝑎
From the thermodynamic properties table, hᵪ = 518.9 kJ/kg ; sᵪ = 2.033 kJ/kg-K
Electric Compressor:
Increase pressure from Pᵪ = 831.2kPa to P₂ = 1700kPa T₂ = 195°C ; h₂ = 547.9 kJ/kg ; s₂ = 2.033 kJ/kg-K h₂ – hᵪ = 547.9 – 518.9 = 29 kJ/kg 𝐶𝑜𝑚𝑝𝑟𝑒𝑠𝑠𝑜𝑟 𝑒𝑛𝑒𝑟𝑔𝑦 𝑠𝑎𝑣𝑖𝑛𝑔 = 1 −ℎ2′− ℎ𝑥 ℎ2 − ℎ1 𝑥 100% = 1 −547.9 − 518.9 440.9 − 411.3 𝑥 100% = 2.0%
In this configuration, the electric compressor only saves 2.0% energy compared to the conventional method. Furthermore, the high refrigerant temperature of 195°C puts more load on the condenser. Therefore, placing the evacuated tube solar compressor before electric compressor is not desirable.
30
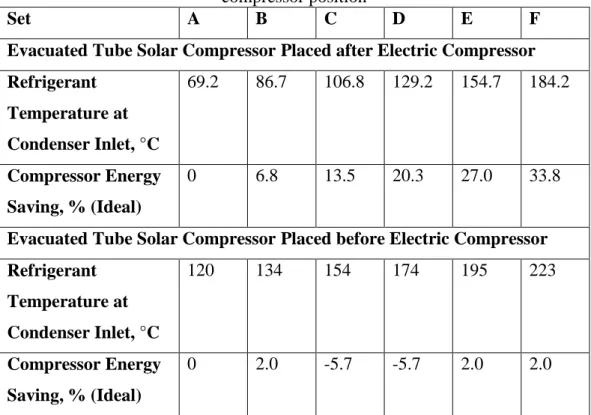
TABLE 9. Energy saving and refrigerant temperature comparison for different solar compressor position
Set A B C D E F
Evacuated Tube Solar Compressor Placed after Electric Compressor Refrigerant Temperature at Condenser Inlet, °C 69.2 86.7 106.8 129.2 154.7 184.2 Compressor Energy Saving, % (Ideal) 0 6.8 13.5 20.3 27.0 33.8
Evacuated Tube Solar Compressor Placed before Electric Compressor Refrigerant Temperature at Condenser Inlet, °C 120 134 154 174 195 223 Compressor Energy Saving, % (Ideal) 0 2.0 -5.7 -5.7 2.0 2.0
Both electric compressor and solar compressor uses different ways to pressurise the refrigerant. The electric compressor works by mechanically forcing the refrigerant into a smaller volume while the solar collector provides the compression pressure by heating the refrigerant under constant volume. The study results shown that the solar compressor has to be placed after the electric compressor.
FIGURE 17. Refrigerant temperature comparison for different solar compressor position
31
FIGURE 18. Compressor energy saving comparison for different solar compressor position
Both Figure 17 and Figure 18 confirms the advantages of placing solar compressor after electric compressor. For comparison, if solar compressor is placed after electric compressor, the refrigerant temperature entering the condenser is significantly lower, which translates to smaller size condenser. Furthermore, in this configuration, the energy saving increases with the refrigerant temperature. On the other hand, placing the solar compressor before electric compressor provides little to no energy saving due to the high refrigerant temperature requirement.
32 4.8 ANSYS Simulation
The developed evacuated tube solar collector is a U-tube flow through type. The simulation is carried out under the following assumptions:
(i) The refrigerant flow is continuous (ii) The flow is steady and laminar
(iii) The selected longitude, latitude and time zone are 100.9797, 4.3864 and +8 at Universiti Teknologi Petronas as solar calculator input
(iv) Solar ray tracing with fair weather condition model option is selected (v) Performance is in steady state
(vi) The headers provide uniform flow to tubes (vii) Dust and dirt on the collector are negligible Model 1: 12PM (Sample)
The U-tube evacuated tube consists of a copper absorber tube of 1.3m length, with 5mm inner diameter and 2mm thickness. The circular copper tube is covered with 1mm thickness of selective absorber coating to improve tube absorptivity. The U-tube is insulated with circular glass enclosure with 39mm outer diameter and 3mm thickness. The solar collector consists of 12 U-tubes in which the headers provide uniform flow to each tubes. Figure below shows the evacuated tube sizing:
33
The refrigerant enters the U-tube evacuated solar collector at 52°C and exits with an average temperature of 166°C.
FIGURE 20. Temperature contour of U-tube evacuated solar collector
FIGURE 21. Average temperature of refrigerant at different position in U-tube evacuated solar collector
300 320 340 360 380 400 420 440 0 0.1 0.2 0.3 0.4 0.5 0.6 0.7 0.8 0.9 1 1.1 1.2 1.3 Av era ge T em p era tu re (K ) Position (m)
34
The ANSYS simulation is run extensively to determine the size of evacuated tube solar collector required to achieve at least 160°C of refrigerant temperature in each of the air conditioner model. The tube length and number of tubes indicating the evacuated tube solar collector sizing for each model is shown in the table below:
TABLE 10. Evacuated tube solar collector sizing
Tube Length (m) Number of Tubes Dimension (W x H x D) mm³
Model 1 0.65 12 580 x 750 x 60
Model 2 0.85 12 580 x 950 x 60
Model 3 0.85 16 780 x 950 x 60
Model 4 0.85 18 875 x 950 x 60
Model 5 0.85 22 1080 x 950 x 60
U-tube evacuated solar collector consists of long copper tube which directs the refrigerant flow through the evacuated tube. This allows a greater heat exchanging area which is highly desirable due to the low thermal conductivity of refrigerant vapour. Figure below shows the schematic diagram of solar collector for model 1:
35
The solar radiation data at Universiti Teknologi Petronas is generated through Solar Calculator in ANSYS software with longitude, latitude and time zone as 100.9797, 4.3864 and +8 respectively. Solar ray tracing with fair weather condition model option is also selected.The solar radiation at the studied area increases rapidly from 7am and peaks at around 12pm to 2pm and begins to decrease until sunset at around 7pm.
TABLE 11. Solar Radiation at Universiti Teknologi Petronas
Estimated Solar Radiation at UTP
Time W/m2 Time W/m2 1 0 13 874.5 2 0 14 872.8 3 0 15 857.3 4 0 16 822.7 5 0 17 753.8 6 0 18 603.7 7 182.3 19 188.2 8 351.9 20 0 9 659.1 21 0 10 777.9 22 0 11 834.7 23 0 12 863.1 24 0
36
During day time, the energy saving is achieved by both DC compressor and solar compressor. The energy saving increases rapidly from 7am and peaks at around 10am to 4pm and begins to decrease unitl night time. During night time, the absence of solar radiation means energy saving is only contributed by the DC compressor. There is a strong relationship between energy saving and power consumption where the higher the energy saving, the lower the power consumption, and vice versa.
During daytime, Model 5 can achieve the highest maximum energy saving of 44.4%, followed by Model 1, 2, 3 and 4 with energy saving of 37.2%, 35.8%, 34.2% and 36.5% respectively. During nighttime, DC compressor manages energy saving of 25.7% for Model 5, followed by Model 1, 2, 3 and 4 with energy saving of 17.0%, 13.9%, 11.1% and 14.5% respectively. Figure 24 and 25 shows the system energy saving and system power consumption versus time.
37
FIGURE 25. Graph of System Power Consumption Saving vs Time
4.9 Discussion on Calculation:
Assumptions:
1. Performance is in steady state
2. The headers provide uniform flow to tubes 3. Dust and dirt on the collector are negligible
The procedure is to estimate the cover temperature, from which ℎ𝑟,𝑡−𝑐 , ℎ𝑟,𝑐−𝑎 , and
ℎ𝑐,𝑐−𝑎 are calculated. These results are then used to calculate 𝑇𝑐 from preceding equation. If 𝑇𝑐 is close to the initial guess, no further calculations are necessary.
Otherwise, the newly calculated 𝑇𝑐 is used and the process is repeated. Model 1: 12 PM (Sample Calculation)
𝑆𝑜𝑙𝑎𝑟 𝑖𝑟𝑟𝑎𝑑𝑖𝑎𝑛𝑐𝑒, 𝐺 = 865 𝑊 𝑚⁄ 2 𝐶𝑜𝑝𝑝𝑒𝑟 𝑡𝑢𝑏𝑒 𝑒𝑚𝑖𝑡𝑡𝑎𝑛𝑐𝑒, 𝜀𝑡 = 0.07 𝐺𝑙𝑎𝑠𝑠 𝑐𝑜𝑣𝑒𝑟 𝑒𝑚𝑖𝑡𝑡𝑎𝑛𝑐𝑒, 𝜀𝑐 = 0.80 𝐴𝑚𝑏𝑖𝑒𝑛𝑡 𝑡𝑒𝑚𝑝𝑒𝑟𝑎𝑡𝑢𝑟𝑒, 𝑇𝑎 = 30℃ 𝑆𝑘𝑦 𝑡𝑒𝑚𝑝𝑒𝑟𝑎𝑡𝑢𝑟𝑒, 𝑇𝑠 = 20℃ 𝑀𝑒𝑎𝑛 𝑡𝑢𝑏𝑒 𝑡𝑒𝑚𝑝𝑒𝑟𝑎𝑡𝑢𝑟𝑒, 𝑇𝑡 = 151 ℃ 𝐸𝑠𝑡𝑖𝑚𝑎𝑡𝑒𝑑 𝑔𝑙𝑎𝑠𝑠 𝑐𝑜𝑣𝑒𝑟 𝑡𝑒𝑚𝑝𝑒𝑟𝑎𝑡𝑢𝑟𝑒, 𝑇𝑐 = 40 ℃
38
(i) Radiation coefficient between the copper tube and the glass cover:
ℎ𝑟,𝑡−𝑐 =(5.67𝑥10 −8)(4242+ 3132)(424 + 313) 1 0.07 + 1 0.80 − 1 = 0.80 𝑊 𝑚⁄ 2∙ 𝐾
(ii) Radiation coefficient for the glass cover to the air:
ℎ𝑟,𝑐−𝑎 = 0.80(5.67𝑥10−8)(3132 + 2932)(313 + 293) = 5.05 𝑊 𝑚⁄ 2∙ 𝐾
(iii) Convection coefficient for the glass cover to the air:
𝑘 = 0.02625 𝑊/𝑚 ∙ 𝐾 𝜐 = 1.655𝑥10−5 𝑚2/𝑠 𝑃𝑟 = 0.7268 𝛽 = 1 𝑇𝑎𝑣𝑔 = 1 308 𝑅𝑎 = 9.81 ( 1 308)(313 − 303)(0.0393) (1.655 𝑥10−5)2 (0.7268) = 50133.85 𝑁𝑢 = [ 0.6 + 0.387(50133.85) 1 6 [1 + (0.7268)0.559 9 16 ] 8 27 ] 2 = 6.525 ℎ𝑐,𝑐−𝑎 =0.02625 0.039 (0.832) = 4.39 𝑊/𝑚 2∙ 𝐾 𝑈 = ( 1 (0.0449)(0.80)+ 1 (0.0398)(5.05 + 4.39)) −1 = 0.0327 𝑊/𝐾 𝑇𝑐 = 424 − 0.0327 [5.05 + 4.395.05 (424 − 293) +5.05 + 4.394.39 (424 − 303)] (0.0449)0.80 = 308.7 𝐾 = 35.7 ℃ ∴ 𝑁𝑒𝑤 𝑒𝑠𝑡𝑖𝑚𝑎𝑡𝑒𝑑 𝑔𝑙𝑎𝑠𝑠 𝑐𝑜𝑣𝑒𝑟 𝑡𝑒𝑚𝑝𝑒𝑟𝑎𝑡𝑢𝑟𝑒, 𝑇𝑐 = 35.7 ℃
39
(i) Radiation coefficient between the copper tube and the glass cover:
ℎ𝑟,𝑡−𝑐 =(5.67𝑥10 −8)(4242+ 308.72)(424 + 308.7) 1 0.07 + 1 0.80 − 1 = 0.79 𝑊 𝑚⁄ 2∙ 𝐾
(ii) Radiation coefficient for the glass cover to the air:
ℎ𝑟,𝑐−𝑎 = 0.80(5.67𝑥10−8)(308.72+ 2832)(308.7 + 283)
= 4.94 𝑊 𝑚⁄ 2 ∙ 𝐾
(iii) Convection coefficient for the glass cover to the air:
𝑘 = 0.02609 𝑊/𝑚 ∙ 𝐾 𝜐 = 1.635𝑥10−5 𝑚2/𝑠 𝑃𝑟 = 0.7274 𝛽 = 1 𝑇𝑎𝑣𝑔 = 1 305.9 𝑅𝑎 = 9.81 ( 1 305.9) (308.7 − 303)(0.0393) (1.635 𝑥10−5)2 (0.7274) = 29263.83 𝑁𝑢 = [ 0.6 + 0.387(29263.83) 1 6 [1 + (0.7274)0.559 9 16 ] 8 27 ] 2 = 5.697 ℎ𝑐,𝑐−𝑎 = 0.02609 0.039 (5.697) = 3.81 𝑊/𝑚 2∙ 𝐾 𝑈 = ( 1 (0.0449)(0.79)+ 1 (0.0398)(4.60 + 2.66)) −1 = 0.0321 𝑊/𝐾 𝑇𝑐 = 424 −0.0321 [ 4.94 4.94 + 3.81(424 − 293) + 3.81 4.94 + 3.81(424 − 303)] (0.0449)0.79 = 309.0 𝐾 = 36.0 ℃
When the cover glass temperature is calculated with this new top loss coefficient, it is found to be 36.0 ℃, which is essentially equal to the estimated of 35.7 ℃.
40
Heat Loss Calculations:
(i) Copper Tube Heat Loss:
𝑄̇𝑡,𝑟𝑎𝑑= ℎ𝑟,𝑡−𝑐 𝐴𝑡(𝑇𝑡− 𝑇𝑐)
= 0.79(0.0449)(424 − 309.0) = 4.06 𝑊
(ii) Glass Cover Heat Loss:
𝑄̇𝑐,𝑟𝑎𝑑 = ℎ𝑟,𝑐−𝑎 𝐴𝑐(𝑇𝑐 − 𝑇𝑠) = 4.94(0.0398)(309.0 − 293) = 3.08 𝑊 𝑄̇𝑐,𝑐𝑜𝑛𝑣 = ℎ𝑐,𝑐−𝑎𝐴𝑐(𝑇𝑐− 𝑇𝑎) = 3.81(0.0398)(309.0 − 303) = 0.86𝑊
41 Energy Calculations: Glass Cover: 𝑇𝑟𝑎𝑛𝑠𝑚𝑖𝑠𝑠𝑖𝑣𝑖𝑡𝑦, 𝜏 = 0.75 𝐸𝑚𝑖𝑠𝑠𝑖𝑣𝑖𝑡𝑦, 𝜀𝑐 = 0.80 𝑅𝑒𝑓𝑙𝑒𝑐𝑡𝑖𝑣𝑖𝑡𝑦, 𝛾 = 0.236
Copper tube selective absorber coating:
𝐴𝑏𝑠𝑜𝑟𝑝𝑡𝑖𝑣𝑖𝑡𝑦, 𝛼 = 0.94 𝐸𝑚𝑖𝑠𝑠𝑖𝑣𝑖𝑡𝑦, 𝜀𝑡 = 0.07 (i) 𝑄̇𝑡𝑜𝑡𝑎𝑙 = 1 2𝜏𝛼𝐺𝐴𝑡 = 1 2(0.75)(0.94)(865)(0.0449) = 13.70 𝑊 (ii) 𝑄̇𝑙𝑜𝑠𝑠 ≈ 𝑄̇𝑡,𝑟𝑎𝑑 ≈ 𝑄̇𝑐,𝑟𝑎𝑑 + 𝑄̇𝑐,𝑐𝑜𝑛𝑣 ∴ 𝑄̇𝑙𝑜𝑠𝑠 ≈ 4.03 𝑊 (iii) 𝑄̇𝑔𝑎𝑖𝑛 = 𝑄̇𝑡𝑜𝑡𝑎𝑙− 𝑄̇𝑙𝑜𝑠𝑠 = 13.70 − 4.03 = 9.67 𝑊 (iv) 𝑄̇𝑔𝑎𝑖𝑛 = 𝑚̇𝐶𝑝(𝑇𝑜𝑢𝑡− 𝑇𝑖𝑛) 9.67 = 0.001508333(57.2)( 𝑇𝑜𝑢𝑡− 52) 𝑇𝑜𝑢𝑡 = 164.1 ℃
For Model 1 at 12pm, the calculated refrigerant output temperature is 164.1°C which is essentially equal to the ANSYS simulated output temperature of 166°C. The ANSYS simulation result is further validated with calculations for all five models at different time where the percentage difference is well below 5%. The comparison between calculation and ANSYS simulation is shown in Table 12:
42
TABLE 12. Refrigerant output temperature after evacuated tube solar collector
Refrigerant Output Temperature (°C)
8am 10am 12pm 2pm 4pm 6pm Model 1 ANSYS 107.0 157.0 166.0 168.0 161.0 133.0 Calculation 111.2 157.1 164.1 164.4 159.2 134.2 Model 2 ANSYS 107.0 157.0 165.0 167.0 161.0 132.0 Calculation 103.2 160.0 165.6 165.3 160.4 132.6 Model 3 ANSYS 106.0 155.0 163.0 167.0 159.0 131.0 Calculation 103.2 155.9 164.4 165.3 156.2 132.6 Model 4 ANSYS 107.0 157.0 165.0 167.0 160.0 132.0 Calculation 103.7 155.6 165.6 165.2 160.4 132.6 Model 5 ANSYS 107.0 156.0 164.0 167.0 160.0 132.0 Calculation 105.1 155.8 164.5 165.8 160.2 131.9
4.10 Performance comparison with manufacturer’s data sheet
The performance of the research solar hybrid air conditioning system is compared with the SolAir World Hybrid Solar Air Conditioning System. SolAir World International is an established international company delivering solar air conditioning that provides an innovative energy saving air conditioner by utilising thermal energy to provide cost effective clean green thermal air conditioning comfort. Table 13 and 14 shows the performance of both research and SolAir World solar hybrid air conditioner where the latter is tested under Australia weather condition.
TABLE 13. Solar Hybrid Air Conditioner Performance
Model 1 2 3 4 5 Capacity (btu/h) 10000 13000 18000 19500 24000 Power Input (W) 510-677 655-873 899-1209 983-1316 1243-1655
TABLE 14. SolAir World Hybrid Solar AC Specification – Wall Mounted Units
(SolAir World International, 2014)
Model SWWR-26GV SWWR-35GV SWWR-56GV SWWR-60GV SWWR-72GV Capacity (btu/h) 9000 12000 19000 20000 24000 Power Input (W) 500-680 560-800 1040-1260 1280-1400 1490-1680
43
From the above data, Model SWWR-26GV from SolAir World has capacity of 9000btu/h and requires power input of 500-680W, while Model 1 has slightly higher capacity of 10000btu/h but only requires about the same power input of 510-677W. Next, Model SWWR-35GV from SolAir World has capacity of 12000btu/h and requires power input of 560-800W, while Model 2 has slightly higher capacity of 13000btu/h and requires slightly higher power input of 655-873W.
Following, Model SWWR56GV from SolAir World has capacity of 19000btu/h and requires power input of 1040-1260W, while Model 3 has a lower capacity of 18000btu/h and requires slightly lower power input of 899-1209W.
Next, Model SWWR-60GV from SolAir World has capacity of 20000btu/h while drawing power input of 1280-1400W. Meanwhile, Model 4 sits between Model SWWR-56GV and Model SWWR-60GV and has capacity of 19500btu/h and requires power input of 983-1316W.
Lastly, both Model SWWR-72GV from SolAir World and Model 5 has capacity of 24000btu/h, with power requirement of 1490-1680W and 1243-1655W respectively. Overall, the research solar hybrid air conditioning system shows a comparable performance with the SolAir World system. This indicates the high practicality of solar hybrid air conditioning system in Malaysia.
44 4.11 Cost Analysis
The solar hybrid air conditioning system is evaluated on the electricity bill saving based on 3 operating cycle, typically the office hours, sleeping hours and 24 hours. Offiice hour cycle is from 8am to 6pm while sleeping hour cycle is from 10pm to 6am. The cost analysis is based on TNB electric tariff of RM0.33/kWh. (Tenaga National Berhad Tariff Plan, 2014)
Model 1: Sample Calculation
(i) Air conditioner running from 8AM to 6PM (Office)
TABLE 15. Solar Hybrid Air Conditioning System Performance (8am-6pm)
Time Energy Saving (%) Power Input (W)
8am 26.7 595.1 10am 36.2 514.4 12pm 36.7 510.6 2pm 36.7 510.6 4pm 36.7 510.6 6pm 32.1 549.2 Avg 34.2 531.8
TABLE 16. Air Conditioner Saving Comparison (8am-6pm)
Power (W) Power Consumption/month (kWh) Electricity Bill (RM) Conventional air conditioning system 815.0 244.5 80.69
Solar hybrid air
conditioning system 531.8 159.5 52.65
Saving 283.2 85.0 (34.8%) 28.04
From the calculations for Model 1, operating from 8am to 6pm which is typically office hours, the solar hybrid air conditioning system is able to achieve 34.8% of energy saving which is equivalent to power consumption of 283.2W less than the conventional unit. Throughout the month, the solar hybrid air conditioner consumes 85.0kWh less than the conventional unit, contributing to electricity bill saving of RM28.04 per month.
45
(ii) Air conditioner running from 10PM to 6AM (Bedroom)
TABLE 17. Solar Hybrid Air Conditioning System Performance (10pm-6am)
Time Energy Saving (%) Power Input (W)
10pm 16.8 677.0 12am 16.8 677.0 2am 16.8 677.0 4am 16.8 677.0 6am 16.8 677.0 Avg 16.8 677.0
TABLE 18. Air Conditioner Saving Comparison (10pm-6pm)
Power (W) Power Consumption/month (kWh) Electricity Bill (RM) Conventional air conditioning system 815.0 195.6 64.55
Solar hybrid air
conditioning system 677.0 162.5 53.63
Saving 138.0 33.1 (16.8%) 10.92
From the calculations for Model 1, operating from 10pm to 6am which is typically sleeping hours, the solar hybrid air conditioning system is able to achieve 16.8% of energy saving which is equivalent to power consumption of 138.0W less than the conventional unit. The lower energy saving performance is due to the absence of sunlight at night time. Throughout the month, the solar hybrid air conditioner consumes 33.1kWh less than the conventional unit, contributing to electricity bill saving of RM10.92 per month.
46
(iii) Air conditioner running 24 hours
TABLE 19. Solar Hybrid Air Conditioning System Performance (24hours)
Time Energy Saving (%) Power Input (W)
12am 16.8 677.0 2am 16.8 677.0 4am 16.8 677.0 6am 16.8 677.0 8am 26.7 595.1 10am 36.2 514.4 12pm 36.7 510.6 2pm 36.7 510.6 4pm 36.7 510.6 6pm 32.1 549.2 8pm 16.8 677.0 10pm 16.8 677.0 Avg 25.5 604.4
TABLE 20. Air Conditioner Saving Comparison (24hours)
Power (W) Power Consumption/month (kWh) Electricity Bill (RM) Conventional air conditioning system 815.0 586.8 193.64
Solar hybrid air
conditioning system 604.4 435.2 143.62
Saving 210.6 151.6 (25.8%) 50.02
From the calculations for Model 1, operating for 24 hours, the solar hybrid air conditioning system is able to achieve 25.8% of energy saving which is equivalent to power consumption of 210.6W less than the conventional unit. Throughout the month, the solar hybrid air conditioner consumes 151.6kWh less than the conventional unit, contributing to electricity bill saving of RM50.02 per month.
47
The table below shows the summary of power consumption and total saving for each air conditioner model, operating at 3 different cycles typically the office hours, sleeping hours and 24 hours. The total saving increases with the capacity of the air conditioner. Therefore, Model 5 has the highest total saving, while Model 1 has the least total saving.
TABLE 21. Solar Hybrid Air Conditioner Saving Summary
Power Consumption/month (kWh) Saving Normal air conditioning system
Solar hybrid air conditioning system Total energy saving per month (kWh) Total saving per month (RM) Model 1 8am-6pm 244.5 159.5 85.0 (34.8%) 28.04 10pm-6am 195.6 162.5 33.1 (16.8 %) 10.92 24 hours 586.8 435.2 151.6 (25.8%) 50.02 Model 2 8am-6pm 304.5 207.1 97.4 (32.0%) 32.14 10pm-6am 243.6 210.0 33.6 (13.8%) 11.09 24 hours 730.8 563.4 167.4 (22.9%) 55.24 Model 3 8am-6pm 408.0 286.8 121.2 (29.7%) 40.00 10pm-6am 326.4 290.8 35.6 (10.9%) 11.75 24 hours 979.2 780.4 198.8 (20.3%) 65.60 Model 4 8am-6pm 462.0 307.7 154.3 (33.4%) 50.92 10pm-6am 369.6 315.6 54.0 (14.6%) 17.82 24 hours 1108.8 842.7 266.1 (24.0%) 87.81 Model 5 8am-6pm 669.0 386.0 283.0 (42.3%) 93.39 10pm-6am 535.2 396.6 138.6 (25.9%) 45.74 24 hours 1605.6 1058.1 547.5 (34.1%) 180.68
48
TABLE 22. Conventional and solar hybrid air conditioner estimated price (Yuen Kong Electrical & Ningbo Soenbo Energy Technology, 2015)
Conventional Air Conditioner Solar Hybrid Air Conditioner
Estimated Price (RM) Estimated Price (RM)
Model 1 930 2700
Model 2 1190 3480
Model 3 1970 4950
Model 4 2100 5200
Model 5 2280 6150
From data in Table 21 and 22, breakeven analysis done to determine the financial feasibility of the solar hybrid air conditioning system. Breakeven point is defined as the required time for the solar hybrid air conditioner to shows its cost advantages over the conventional unit. The air conditioners are assumed to be operating at both office hour (8am-6pm) and sleeping hour (10pm-6am). The breakeven analysis for each model are shown in Figure 27, 28, 29, 30 and 31.
49
FIGURE 28. Breakeven analysis - Model 2
FIGURE 29. Breakeven analysis - Model 3
50
FIGURE 31. Breakeven analysis - Model 5
From the breakeven analysis graphs, Model 5 has the shortest breakeven point at 28 months, followed by Model 1 and 4 at 45 months. Next, Model 2 has breakeven point at 55 months. Lastly, Model 3 has the longest breakeven point at 57 months. The solar hybrid air conditioner is initially priced at higher price tag. However, lower electricity consumption makes it more economical in the long run. Generally, the solar hybrid air conditioner can achieve breakeven within 2 to 5 years, depending on usage.