Bridging Performance Analysis Tools and
Analytic Performance Modeling for HPC
Torsten Hoefler
University of Illinois at Urbana-Champaign, IL, USA,
Abstract. Application performance is critical in high-performance com-puting (HPC), however, it is not considered in a systematic way in the HPC software development process. Integrated performance models could improve this situation. Advanced analytic performance modeling and performance analysis tools exist in isolation but have similar goals and could benefit mutually. We find that existing analysis tools could be extended to support analytic performance modeling and performance models could be used to improve the understanding of real application performance artifacts. We show a simple example of how a tool could support developers of analytic performance models. Finally, we propose to implement a strategy for integrated tool-supported performance mod-eling during the whole software development process.
1
Motivation
High performance computing (HPC) software development differs from tradi-tional software development in several aspects. In addition to the forus on relia-bility, correctness and productivity, HPC software development strives to achieve maximum performance. This is reflected throughout the whole development pro-cess and tool-chain. HPC libraries and APIs such as BLAS, LAPACK, and the Message Passing Interface (MPI) focus mostly on the highest performance and performance portability. HPC applications are mostly scientific codes that are usually dominated by floating-point and memory operations and are often reg-ular. Languages such as Fortran and High Performance Fortran thus pick their default semantics (e.g., dense arrays) to support such regular scientific codes.
In addition to the traditional software development tools such as debuggers and profilers, advanced (parallel)performance analysis tools are often necessary to understand the complex performance characteristics of HPC applications. Large scientific codes are often significant investments at a national level, but a clear software engineering methodology that integrates performance into all layers of the development process has not been established yet. The field of performance engineering [15] made some advances in this direction and first strategies exist to incorporate performance models into standard software devel-opment using UML [10, 14].
2
State of the Art
We advocate the idea that performance should play a central role in software development and maintenance. This means that expected performance of codes or parts of codes are expressed asanalytic performance models. The development and maintenance of such models should be supported bytools that become an essential part of HPC software development and maintenance.
In this position paper, we point out that both, performance tools and perfor-mance models, exist separately and could be combined to improve HPC software development. We begin with an (due to space limitations incomplete) overview of the state of the art techniques for performance modeling, which is followed by a similar discussion for performance analysis tools.
2.1 Overview of Analytic Performance Modeling
Performance modeling is important for many aspects of HPC. It has been used to compare system performance, validate large system installations (acceptance testing), for routine tests during the lifetime of a computer system to detect anomalies and degradation, to guide hardwasoftware co-design, to guide re-engineering of large applications, to optimize schedulers and batch systems, and to predict costs to solve a particular scientific problem. Performance models are generally less accurate than actual benchmark studies but allow predicting performance on different systems.
Alam and Vetter propose code annotations, called “Modeling Assertions” [2] that combine empirical and analytical modeling techniques and help the devel-oper to derive performance models for his code. Kerbyson et al. propose a perfor-mance modeling approach [11] that is based on manually developed human ex-pert knowledge about the application. Those modeling techniques rely on empir-ical execution of serial parts on the target architecture and are usually applied to stable codes which limits their usefulness during software development. Snavely et al. uses an application’s memory access pattern and processing requirements to predicts its performance on a target architecture [16]. This approach relies on memory profiles of the application and automated, simulation-based prediction. Hoefler et al. define strategies to trade the accuracy and complexity for modeling the performance of Message Passing Interface implementations [7].
Several other research works, such as [9], use analytic performance model-ing to understand the performance characteristics of different codes or to guide optimizations.
Analytic performance modeling of scientific codes is usually performed in three phases: (1) identify the performance-critical input parameters, (2) formu-late and test a hypothesis about the performance as function of the performance-critical input parameters, and (3) parametrize the function. Empirical modeling strategies that benchmark parts of the code (kernels) on the target architec-ture are often employed to maintain human-manageable performance models. Steps (2) and (3) of developing analytic performance models are often performed with the help of performance tools even though performance tools do not offer
explicit support for the modeling workflow. Analytic performance models strive to capture the applications’ performance characteristics in a
human-understandable form.
2.2 Overview of Performance Analysis Tools
Performance tools are an integral part of the HPC ecosystem. They allow deep insights into the behavior of machines and their performance by displaying the performance characteristics of executed applications. Tools allow us to find bot-tlenecks and tune applications. They can also guide re-engineering of applications and they are often used to collect the data to design application models.
HPCToolkit [1] provides a framework for measurement and analysis of pro-gram performance, collects call path profiles, and can display hierarchical space-time diagrams. Periscope [5] monitors performance online and uses a distributed search to detect performance bottlenecks automatically. This approach omits time-and space-intensive offline trace analysis and allows the specification of “performance properties” to check during runtime. The TAU project [13] offers multiple tracing, profiling, and analysis tools to collect and analyze performance data of large-scale parallel applications. Vampir [12] uses the Open Trace Format and supports the visualization of performance traces and profiles. Scalasca [4] is targeted at large-scale architectures and offers scalable performance views and analyses.
In general, performance tools strive to guide performance analysis by dis-playing performance behavior. This enables users to understand the perfor-mance characteristics. Advanced analysis tools try to support users by pin-pointing possible performance bottlenecks, hotspots, or other potential prob-lems. Fully-automated tools are often imperfect and allow some guidance (such as Periscope’s “performance properties”) to be specified by the user. Perfor-mance tools strive to extract performance properties of applications that enable users to understand application performance.
We now discuss how performance tools and performance-models could be combined to benefit the software development process.
3
Combining Performance Tools and Analytic Modeling
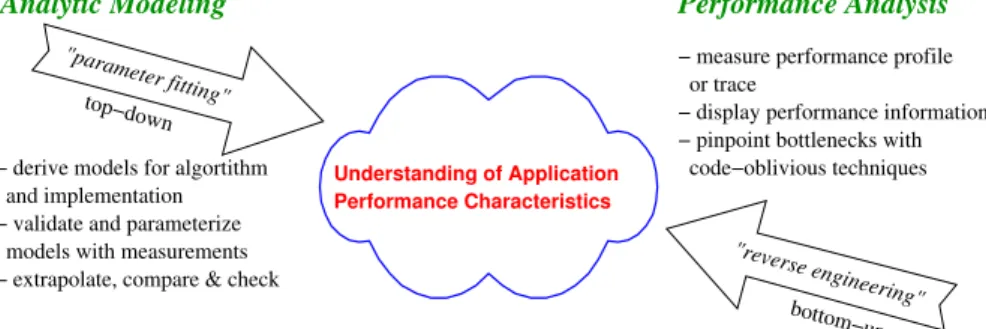
We showed in the previous section that there already exists some overlap be-tween performance analysis tools and analytic performance modeling. Analytic performance modeling can be seen as top-down approach where the user for-mulates an expectation based on an algorithm or implementation and tries to validate and parametrize it to predict performance. Performance analysis tools can be seen as a bottom-up approach that records performance artifacts and strive to trace the artifacts back to the original implementation or algorithm.
It is now obvious that performance analysis and analytic performance mod-eling can benefit from each other. Performance tools could use analytic per-formance models to filter the displayed information or even to pinpoint possi-ble propossi-blems automatically and during runtime. Creating analytic performance
Understanding of Application Performance Characteristics
"reverse engineering"
− derive models for algortithm and implementation − validate and parameterize models with measurements − extrapolate, compare & check
"parameter fitting" − measure performance profile or trace
− display performance information − pinpoint bottlenecks with code−oblivious techniques
Analytic Modeling Performance Analysis
top−down
bottom−up
Fig. 1.Comparison of Performance Modeling and Performance Analysis Approaches
models could benefit largely from effective tool support that could automatize the benchmark and fitting cycle. Both scenarios require human input of an ini-tial model and model inputs (performance-critical input parameters). However, such models are often easy to derive and already used in algorithm design.
We now describe the first option, i.e., how a performance analysis tool could assist users in deriving performance models. For this, we propose a possible work-flow based on tools and human input.
The first step would be to identify performance-critical input parameters. This has to be done by an application expert. Performance-critical input param-eters (calledcritical parameters in the following) are for example the dimensions of the simulated system or parameters that influence convergence. Other param-eters, such as initial starting values (e.g., heats or masses) might not change the runtime of the algorithm and are thus not critical in performance models. More complex parameters such as the shape of the input systems need to be approximated into a single value by the application expert.
The set of critical parameters could now be used by a static analysis frame-work to identify the propagation though the code. This could help to guide the user through the second step, the identification ofcritical blocks which exhibit similar performance characteristics. This often means identifying parts of the call-tree for which the runtime can be modeled by a single analytic expression.
The third step requires the user to define abstract parametric models for the performance of each code block. For example, the user can specify that the expected runtime of a matrix-matrix multiplication isTM M =a+b·(c·N)3
where N is the size of the matrix (a critical input parameter), and a,b,c are parameters that depend on the performance characteristics of the implementation and the target machine. Such performance expectations are often low-order polynomials or simple logarithmic functions and a tool could support the user with defined functions. Additionally, a tool could support modeling of caches by pre-defining segmented functions, such asTM M c=a+min{CN, N} ·b1·(c1·N)3
+ max{N−CN,0}·b2·(c2·N)3
whereCN specifies the number of elementsx·N that can be stored in fast cache-memory. The variablesb1andc1model the in-cache execution and b2 and c2 out-of-cache execution. Such simple transformations can easily be extended to deeper memory hierarchies and supported by tools.
The performance tool could then assist in conducting a series of benchmarks with different values ofN and perform user-guided statistical fits to the target function in order to parametrize the model.
Communication analysis could similarly be guided by tools. A communication model usually includes the number of messages and the communicated sizes for each critical block. Those counts are then used to parametrize network models such as the LogGPS model. Tools and techniques to parametrize the LogGPS machine model exist elsewhere [8].
The model validation phase could similarly be automated with an appropri-ate tool which then benchmarks different parameter configurations in order to certify the model’s prediction. Several well-known methods from statistics exist to perform such checks. This would imply that tools need to be extended to run multiple experiments instead of analyzing only a single experiment.
The two main impediments to wide adoption of analytic performance mod-eling are (1) that the software developer needs to be familiar with the details of the modeling strategy and (2) the necessary manual work and missing standard-ization and guidance for notation (cf. UML). The proposed tool-support would address both in that it offers an integrated interface to performance analysis and performance modeling. Tools would also be able to adopt UML-like syntax and add performance assertions (cf. [10, 14]). This would enhance the software development cycle in HPC and help the developers to focus on end-to-end per-formance and thus improve productivity.
4
A Motivating Modeling Example: MILC
We now present a brief overview about manual analytic performance modeling for the MIMD Lattic Computation (MILC) code [3]. This code is highly regular and the code- and data-flow is mostly deterministic and very structured. The balanced computation is performed on a regular four-dimensional grid.
The critical parameters of the MILC code are the size of each dimension
nx, ny, nz, nt, the number of warmups (warms) and trajectories (trajecs), steps per trajectory (steps) and trajectories between measurements (meas). The number of CG iterations is determined by different input parameters (masses and convergence factors) but a single step usually requires around 2,100 iterations.
Identifying the critical blocks can often be done by analyzing the call-graph and identifying subtrees with common performance characteristics. The MILC developers already identified five significant blocks: (1) LL (load longlinks), (2) FL (load fatlinks), (3) CG (ks congrad), (4) GF (imp gauge force), and (5) FF (eo fermion force twoterms).
The expected runtime of each of the serial blocks scales linearly with the number of grid points per processV. Thus, a simple linear function, for example TGF(V) =t1,GF ·V can be used to model the performance. In order to model the cache hierarchy, we split the linear model into two piecesTGF(V) =t1,GF · min{sGF, V}+t2,GF·max{0, V −sGF}witht1,GF being the in-cache time per grid point andt2,GF being the out-of-cache time.
Parametrizingt1,GF andt2,GF and finding the exact switching pointsis usu-ally done via curve-fitting. Figure 2(a) shows the benchmarked and parametrized model (t1,GF = 88µs,t2,GF= 157µs, andsGF = 1900). The model was parametrized by least-squares curve-fitting which could be easily supported by tools. This time-consuming step needs to be repeated for each target architecture and can easily be automatized. 0 500 1000 1500 2000 2500 0 5000 10000 15000 0 20 40 60 80 100 120 140 Time [ms] Relative Error [%]
Grid Points per Process (L) Model Function
Model Error
(a)TGF measured and modeled
0 500 1000 1500 2000 2500 3000 0 5000 10000 15000 Time [ms]
Grid Points per Process (L) 16
256 1024 Model
(b) Parallel model and benchmark forGF
Fig. 2.Performance Modeling on POWER5+.
A complete serial application model can now be constructed from either a detailed understanding of the code execution or by analyzing multiple different program runs and observing the number of invocations of each critical block. The complete serial model for MILC is a simple linear model:
Tserial(V) = (trajecs+warms)·steps·[TF F(V) +TGF(V) + 3(TLL(V) + TF L(V))] + trajecs meas [TLL(V) +TF L(V)] +niters·TCG(V) Parallel execution models can often be derived from serial performance mod-els. For MILC, it is sufficient to add the communication overheads to the serial time. The communication overhead depends on the number and sizes of messages sent via point-to-point and collective communication calls. Those parameters can either be derived from the source-code or measured with performance tools. Using the latter approach, we were able to construct a simple linear model for de-tailed message counts and sizes for nearest-neighbor (along the four-dimensional grid) and collective (CG convergence checks) communication. We omit the de-tailed linear equations for brevity. Tool support for automatic counting and data correlation could improve productivity significantly.
Figure 2(b) shows the parallel performance model forGFon 16, 256, and 1024 CPUs. The used LogGPS model ignores congestion and shows thus some little deviation from the benchmark for largeV.
4.1 Application of the Model
After successfully deriving and parametrizing the model for POWER5+, we are able to make a first prediction for the performance of a large-scale system like
Blue Waters. At this point, there is only a single POWER7 MR system available for testing but the network parameters are known to us. First, we construct a serial performance model as described before. Figure 3(a) shows the serial model in comparison to POWER5+. Figure 3(b) shows the parallel model prediction for 1,024 CPUs. 0 10000 20000 30000 40000 50000 60000 0 5000 10000 15000 0 1 2 3 4 5 6 Time [ms] Relative Speedup
Grid Points per Process (L) Model Function (P7MR)
Model Function (P5+) Speedup over P5+
(a) Serial Performance Model
0 50000 100000 150000 200000 250000 300000 350000 0 5000 10000 15000 0 20 40 60 80 100 Time [ms] Communication Overhead [%]
Grid Points per Process (L) Serial Model Model P=1024 Comm. Overhead Pack Overhead
(b) Parallel Performance Model
Fig. 3.Performance Models of POWER7 MR.
The parallel model allows us to predict the performance and identify potential improvements. For example, a possible optimization which could save up to 15% for small V is the replacement of the pack routine with MPI Datatypes. The benefits of this approach were demonstrated in practice [6].
5
Summary and Conclusion
We support the idea of making analytic performance modeling part of the HPC software development cycle in order to improve programmer productivity and code maintainability.
We show that a huge body of knowledge, techniques and tools exist in the analytic performance modeling and the performance analysis tools communities. We show how performance tools and performance modeling could mutually ben-efit from each other and we propose an easy roadmap to extend existing tools with the capability to support simple performance models.
We also show a simplified exemplary model for the MILC application which could be used as a starting point to explore tool support for analytic performance modeling. More complex (less regular) applications most likely require more advanced techniques. However, techniques like clustering are already employed in current performance analysis tools such as Vampir and TAU.
We propose to both communities to analyze the mutual benefits and develop a roadmap to synchronize the efforts in analytic modeling and performance anal-ysis.
Acknowledgments The author thanks William Gropp, Bill Kramer, and Marc Snir for many helpful discussions and ideas regarding concepts of analytic mod-eling. Thanks to Steven Gottlieb for discussions about MILC and Shirley Moore, Fredrik Kjolstad and all anonymous reviewers for comments on early drafts of this work.
References
1. Adhianto, L., et al.: HPCTOOLKIT: tools for performance analysis of optimized parallel programs. Concurr. Comput. : Pract. Exper. 22(6), 685–701 (2010) 2. Alam, S., Vetter, J.: A framework to develop symbolic performance models of
parallel applications. Parallel and Distributed Processing Symposium 0, 368 (2006) 3. Bernard, C., Ogilvie, M.C., DeGrand, T.A., DeTar, C.E., Gottlieb, S.A., Krasnitz, A., Sugar, R., Toussaint, D.: Studying Quarks and Gluons On MIMD Parallel Computers. Intl. Journal of High Perf. Comp. Applications 5(4), 61–70 (1991)
4. Geimer, M., Wolf, F., Wylie, B.J.N., ´Abrah´am, E., Becker, D., Mohr, B.: The
Scalasca performance toolset architecture. Concurr. Comput. : Pract. Exper. 22(6), 702–719 (2010)
5. Gerndt, M., Ott, M.: Automatic performance analysis with Periscope. Concurr. Comput. : Pract. Exper. 22(6), 736–748 (2010)
6. Hoefler, T., Gottlieb, S.: Parallel Zero-Copy Algorithms for Fast Fourier Transform and Conjugate Gradient using MPI Datatypes. In: Recent Advances in the Message Passing Interface (EuroMPI’10). vol. LNCS 6305, pp. 132–141. Springer (Sep 2010) 7. Hoefler, T., Gropp, W., Thakur, R., Traeff, J.L.: Toward Performance Models of MPI Implementations for Understanding Application Scaling Issues. In: Recent Advances in the Message Passing Interface (EuroMPI’10). vol. LNCS 6305, pp. 21–30. Springer (Sep 2010)
8. Hoefler, T., Lichei, A., Rehm, W.: Low-Overhead LogGP Parameter Assessment for Modern Interconnection Networks. In: Proceedings of the 21st IEEE International Parallel & Distributed Processing Symposium (March 2007)
9. Hongzhang, Strohmaier, E., Qiang, J., Bailey, D.H., Yelick, K.: Performance Mod-eling and Optimization of a High Energy Colliding Beam Simulation Code. Super-computing, SC06 p. 48 (2006)
10. Hopkins, R.P., Smith, M.J., King, P.J.B.: Two approaches to integrating UML and performance models. In: WOSP ’02: Proceedings of the 3rd international workshop on Software and performance. pp. 91–92. ACM, New York, NY, USA (2002) 11. Kerbyson, D.J., et al.: Predictive performance and scalability modeling of a
large-scale application. In: Proceedings of the 2001 ACM/IEEE conference on Super-computing (CDROM). pp. 37–37. ACM, New York, NY, USA (2001)
12. Kn¨upfer, A., Brunst, H., Doleschal, J., Jurenz, M., Lieber, M., Mickler, H., M¨uller, M.S., Nagel, W.E.: The Vampir Performance Analysis Tool-Set. In: Tools for High Performance Computing. pp. 139–155. Springer Berlin Heidelberg (2008)
13. Lee, C.W., Malony, A.D., Morris, A.: TAUmon: Scalable Online Performance Data Analysis in TAU. In: 3rd Workshop on Productivity and Performance (Aug 2010) 14. Pllana, S., Fahringer, T.: UML based modeling of performance oriented parallel
and distributed applications. Winter Simulation Conference 1, 497–505 (2002) 15. Pooley, R.: Software engineering and performance: a roadmap. In: ICSE ’00:
Pro-ceedings of the Conference on The Future of Software Engineering. pp. 189–199. ACM, New York, NY, USA (2000)
16. Snavely, A., Carrington, L., Wolter, N., Labarta, J., Badia, R., Purkayastha, A.: A framework for performance modeling and prediction. In: Supercomputing, SC02. pp. 1–17. Los Alamitos, CA, USA (2002)