SFB 649 Discussion Paper 2005-058
Integrable e-lements for
Statistics Education
Wolfgang Härdle*
Sigbert Klinke*
Uwe Ziegenhagen*
* Center for Applied Statistics and Economics, Humboldt-Universität zu Berlin
This research was supported by the Deutsche
Forschungsgemeinschaft through the SFB 649 "Economic Risk". http://sfb649.wiwi.hu-berlin.de
S
FB
6
49
E
C
O
N
O
M
I
CR
I
SK
B
ER
L
I
N
Integrable
e
-lements for Statistics
Education
∗
Wolfgang H¨
ardle, Sigbert Klinke and Uwe Ziegenhagen
Humboldt-Universit¨
at zu Berlin
Center for Applied Statistics and Economics
Abstract
Without doubt modern education in statistics must involve practical, computer-based
data analysis but the question arises whether and how computational elements should
be integrated into the canon of methodological education. Should the student see and
study high-level programming code right at the beginning of his or her studies? Which
technology can be presented during class and which computational elements can re-occur
(at increasing level of complexity) during the different courses?
In this paper we address these questions and discuss where
e
-techniques have their limits
in statistics education.
Keywords
electronic books, hypertext, e-supported teaching, statistical software
JEL codes
I21, C19,
∗
This research was supported by the Deutsche Forschungsgemeinschaft through the SFB 649 ”Economic Risk”.
1 Introduction
Since the entering of modern computing equipment into schools and universities there have
been increased efforts to use computers not only for research and numerical computations
but also for the education of students. While traditional textbooks on statistics are
usually restricted to small examples, computers offer great opportunities to enrich the
teaching of statistics by the means of explaining animations or on-the-fly computations
of large real-world datasets.
But each new technology does not only hold opportunities and advantages there may also
be hazards or risks. And a sentence stated by John Tukey in 1965 should be taken into
consideration: ”Each new generation of computers offers us new possiblities, at a time
when we are far from using most of the possibilities offered by those already obsolete.”
We will outline our thoughts about the integration of electronic and computational
elements into statistics along the courses tought at the School for Business and Economics
of Humboldt-Universit¨
at zu Berlin.
Students following different course programs are taught at the Institute for Statistics
and Econometrics at Humboldt-Universit¨
at zu Berlin, German Business Administration
and Economics students as well as students from international bachelor or master classes
or the math department.
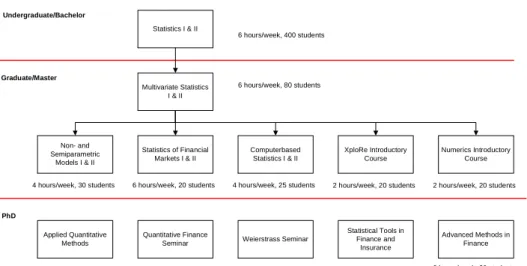
After finishing the bachelor level, where statistics is taught in a two-term lecture three
hours a week, the students who choose statistics as one main subject are required to
take a course on multivariate data analysis, that enables them to understand the basics
of probability theory and to analyze high-dimensional data by the means of cluster-,
principal component- and factor analysis.
On the basis of this lecture the student has further options: While
Non- and
Semipara-metric Modelling
focuses on nonparametric density estimation and regression the student
learns in the computational statistics courses the applied data analysis with SPSS and
real world data. Supplementary to the
Computerbased Statistics
courses are the
XploRe
Introductory Course
and the
Numerics Introductory Course
focussing on the practical
work with XploRe respectively the numerical details of selected algorithms.
Statistics of financial markets is the third specialisation taught at Humboldt-Universit¨
at,
covered are theoretical and practical aspects of option pricing, risk-management and
time series modelling.
Statistics I & II Multivariate Statistics I & II Statistics of Financial Markets I & II Non- and Semiparametric Models I & II Computerbased Statistics I & II Applied Quantitative Methods Quantitative Finance Seminar 6 hours/week, 400 students 6 hours/week, 80 students Weierstrass Seminar 4 hours/week, 30 students 6 hours/week, 20 students 4 hours/week, 25 students
2 hours/week, 20 students 2 hours/week, 20 students 2 hours/week, 20 students
Undergraduate/Bachelor Graduate/Master PhD XploRe Introductory Course Statistical Tools in Finance and Insurance 2 hours/week, 20 students Advanced Methods in Finance 2 hours/week, 20 students Numerics Introductory Course
2 hours/week, 20 students 2 hours/week, 20 students
Figure 1: Typical one year cycle of statistics courses in Berlin
At the master level there are currently five courses also aimed at PhD students: In
Applied
Quantitative Methods
and the
Weierstrass Seminar
recent developments of mathematical
statistics and data analysis are discussed,
Advanced Methods in Finance
, the
Quantitative
Finance Seminar
and
Statistical Tools in Finance and Insurance
deal with the field of
financial mathematics.
2 Traditional and Modern Teaching Material
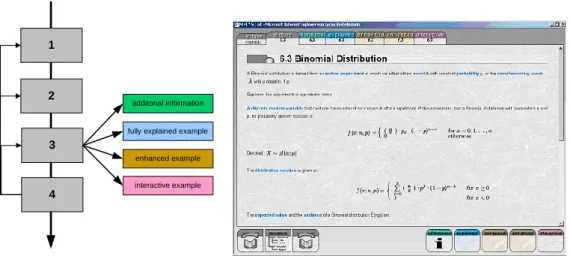
The main components of MM*Stat (M¨
uller, M., R¨
onz, B., Ziegenhagen, U., 2000), that
was developed to support the undergraduate teaching of statistics, are
lecture units
,
additional information
and
(non)interactive examples
, presented in a style similar to
fil-ing cards. This structure, called
MD*Booklet
, has also been used for
Numerical Methods in
Statistics
and
Finance Introductory Course
(http://www.quantlet.com/mdstat/products.html).
The lecture units contain common and well-known topics as basic concepts of statistics,
basics of probability calculus and sampling theory.
Each ”lecture” filing card provides the basic concepts of the methods considered together
with definitions, important formulas and graphics. ”Fully explained”, ”Enhanced” and
”Interactive” examples show how these formulas can be applied. The first explain
standard classbook examples in detail while the latter discuss important aspects of more
advanced examples. The interactive examples are one of the main features of MM*Stat.
By using a combination of embedded Java-based
XploRe Quantlet Client
(Borak, S.,
1
4 3 2
additonal information
fully explained example
enhanced example
interactive example
sequence of lectures
hyperlinked lectures
Figure 2: MM*Stat: Layer Architecture and Screenshot
H¨
ardle, W., Lehmann, H., 2005) and a remote or locally installed
XploRe Quantlet Server
the student can compute distribution functions, histograms and test results. Compared
with classical textbooks where effects of parameter changes can only be presented as
sequence of graphics or tables, the user can experience the results of different settings in
realtime.
The repetition of concepts and methods introduced earlier has been implemented in two
different ways: To see or recall the definition of a used term, a glossary has been written
and important words within the different lectures inside MM*Stat are linked to this
glossary. Furthermore the student can complete multiple choice questions by selecting
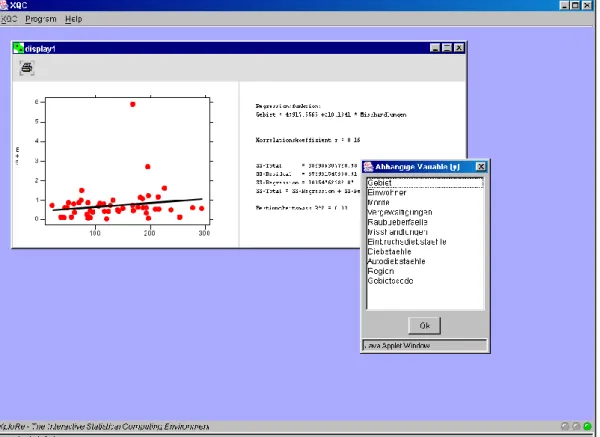
Figure 3: Example for linear regression in MM*Stat
The target group of MM*Stat, the undergraduate students, have different levels of literacy
concerning computers, while some are firm in common office software tools others have
little experience. So it was decided to hide the source code of the interactive examples
from the user, to lower the inhibition threshold of using the software. Figure 3 shows a
typical example for linear regression, which allows the user to choose the dependent and
independent variable and returns the regression plot and the parameters of the model.
The combination of XploRe Quantlet Server and Client has not only been used in
MM*Stat, furthermore it is used in the DoSS@d system (Mori, Y., Yamamoto, Y. and
Yadohisa, H., 2003) and the books published by the members of the authors’ institute
(http://www.xplore-stat.de/ebooks/ebooks.html) also use this framework, although in a
different way.
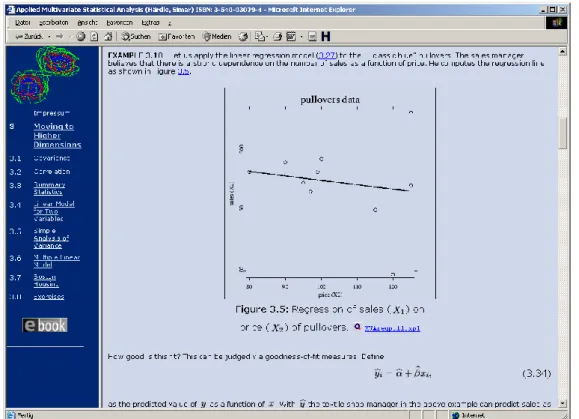
As mentioned the source code for the interactive examples was hidden from the user in
MM*Stat, from the target group of the advanced books, graduate and PhD students
on the one, researchers and professional on the other hand, we assume a certain level
of computational literacy. In each book respectively the corresponding slides selected
pages contain links to HTML-pages that contain the source code of the example as well
as links to two different implementations of this example.
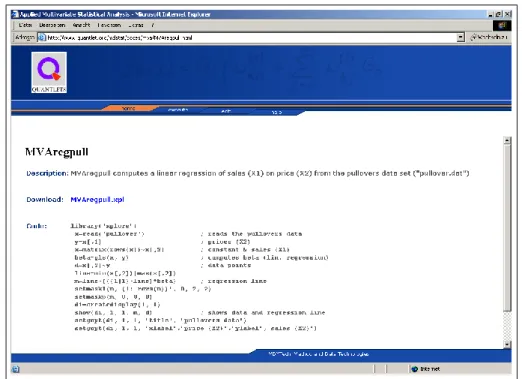
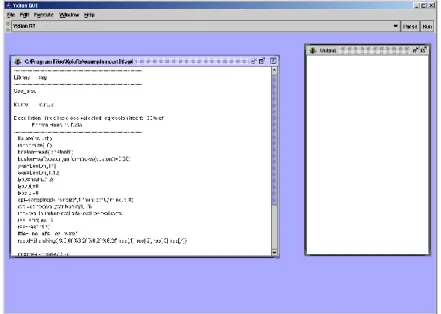
These two implementations differ in that sense that the ’edit’ page calls the XploRe
Figure 4: Applied Multivariate Statistics: HTML page with link to an example
code of the example. From MM*Stat they vary from the textual component. While at
undergraduate level regression is taught using a notation with sums, the more abstract
matrix-based approach is used for graduate students.
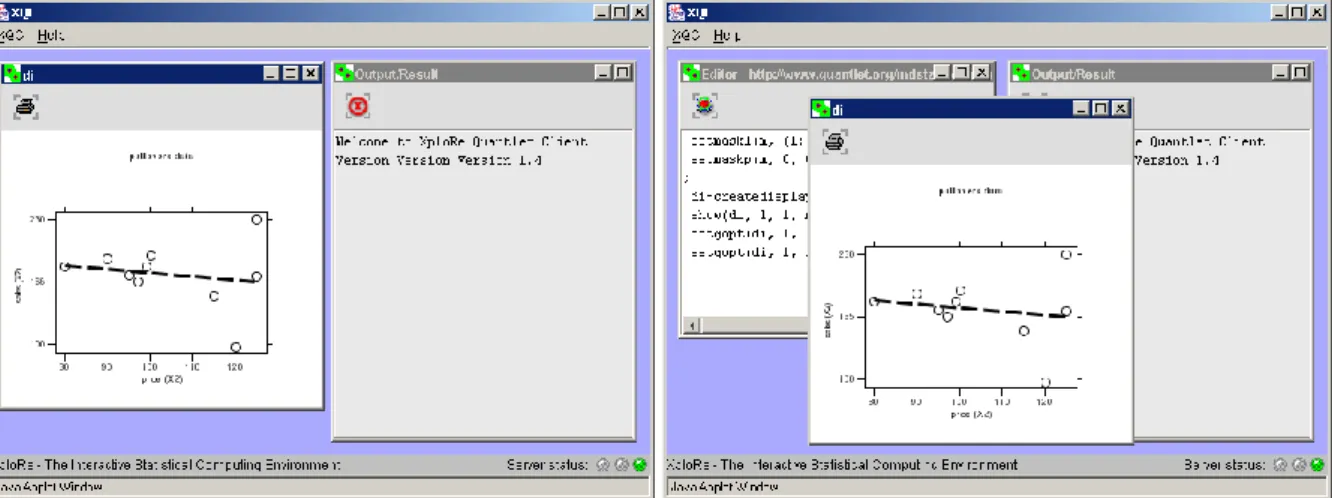
Figure 5 depicts two screenshort from the book
Applied Multivariate Analysis
by W.
H¨
ardle and L. Simar, on the left hand side the ’run’ version of the quantlet, on the right
the editable ’edit’ version.
3 XploRe, Xplore Quantlet Server and Yxilon
Besides SPSS which is used for the computational statistics courses the software package
XploRe is used for educating students at Humboldt-Universit¨
at. Developed in
coop-eration with MD*Tech (http://www.mdtech.de), XploRe is a full-featured statistical
programming language. Using a matrix-oriented approach in combination with a C-style
syntax a great variety of diverse statistical problems can be handled conveniently.
Figure 5: Applied Multivariate Statistics:
execute
and
edit
versions of an example
The implementation of XploRe incorporates ideas from the requirements of statistical
software mentioned by Chambers and Lang (1999): usage from multiple front-ends,
extensibility on language and native core level, interactive graphics and the inclusion of
existing code (
C
,
Fortran
).
With Yxilon (Guril, Y., Klinke, S., Ziegenhagen, U., 2005) MD*Tech and
Humboldt-Universit¨
at zu Berlin agreed on a new research project with the aim to supply a freely
available statistical environment and to allow the implementation of recent developments
in software technology while remaining fully compatible with XploRe.
The most dramatic change compared with XploRe or other packages as
R
or
Jasp
(Fujiwara, T., Ikunori K. et al. 2000) is the way the code is executed: Besides the
interpretation by a so called runtime environment the idea is to compile directly to C++
and Java. Further changes are:
•
published under Free-BSD license
•
fully independent from machine architecture by using platform-independent
proto-cols and software frameworks
•
improved modularity to allow convenient exchange of single components
•
integration of dynamic data sources as databases and webservices
•
increased computing performance simplifying the language definitions
•
improved integration into standard office and business software
The software architecture of Yxilon is shown in Figure 9. Via a graphical or non-graphical
user interface the user accesses the system. All objects and information are held in
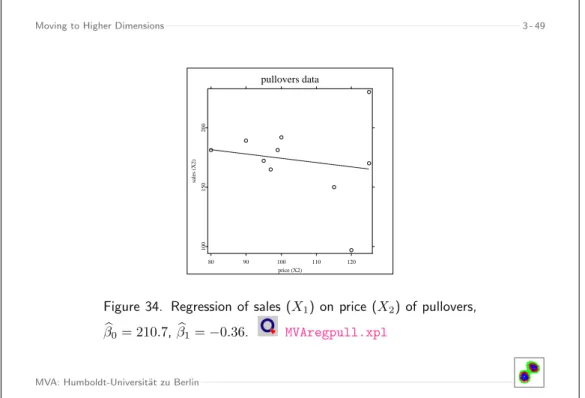
Moving to Higher Dimensions 3 - 49 pullovers data 80 90 100 110 120 price (X2) 100 150 200 sales (X2)
Figure 34. Regression of sales (X1) on price (X2) of pullovers,
b
β0= 210.7,βb1=−0.36. MVAregpull.xpl
MVA: Humboldt-Universit¨at zu Berlin
Figure 6: Applied Multivariate Statistics: slide with link to an example
environment. The parser takes the sourcecode provided by the user and converts them to
either Java/C++ code or a binary format directly readable by the runtime engine. The
advantage of source conversion is that the high-level, interpreted XploRe code, which is
slower than binary code, can be compiled by the Java or C++ compiler to fast running
machine code. Especially for computing-intensive applications as bootstrapping and
simulation we expect significant improvements concerning execution time.
Figure 7: Applied Multivariate Statistics: homepage of the linked example
Object Database Parser C/C++ ... Java Compiler Parse Tree Runtime Environment JAR DLL/SO Oracle ... ODBC/JDBC MySQL Databases Text Interface GUI Soap/XML COM Applet Client ... Sends programs sends data and quantlets interpretes creates creates programs manipulates objects creates output interpretation branch compilation branch manipulates objects creates outputFigure 9: Screenshot of the Yxilon graphical user interface
4 Limits of e-lements in statistics education
Electronic and computational elements in education can be limited from a variety of
different reasons as the technical implementation or the educational approach.
MM*Stat relies on a complex framework of HTML, Cascading Style Sheets, Java and
JavaScript. While HTML and Java were already well-established standards, JavaScript
and Cascading Style Sheets were implemented in different ways for each browser, so
extensive work for each major webbrowser had to be invested.
From the educational point of view each use of electronic media should be questioned
carefully. An analysis by Brandes, U. (2004) showed no significant improvements in the
results of those students who used MM*Stat in comparison to those who used classical
textbooks. The educational limits also lie in the way the information is presented. The
classical way of using a textbook or blackboards also offers the opportunity to include
on-the-fly notes from either the teacher or the student. Electronic teaching solutions
either do not offer this capability at all or require significant technical ressources.
References
Borak, S., H¨
ardle, W., Lehmann, H. (2005), Working with the XQC, IN: Statistical Tools
for Finance and Insurance, editors: Cizek, P., H¨
ardle, W., Weron, R., Springer Verlag
Brandes, U. (2004). Statistische Bewertung und Analyse der Klausurergebnisse Statistik
(Statistical analysis of exam results in statistics undergraduate courses), diploma thesis,
Humboldt-Universit¨
at zu Berlin
Chambers, J. and Lang, D. T. (1999). Omegahat – A Component-based Statistical
Computing Environment, Proceedings of the 52nd Session of the ISI, Helsinki, Finland.
Fujiwara, T., Ikunori K., Nakano, J., Yoshikazu, Y. (2000). A Statistical Package Based
on Pnuts, In: COMPSTAT. Proceedings in Computational Statistics, Physica Verlag
Guril, Y., Klinke, S., Ziegenhagen, U. (2005). Yxilon – a Modular Open-Source
Statis-tical Programming Language, In: Proceedings of the 55th Session of the International
Statistical Institute (ISI), Sydney, Australia
Mori, Y., Yamamoto, Y. and Yadohisa, H. (2003). Data-oriented Learning System of
Statistics based on Analysis Scenario/Story (DoLStat). Bulletin of the International
Statistical Institute (ISI).
M¨
uller, M., R¨
onz, B., Ziegenhagen, U.(2000). The Multimedia Project MM*Stat for
Teaching Statistics, In: COMPSTAT. Proceedings in Computational Statistics, Physica
SFB 649 Discussion Paper Series
For a complete list of Discussion Papers published by the SFB 649,
please visit http://sfb649.wiwi.hu-berlin.de.
001 "Nonparametric Risk Management with Generalized Hyperbolic Distributions" by Ying Chen, Wolfgang Härdle and Seok-Oh Jeong, January 2005.
002 "Selecting Comparables for the Valuation of the European Firms" by Ingolf Dittmann and Christian Weiner, February 2005.
003 "Competitive Risk Sharing Contracts with One-sided Commitment" by Dirk Krueger and Harald Uhlig, February 2005.
004 "Value-at-Risk Calculations with Time Varying Copulae" by Enzo Giacomini and Wolfgang Härdle, February 2005.
005 "An Optimal Stopping Problem in a Diffusion-type Model with Delay" by Pavel V. Gapeev and Markus Reiß, February 2005.
006 "Conditional and Dynamic Convex Risk Measures" by Kai Detlefsen and Giacomo Scandolo, February 2005.
007 "Implied Trinomial Trees" by Pavel Čížek and Karel Komorád, February 2005.
008 "Stable Distributions" by Szymon Borak, Wolfgang Härdle and Rafal Weron, February 2005.
009 "Predicting Bankruptcy with Support Vector Machines" by Wolfgang Härdle, Rouslan A. Moro and Dorothea Schäfer, February 2005.
010 "Working with the XQC" by Wolfgang Härdle and Heiko Lehmann, February 2005.
011 "FFT Based Option Pricing" by Szymon Borak, Kai Detlefsen and Wolfgang Härdle, February 2005.
012 "Common Functional Implied Volatility Analysis" by Michal Benko and Wolfgang Härdle, February 2005.
013 "Nonparametric Productivity Analysis" by Wolfgang Härdle and Seok-Oh Jeong, March 2005.
014 "Are Eastern European Countries Catching Up? Time Series Evidence for Czech Republic, Hungary, and Poland" by Ralf Brüggemann and Carsten Trenkler, March 2005.
015 "Robust Estimation of Dimension Reduction Space" by Pavel Čížek and Wolfgang Härdle, March 2005.
016 "Common Functional Component Modelling" by Alois Kneip and Michal Benko, March 2005.
017 "A Two State Model for Noise-induced Resonance in Bistable Systems with Delay" by Markus Fischer and Peter Imkeller, March 2005.
018 "Yxilon – a Modular Open-source Statistical Programming Language" by Sigbert Klinke, Uwe Ziegenhagen and Yuval Guri, March 2005.
019 "Arbitrage-free Smoothing of the Implied Volatility Surface" by Matthias R. Fengler, March 2005.
020 "A Dynamic Semiparametric Factor Model for Implied Volatility String Dynamics" by Matthias R. Fengler, Wolfgang Härdle and Enno Mammen, March 2005.
021 "Dynamics of State Price Densities" by Wolfgang Härdle and Zdeněk Hlávka, March 2005.
022 "DSFM fitting of Implied Volatility Surfaces" by Szymon Borak, Matthias R. Fengler and Wolfgang Härdle, March 2005.
023 "Towards a Monthly Business Cycle Chronology for the Euro Area" by Emanuel Mönch and Harald Uhlig, April 2005.
024 "Modeling the FIBOR/EURIBOR Swap Term Structure: An Empirical Approach" by Oliver Blaskowitz, Helmut Herwartz and Gonzalo de Cadenas Santiago, April 2005.
025 "Duality Theory for Optimal Investments under Model Uncertainty" by Alexander Schied and Ching-Tang Wu, April 2005.
026 "Projection Pursuit For Exploratory Supervised Classification" by Eun-Kyung Lee, Dianne Cook, Sigbert Klinke and Thomas Lumley, May 2005. 027 "Money Demand and Macroeconomic Stability Revisited" by Andreas
Schabert and Christian Stoltenberg, May 2005.
028 "A Market Basket Analysis Conducted with a Multivariate Logit Model" by Yasemin Boztuğ and Lutz Hildebrandt, May 2005.
029 "Utility Duality under Additional Information: Conditional Measures versus Filtration Enlargements" by Stefan Ankirchner, May 2005.
030 "The Shannon Information of Filtrations and the Additional Logarithmic Utility of Insiders" by Stefan Ankirchner, Steffen Dereich and Peter Imkeller, May 2005.
031 "Does Temporary Agency Work Provide a Stepping Stone to Regular Employment?" by Michael Kvasnicka, May 2005.
032 "Working Time as an Investment? – The Effects of Unpaid Overtime on Wages, Promotions and Layoffs" by Silke Anger, June 2005.
033 "Notes on an Endogenous Growth Model with two Capital Stocks II: The Stochastic Case" by Dirk Bethmann, June 2005.
034 "Skill Mismatch in Equilibrium Unemployment" by Ronald Bachmann, June 2005.
035 "Uncovered Interest Rate Parity and the Expectations Hypothesis of the Term Structure: Empirical Results for the U.S. and Europe" by Ralf Brüggemann and Helmut Lütkepohl, April 2005.
036 "Getting Used to Risks: Reference Dependence and Risk Inclusion" by Astrid Matthey, May 2005.
037 "New Evidence on the Puzzles. Results from Agnostic Identification on Monetary Policy and Exchange Rates." by Almuth Scholl and Harald Uhlig, July 2005.
038 "Discretisation of Stochastic Control Problems for Continuous Time Dynamics with Delay" by Markus Fischer and Markus Reiss, August 2005.
039 "What are the Effects of Fiscal Policy Shocks?" by Andrew Mountford and Harald Uhlig, July 2005.
040 "Optimal Sticky Prices under Rational Inattention" by Bartosz Maćkowiak and Mirko Wiederholt, July 2005.
041 "Fixed-Prize Tournaments versus First-Price Auctions in Innovation Contests" by Anja Schöttner, August 2005.
042 "Bank finance versus bond finance: what explains the differences between US and Europe?" by Fiorella De Fiore and Harald Uhlig, August 2005.
043 "On Local Times of Ranked Continuous Semimartingales; Application to Portfolio Generating Functions" by Raouf Ghomrasni, June 2005.
044 "A Software Framework for Data Based Analysis" by Markus Krätzig, August 2005.
045 "Labour Market Dynamics in Germany: Hirings, Separations, and Job-to-Job Transitions over the Business Cycle" by Ronald Bachmann, September 2005.
SFB 649, Spandauer Straße 1, D-10178 Berlin http://sfb649.wiwi.hu-berlin.de
046 "Paternal Uncertainty and the Economics of Mating, Marriage, and Parental Investment in Children" by Dirk Bethmann and Michael Kvasnicka, September 2005.
047 "Estimation and Testing for Varying Coeffcients in Additive Models with Marginal Integration " by Lijian Yang, Byeong U. Park, Lan Xue and Wolfgang Härdle, September 2005.
048 "Zeitarbeit in Deutschland: Trends und Perspektiven" by Michael C. Burda and Michael Kvasnicka, September 2005.
049 "Courtesy and Idleness: Gender Differences in Team Work and Team Competition" by Radosveta Ivanova-Stenzel and Dorothea Kübler, September 2005.
050 "Do Factor Shares Reflect Technology?" by Benjamin Bental and Domonique Demougin, September 2005.
051 "Optimal investments for risk- and ambiguity-averse preferences: A duality approach" by Alexander Schied, September 2005.
052 "Relational Contracts and Job Design" by Anja Schöttner, September 2005.
053 "Explicit characterization of the super-replication strategy in financial markets with partial transaction costs" by Imen Bentahar and Bruno Bouchard, October 2005.
054 "Aid Effectiveness and Limited Enforceable Conditionality" by Almuth Scholl, August 2005.
055 "Limited Enforceable International Loans, International Risk Sharing and Trade" by Almuth Scholl, August 2005.
056 "Stock Markets and Business Cycle Comovement in Germany before World War I: Evidence from Spectral Analysis" by Albrecht Ritschl and Martin Uebele, November 2005.
057 "An empirical test of theories of price valuation using a semiparametric approach, reference prices, and accounting for heterogeneity" by Yasemin Boztuğ and Lutz Hildebrandt, November 2005.
058 "Integrable e-lements for Statistics Education" by Wolfgang Härdle, Sigbert Klinke and Uwe Ziegenhagen, December 2005.