1 Introduction
The growing development of computer networks has been accompanied by an increasing number of victims of illegal access and computer viruses or worms[1]. To prevent these incidents, it has become commonplace to use firewall and “vaccine” software pro-grams. More recently, security measures have included network-level monitoring or alliances with security equipment, using intru-sion detection systems (IDS) and intruintru-sion prevention systems (IPS). However, given that the number of victims is still on the rise, it is clear that these measures are not fully effec-tive in preventing such incidents. In addition to taking protective measures against intru-sions, it is necessary to check continuously for anomalous events and to respond accordingly. However, the greater use of computer net-works has led to an increase in the number of nodes and in the complexity of network con-figurations. For large organizations operating in geographically dispersed locations, it is becoming difficult to check the various nodes that make up the computer network. This
checking and analysis is now largely depen-dent on the advanced skills of network admin-istrators. However, it is not always possible to hire sufficiently capable administrators. More-over, if a computer network consists of geo-graphically dispersed sub-networks, a differ-ent administrator must be assigned to each location.
These problems have recently been addressed by technology developed for the efficient management of multivendor comput-er networks, such as Web Based Entcomput-erprise Management (WBEM)[2][3]and Application Resource Management (ARM)[4]. This tech-nology is effective in managing various machines within an organization, but this highly integrated mechanism may not be used for central management of networks operated by different organizations. This is mainly because the respective organizations are unable to cede network management authority to third parties.
However, we believe that it remains possi-ble to establish loosely knit coordinated rela-tionships in which organizations can exchange the appropriate messages or inquiries upon
2-6 Log Management System Based on
Dis-tributed Database Using P2P Network
KAMIO Masakazu, ISHIDA Tsunetake, and HAKODA Takahisa
It is necessary to investigate the phenomena in order to perform the countermeasures to ille-gal access on computer network, and it is aimed against the logs from network nodes. Now these investigations and analysis greatly depend on network administrators with advanced tech-nology. But the number of the nodes is increasing along with the computer network expansion, and the investigations are becoming more difficult. So we are researching and developing the log management system based on the distributed database, which enables efficient log manage-ment and analysis under the large-scale network environmanage-ment.
Keywords
detection of an anomaly. We have been work-ing on R&D of a log collection/management system that consists of multiple, disparately located servers that feature log collection/man-agement and anomaly detection functions. Upon detection of an anomaly at one server, the other servers will search for and provide related information and log data[5]-[7].
In this paper, we will describe the concept of a log collection/management system that coordinates log collection/management servers. We will also describe a statistical method for detecting anomalies in collected logs, a fast pattern matching method using automatons, and a P2P (peer-to-peer) protocol for flexibly coordinating log collection/man-agement servers.
2 Studies on configuration
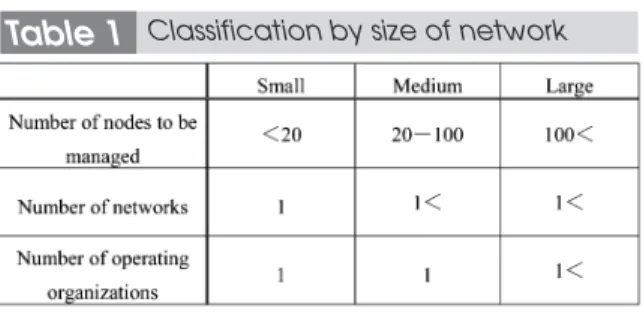
2.1 Size and configuration of networks
This log collection/management system is intended to adapt flexibly to a wide range of networks: from a small network featuring a single sub-network consisting of less than 20 nodes to a large network of sub-networks operated by different organizations. First, we focused on various network sizes and suitable configurations for each.
First, we classified computer networks based on the sizes shown in Table 1 and inves-tigated system configurations suitable for each environment.
A small computer network is a single net-work consisting of less than 20 nodes operated by a single organization. Since the amount of collected logs is small and log transmission traffic is low in such an environment, log col-lection and management is appropriately
con-ducted by one server.
A medium-sized computer network con-sists of several small sub-networks operated by a single organization. If a single server col-lects logs in such an environment, traffic will increase with increasing proximity to the serv-er, which may place considerable load on the network. Moreover, with an increase in the amount of logs concentrated in a single server, storage space and processing capacity may become insufficient. To prevent this and relat-ed problems, the log collection/management function should be distributed among the sub-networks, with central control of their opera-tions. In other words, a hierarchal system con-figuration is most appropriate for a medium-sized network.
A large computer network consists of sev-eral small or medium-sized sub-networks oper-ated by different organizations. In such an environment, each organization operating a sub-network must collect and manage logs on its own. The centrally controlled configuration used in a medium-sized network is not suitable for a large network. However, when an anom-aly occurs in a sub-network, the search for rel-evant information must extend to all sub-net-works, as all of these networks are linked. To meet these requirements, a multi-agent system configuration is required in which each log collection/management server collects logs from its own sub-network nodes, coordinating with the other servers as necessary.
Table 1 Classification by size of network
Fig.1 Suitable configuration based on network size
In short, log collection/management sys-tems must operate according to the network size and configuration. However, it is possible to implement the above-mentioned single-server and hierarchal system configurations as variations of the multi-agent system configu-ration shown in Fig.1.
Figure 1 (a) shows a multi-agent system configuration in which log collection/manage-ment servers coordinate at a single level. In Fig.1 (b), log servers are placed within a tree structure. In this way, a layered system configu-ration for a medium-sized computer network can be implemented as a variation of the multi-agent system configuration. As shown in Fig.1 (c), a single-server configuration can be imple-mented in the form of a sub-network that would constitute a part of the multi-agent system.
If log collection and management is con-ducted across several organizations in a large network environment, the functions of each log server must be adjusted according to its relationship with others. For example, a log server may provide all available log informa-tion to a node within the same organizainforma-tion, while limited to returning only information of presence or absence of the relevant logs to other organizations. In this case, the multi-agent system enables the establishment of policies governing responses to requests from individual log servers, without the need to adjust the network configuration. As a result, a log collection/management system can be designed more flexibly.
The conclusions described above show that, based on a multi-agent system that coor-dinates independent log collection/manage-ment servers, it is possible to construct a log collection/management system adaptable to networks of various sizes and configurations. These log servers can switch autonomously among policies—according to the internal or external nature of communications, for exam-ple. These servers can thus coordinate effec-tively regardless of the network configuration.
2.2 Log collection/management servers
We then proceeded to a study of servers
used for log collection and management. A log collection/management server must collect logs from various nodes such as appli-cation servers, routers, switching hubs, fire-walls, and IDSs. Formats of collected logs also vary: the “system logs (syslogs)” com-monly used by UNIX systems, the “Event Logs” used by WindowsNT, the “SNMP (Sim-ple Network Management Protocol)” often used by routers and switching hubs, and email used by IDSs to notify administrators. In addi-tion, some nodes need to employ original log formats. Obviously, a single log sever cannot handle all of these formats; the range of receivable log formats or protocols must be expandable. Two methods are available to extend this range: (1) definition of new log formats or protocols for log collection/man-agement, and installation of agents at the appropriate nodes to collect these logs; and (2) as necessary, enabling the specification of additional log formats or protocols receivable on the log collection/management server side. With method (1), it is possible to accommo-date new log formats or protocols by develop-ing agents at the new nodes required to collect these logs, eliminating the need to make changes to the rest of the network. However, in some cases it is not possible to install addi-tional programs (i.e., agents) on certain nodes. We thus decided to use method (2) to extend the range of collected log formats or proto-cols.
To help network administrators check and analyze logs, this log collection/management system must be able to check collected logs and detect anomalies automatically. Further, to collect and manage different log formats, this system needs be able to: (1) add checking functions according to log formats; and (2) check across logs and logs of multiple for-mats. We believe that function (1) will allow servers to provide flexible checking functions according to the managed log formats, and that function (2) will allow servers to detect anomalies more effectively by evaluating mul-tiple events—for example, by comparing the detection results collected from different
nodes through IDSs and those of syslogs from servers.
This system makes it possible to extend the range of receivable logs as necessary. However, since log checking functions are dependent on receivable log types, it is unlike-ly that previousunlike-ly implemented log checking functions can be used to check newly added log formats. Therefore, when extending the range of receivable logs, it is also necessary to extend the system’s log analysis functions.
As described above, log collection/man-agement servers must allow for the easy addi-tion or modificaaddi-tion of funcaddi-tions. To this end, we designed a group of functional modules that together make up a log collection/man-agement server. Figure 2 shows the layout of this structure.
As shown in Fig.2, a log collection/man-agement server consists of a number of func-tional modules. A strong dependent relation-ship between certain modules renders it diffi-cult to add, delete, or modify functions flexi-bly. To reduce dependency and to ensure ease of addition, deletion, and modification of functions, we divided the server into layers and set up a common interface between the layers.
We designed the server to consist of three layers: (1) an external interface section in charge of external communications, such as reception of logs from other nodes, coordina-tion among servers, and conversion of internal
and external data formats (for communication with other nodes); (2) an internal processing section in charge of analyzing received logs, checking relations among accumulated data items, and generating messages to initiate coor-dination upon detection of anomalies; and (3) a concealed database section that features a hid-den database for storing received logs and pro-vides a common interface to upper modules.
3 Proposed system
3.1 Log collection/management server
Figure 3 shows a specific configuration of a log collection/management server. We will use this figure to describe how the server works.
The three-layered rectangle in the center of the figure represents the log collection/management server. Outside this log server, there are nodes to be managed for log collection, other log servers for the exter-nal interface, and a user interface for server management. As described above, a log server consists of the external interface, internal pro-cessing, and database sections (layers). These sections (layers) include functional modules of the log server. Arrows in the figure indicate the flow of log data from reception to storage in the database (Logs), data related to check-ing and analysis within the server (Internal messages), and data related to coordination with other servers (Cooperation messages).
Fig.2 Conceptual Diagram of log collec-tion/management server configu-ration
Fig.3 Configuration of log
3.1.1 External interface section
The external interface section includes modules for reception of logs and coordina-tion with other log servers and user interfaces. Each log reception module receives logs in a specific format and converts the format for use inside the server.
The internal message reception and result notification modules control the flow of data between the external interface and internal processing sections. This helps ensure the independence of these two sections.
3.1.2 Internal processing section
Received logs are passed to anomaly check modules in the internal processing sec-tion. After checking is finished, these logs and the check results are entered in the database (indicated by arrows labeled “Logs”). It is possible to set up a separate module for each log type. It is also possible to associate a log type with two or more detection methods. In this case, several types of check results are linked to a given log.
The anomaly check modules check received logs for anomalies before the logs are stored in the database. In addition, the relevant anomaly check module checks logs that were received at different times or from different nodes (indicated by arrows labeled “Internal messages”). These check results are monitored by the relevant modules. To check more extensively, requests for the relevant informa-tion are sent to the other log servers as neces-sary (indicated by arrows labeled “Coopera-tion messages”).
3.1.3 Database section
The bottom layer of log collection/man-agement is formed by a database that stores received logs and check results. To ensure that the database is scalable, between the internal processing section and database, we installed a DB management module that hides the data-base system and provides a common interface with the internal processing section.
3.2 Coordination functions
This is a multi-agent distributed system in which log collection/management servers act
as agents. The system is designed to coordi-nate computer networks operated by different organizations. We devised a P2P-based coor-dination scheme because a P2P network enables easy installation of agents, regardless of the overall network structure.
In this scheme, log collection/management servers operate as follows. First, each log col-lection/management server selects several neighboring log servers and establishes com-munications. When a log collection/manage-ment server detects an anomaly through its col-lection and analysis of logs, it will issue notifi-cation and a request for the relevant informa-tion to the neighboring log collecinforma-tion/manage- collection/manage-ment servers in a peer-to-peer fashion. Upon reception of this message, the other log servers will check their stored logs, and any log data judged as related to the anomaly will be returned to the source (server). In addition, the servers will forward this message to all neigh-boring log collection/management servers except the log collection/management server that issued this message. This procedure is repeated to check logs throughout the network, as shown in Fig.4.
In the figure, for example, LS1 cates with LS2 and LS3, and LS2 communi-cates with LS1, LS21, and LS22. When LS1 sends a message to LS2, LS2 will forward this message to LS21 and LS22. In this way, LS1 can coordinate with LS21, LS22, and the other log servers with which LS1 does not have direct communication.
However, in a loop structure in which
Fig.4 Coordination of log
neighboring log servers communicate with one another, message transmission overlaps, generating unnecessary traffic. In the case shown in Fig.4, for example, when LS21 and LS22 receive a message from LS1, each will send this message to the other. Gnutella[8], a
typical P2P protocol, prevents an increase in traffic to a certain extent by discarding over-lapping messages, but traffic still increases in proportion to the square of the number of nodes involved, placing pressure on the net-work bandwidth. Chord protocol[9], which
employs P2P in distributed databases, pre-vents an increase in traffic by adjusting data locations and search procedures using the flexibility of the P2P network. However, this system requires a protocol that can broadcast messages (like Gnutella) throughout the tem, as log locations are unknown in this sys-tem. Moreover, since Chord does not take bandwidth or route status into consideration, low-speed routes may be selected to send a given message. To coordinate among log col-lection/management servers, we devised a P2P protocol that is able to optimize communica-tion routes among neighboring nodes. Fig.5 shows the route control method using the P2P protocol we have devised.
In Fig.5, a node A communicates with neighboring nodes B and C; and B and C com-municate with neighboring node D [Fig.5 (a)]. When A sends a message, D will receive this message from both B and C. In the Gnutella protocol, node D will discard one of the mes-sages received from B and C, as described above. However, the generation and transmis-sion of such overlapping messages is simply unnecessary. According to our routing
method, if a node receives the same request message several times, this node will send a transmission stop request (OBSOLETE) to nodes sending the second or later transmission of this request message. Nodes that receive the OBSOLETE command will stop sending mes-sages to the requesting node. For example, when D receives the same request message from B and C, D will send the OBSOLETE command to the node (C in this example) that sent the message later [Fig.5 (b)]. After receiving the OBSOLETE command, C will stop forwarding request messages from A to D [Fig.5 (c)]. This method prevents subsequent request message transmissions from causing unnecessary traffic. Before the OBSOLETE command is sent, a given message transmis-sion results in O(n2) of traffic, as in the
Gnutella protocol. After the OBSOLETE command is sent, traffic caused by a given transmission will decrease to O(n).
A disadvantage to this method is seen in that transmissions may be interrupted when trouble occurs on a node that forwards mes-sages, as shown in Fig.6.
If trouble occurs at B after the route is established as shown in the previous figure, messages will not be sent to D. The detected trouble of the destination node can be solved by rerouting messages regardless of the earlier OBSOLETE command. When attempting to establish a connection with B, if A finds that B is unable to forward messages, then A will send an OBSOLETE cancel request and other messages (not having been forwarded by B) to C so that C can forward the messages to D.
The new protocol described above pre-vents the increase in traffic caused by
conven-Fig.5 Routing method
tional P2P protocols such as Gnutella. This enables all servers in this log collection/man-agement system to exchange information and receive results using the flexibility of the P2P network—in other words, it enables optimiza-tion of communicaoptimiza-tion routes.
4 Log checking functions
This system is designed to conduct anom-aly detection at each of its log collection/man-agement servers. This system allows for the use of existing methods, such as detection by pattern matching, and detection based on traf-fic patterns collected through SNMP.
Aside from these methods, we devised a classification method based on the frequency of occurrence of words within logs and a high-speed pattern matching method using automatons. This section will describe these methods.
4.1 Classification based on the fre-quency of occurrence of words
This method involves sampling known logs and classifying them into certain cate-gories, creating an “occurrence frequency matrix” that shows which words occur at what frequencies in each log category. This matrix can be used as a set of decision functions to classify newly received logs.
This method enables the creation of decision functions tailored to individual environments based on past data. This method thus offers a number of advantages over pattern matching: (1) the ability to detect anomalies when a log server receives unknown logs; and (2) the abili-ty to create decision functions suited to individ-ual environments based on sampled logs.
4.1.1 Creation of decision functions
An occurrence frequency matrix consists of words (in rows) and categories (in columns), and each element shows the fre-quency of occurrence of a word in each cate-gory. A matrix that corresponds to a group of words is called a corpus. Figure 7 shows the layout of a corpus.
To create a corpus and decision functions,
the following steps are performed on the user side: (1) collection and classification of logs for use as original data; (2) morphological analysis of the classified log messages to extract words; (3) elimination of white spaces, punctuation marks, and character strings that consist only of numbers; (4) if a word extract-ed in Step (2) is new, an additional row is cre-ated to hold this word, and the total for the number of words (rows) is augmented by one. If an extracted word is an existing one, the existing category value is increased by one; (5) the single value indicated in each of the columns created in Step (4) is divided by the number of logs included in that category; and (6) each element (from the results of Step (5) is divided by the total for all elements in that row.
The resultant matrix is used as a set of decision functions.
4.1.2 Classifying logs
To classify a log, the user performs the fol-lowing steps: (1) checks whether a word con-tained in the corpus occurs in the log—if it does, “1” is written to the location in the cor-pus corresponding to this word; if not, “0” is entered; (2) repeating Step 1, vectors of ones and zeros are created that correspond to the occurrence or non-occurrence of the words; (3) these vectors are multiplied by the decision function vectors; and (4) the element with the largest vector value as a result of the
tion in Step 3 is then selected. The number assigned to this element will correspond to the number of the category to which this log belongs.
4.2 Pattern matching by automatons
We devised this method to speed up anom-aly detection based on log occurrence patterns. Through parallel operation of several automatons linked without interruption and based on the relationships among multiple logs, we tried to reduce the number of anom-aly detection checks, and also, to verify sever-al patterns to increase detection speed.
4.2.1 Configuration and operation of automatons
As shown in Fig.8, an automaton consists of several nodes, each representing specific states. Each node has regularly expressed con-ditions for a shift to the next state. A log col-lection/management server passes received logs sequentially to automatons for verifica-tion.
An automaton checks logs as follows: (1) When receiving a log, the automaton will check whether the log fulfills the conditions for a shift to the next state. (2) If it does, the automaton will shift to the next state. (3) A shift to the final state means that an anomaly has been detected. In this case, the automaton will record the related log data and then return to its initial state. Logs are checked sequen-tially through repetition of these steps.
It is sometimes appropriate to presume that logs widely separated in time are not related. Therefore, we specified a time period after which logs are discarded. After this peri-od has elapsed, the automaton returns to its initial state.
4.2.2 Parallel operation of automatons
The user prepares the necessary number of automatons according to the desired patterns to check; these automatons then operate in parallel.
Figure 9 shows the concept of automatons operating in parallel. This group of automatons operates as follows: (1) A log col-lection/management server passes a received log to the first automaton [Automaton (0) in Fig.9]. (2) This automaton checks the log, shifts its state accordingly, and sends the log to the next automaton. (3) For each log, Step 2 is performed by all automatons. (4) Each time a new log is received, Steps 1 through 3 are triggered.
These automatons are series-linked and every automaton is always in one of the desig-nated states. Therefore, the amount of time required to check a log depends only on the number of automatons. Since these series-linked automatons operate in parallel, it is possible to handle as many logs as the number of automatons when logs are received in suc-cession.
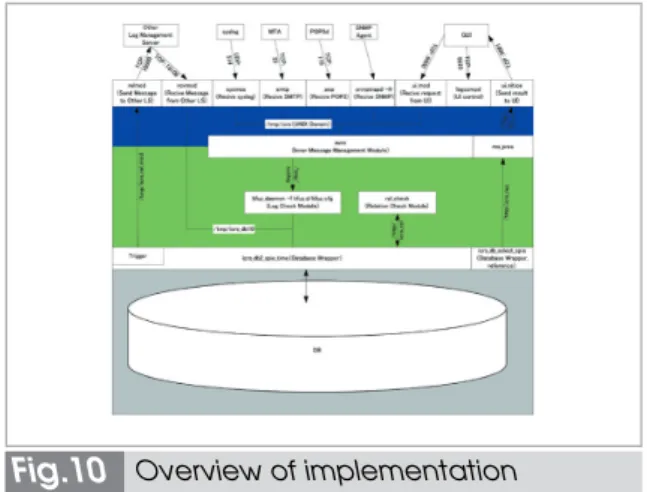
5 Implementation
Based on the concept described so far, we are in the process of prototyping a log collec-tion/management system. Figure 10 shows the functions we have already implemented on a
module-by-module basis.
This prototype uses its reception modules (for syslog, SNMP, SMTP, and POP3) to receive syslog, SNMP, and mail logs, and runs anomaly detection routines for an each log before storing these logs in its database. At present, the prototype features only one detec-tion routine based on the frequency of occur-rence of words, as described above. However, the superordinate internal message reception module allows the user to specify the modules to be used next. In the future, it will be possi-ble to tailor anomaly detection routines even more precisely by selecting the optimal mod-ule, according to the type of log received.
Upon reception of a log, the relation check module conducts anomaly detection based on the reception state of several logs. In this anomaly detection, automatons perform the pattern matching described above.
If a log collection/management server detects an anomaly through any of its detec-tion funcdetec-tions, the coordinadetec-tion trigger module located in the database wrapper will decide, based on the settings, whether or not to start coordination. If this module decides to start coordination, it sends a coordination message to the other log servers. Upon reception of this message, the other log servers will check their own databases, and if they find related log information, they will send it back to the serv-er in which the anomaly was detected. In addi-tion, they will forward this message to all neighboring log servers except the log server
that issued this message. In this way, network-wide coordination is achieved through the pro-tocol described in 3.2, “Coordination func-tions”.
6 Results and discussion
We checked the operation and evaluated the performance of the implemented func-tions. This section will briefly describe our test results.
We measured traffic when the new P2P protocol was employed, and compared this protocol with Gnutella based on the following prediction: before the OBSOLETE command is sent, message transmission will cause O(n2)
of traffic (as in the case of Gnutella); after the OBSOLETE command is sent, traffic will decrease to O(n), as the transmission route will then feature a theoretical tree structure.
Figure 11 shows the results of traffic mea-surement. As we predicted, prior to route con-trol message transmission results in nearly the same volume of traffic as with Gnutella. After the OBSOLETE command is sent, traffic sim-ply increases in proportion to the number of nodes.
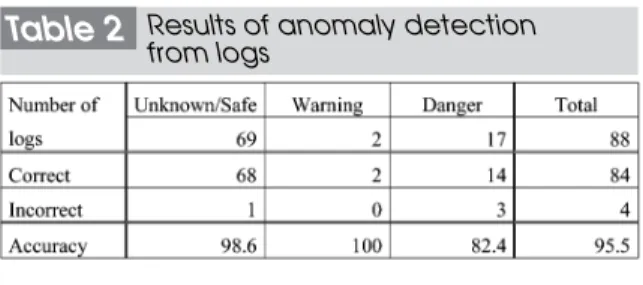
We evaluated the accuracy of anomaly detection using the classification method based on the frequency of occurrence of words. We used the “Nessus”[10]simulated
attack tool to attack a Linux server, and classi-fied collected syslogs into three risk categories to create a corpus. We then used this corpus to
Fig.10 Overview of implementation
check logs (syslogs) for another attack by Nessus. As shown in Table 2, this method was able to classify logs with 95.5% accuracy.
For comparison purposes, we conducted the same experiment on a Bayesian filter[11],
which executes a similar statistics-based algo-rithm. A Bayesian filter is often used against so-called “spam” email. Since this filter can extract a small number of words from logs, we used trigrams instead of words. As a result, this filter was able to classify logs with 96.63% accuracy. The main reason for this increase in accuracy is that a trigram corre-sponds to several typical words (four charac-ters or longer) within the corpus. Also, the fil-ter selected the 15 most typical trigrams in the experiment; this helped eliminate intermediate values likely to cause noise.
In the category “Danger”, we found three logs that should have been classified as “Unknown”. All of these logs contained the string “rpc”. The corpus also contained this string, whose value was used to indicate dan-ger. These results show that when we attempt to detect anomalies based on words and few words are used to indicate danger, logs will likely be judged as anomalous based only on the presence of one of these words.
We compared the results between the Bayesian filter and our classification method based on the frequency of occurrence of words. Accordingly, we concluded that it is possible to improve the accuracy of our method by using the most typical trigrams in each category, as in the case of the Bayesian filter.
7 Conclusions
As described in this paper, we devised a system that can centralize log management through coordinated operation of log collec-tion/management servers. We also developed the necessary coordination functions and a prototype of a log collection/management server that allows functions to be easily added or modified. Based on the results of functional verification of this prototype, we believe that this system will work effectively.
Essentially, this system consists of equiva-lent log collection/management servers, although performance will vary depending on the size of the organization or network in which the server is installed. However, when setting up a system across several organiza-tions, it must be possible to vary the degree of coordination among the organizations accord-ing to their respective relationships. To this end, we are also studying a mechanism to vary the degree of coordination according to the communicating parties and whether communi-cations are internal or external, through inter-organizational gateways that can restrict responses according to destination.
As we modify and improve this prototype, we will check the various individual functions and improve the performance to demonstrate that this system will work effectively in actual environments.
Acknowledgements
This research was carried out based on the “Research and Development on Security of Large-Scale Networks” project commissioned by the National Institute of Information and Communications Technology. We would like to express our gratitude to NICT for its guid-ance and support.
Table 2 Results of anomaly detection from logs
Reference
01 http://www.npa.go.jp/cyber/toukei/html/html18.htm
02 http://www.dmtf.org/standards/wbem
03 Distributed Management Task Force, Inc., “Common Information Model (CIM) Specification”, http://www.dmtf.org/standards/cim/cim_spec_v22, Jun. 2004.
04 IBM Corp., “Tivoli Management Framework Planning for Deployment Guide Version 4.1.1”
05 Fukuda Naohiro., et al., “DAIKIBO NETTOWAKU SEKYURIT’I KAKUHO NI MUKETA KENKYU KAIHAT-SU”, JNSA Network Security Forum 2003 (NSF2003), Oct. 2003.(in Japanese)
06 Ishida Tsunetake., Kamio Masakazu., Hakoda Takahisa., Katsuji Tsukamoto., and Hiroshi Shimizu., “Peer-to-Peer Routing Protocol for Reducing Network Traffic”, 2004 IECE General Conference, No.B-16-20, p.629, Mar. 2004.
07 Masakazu Kamio., and Tsunetake Ishida.,“Unified Log Management and Abnormal Log Detection Sys-tem”, IPSJ SIG Tecnical Reports, Dec. 2004.
08 http://www.jnutella.org/docs/gnutellang/gnutella_protocolv4.shtml
09 L. Stoica, et al., “Chord : A Scalable Peer-to-peer Lookup Service for Internet Applications”, http://pdos.lcs.mit.edu/chord/
10 http://www.nessus.org
11 Graham, Paul., “Better Baysian Filtering”, http://www.paulgraham.com/better.html, Jan. 2003.
KAMIO Masakazu
Corporation Product Division, Product Development Department, YASKAWA INFORMATION SYSTEMS Corpora-tion
Computer Security, Multi-Agent System
HAKODA Takahisa
Manager, Corporation Product Divi-sion, Product Development Depart-ment, YASKAWA INFORMATION SYSTEMS Corporation
Networks Security
ISHIDA Tsunetake
Corporation Product Division, Product Development Department, YASKAWA INFORMATION SYSTEMS Corpora-tion
![Figure 9 shows the concept of automatons operating in parallel. This group of automatons operates as follows: (1) A log col-lection/management server passes a received log to the first automaton [Automaton (0) in Fig.9]](https://thumb-us.123doks.com/thumbv2/123dok_us/23182.3003544/8.892.446.766.450.716/automatons-operating-parallel-automatons-operates-management-automaton-automaton.webp)