MICROBIOLOGY ANDMOLECULARBIOLOGYREVIEWS,
1092-2172/98/$04.0010 Dec. 1998, p. 1435–1491 Vol. 62, No. 4
Copyright © 1998, American Society for Microbiology. All Rights Reserved.
Protein Phylogenies and Signature Sequences: A Reappraisal
of Evolutionary Relationships among Archaebacteria,
Eubacteria, and Eukaryotes
RADHEY S. GUPTA*Department of Biochemistry, McMaster University, Hamilton, Ontario L8N 3Z5, Canada
PREFACE ...1435
CURRENT EVOLUTIONARY PERSPECTIVE ...1436
MOLECULAR PHYLOGENIES: ASSUMPTIONS, LIMITATIONS, AND PITFALLS ...1438
SEQUENCE SIGNATURES AND THEIR IMPORTANCE IN EVOLUTIONARY STUDIES...1442
ROOT OF THE PROKARYOTIC TREE: ANCESTRAL NATURE OF ARCHAEBACTERIA AND GRAM-POSITIVE BACTERIA ...1444
EVOLUTIONARY RELATIONSHIPS AMONG PROKARYOTES ...1446
Signature Sequences Showing the Distinctness of Archaebacteria ...1447
Signature Sequences Distinguishing Archaebacteria and Gram-Positive Bacteria from Gram-Negative Bacteria ...1449
A Specific Relationship between Archaebacteria and Gram-Positive Bacteria and the Distinctness of Gram-Negative Bacteria Is Consistent with Prokaryotic Cell Structures and Other Gene Phylogenies ...1450
Signature Sequence Distinguishing between Low-G1C and High-G1C Gram-Positive Bacteria and Pointing to a Specific Relationship of the Latter Group to the Gram-Negative Bacteria ...1455
Signature Sequences Indicating that Deinococcus and Thermus Are Intermediates in the Transition from Gram-Positive to Gram-Negative Bacteria ...1456
Phylogenetic Placement of Cyanobacteria and Their Close Evolutionary Relationship to the Deinococcus-Thermus Group ...1458
Signature Sequences Defining Proteobacteria and Some of Their Subdivisions...1461
Nature of the Archaebacterial Group and Its Relationship to Gram-Positive Bacteria ...1461
Possible Selective Forces Leading to Horizontal Gene Transfers ...1465
Evolutionary Relationships within Prokaryotes: an Integrated View Based on Molecular and Phenotypic Characteristics ...1470
EVOLUTIONARY RELATIONSHIP BETWEEN EUKARYOTES AND PROKARYOTES...1473
Some Critical Assumptions in Studying Prokaryote-Eukaryote Relationships ...1473
Most Genes for the Information Transfer Processes Are Derived from Archaebacteria ...1473
Hsp70 Provides the Clearest Example of the Contribution of Eubacteria to the Nuclear-Cytosolic Genome...1474
The Eukaryotic Nuclear Genome Is a Chimera of Genes Derived from Archaebacteria and Gram-Negative Bacteria...1475
Origin of the Nucleus and Endoplasmic Reticulum ...1477
Did Mitochondria and the First Eukaryotic Cell Originate from the Same Fusion Event? ...1481
CONCLUDING REMARKS...1485
ACKNOWLEDGMENTS ...1487
REFERENCES ...1487
“The credible is, by definition, what is believed already, and there is no adventure of the mind there.”
Northrop Frye (74)
PREFACE
The recognition of archaebacteria as distinct life forms by Woese and coworkers in 1977 (256) has been hailed as one of the most significant developments in the history of microbiol-ogy and has profoundly influenced thoughts on the evolution-ary relationships among living organisms. The discovery of this “third form of life” has led to the notion that prokaryotic cells
are of two fundamentally different kinds, archaebacteria and eubacteria, and that of these, the archaebacteria are the closest relatives and direct ancestors of eukaryotic cells (Fig. 1a). The discovery of archaebacteria was initially based mainly on the 16S rRNA (oligonucleotide) sequences and phylogeny. How-ever, during the past 10 years, much new information on dif-ferent gene sequences, including the entire genomes of several prokaryotic and eukaryotic species, has accumulated (15, 26, 45, 66, 72, 73, 80, 119, 128, 138, 147, 215, 242). Based on these data, it is now possible to critically evaluate whether the three-domain proposal provides an accurate picture of the evolution-ary relationship among living organisms or if a different type of relationship is warranted. The results of studies reviewed here indeed point to a very different evolutionary picture from the currently widely accepted one. In this review I present evidence based on molecular sequences that archaebacteria exhibit a * Mailing address: Department of Biochemistry, McMaster
Univer-sity, Hamilton, Ontario, Canada L8N 3Z5. Phone: (905) 525-9140 ext. 22639. Fax: (905) 522-9033. E-mail: gupta@fhs.csu.McMaster.CA.
close and specific relationship to gram-positive bacteria and that the primary division within prokaryotes is not between archaebacteria and eubacteria but, rather, between organisms that have either a monoderm cell structure (i.e., prokaryotic cells surrounded by a single membrane, which includes all archaebacteria and gram-positive bacteria) or a diderm cell structure (i.e., prokaryotic cells surrounded by an inner cyto-plasmic membrane and an outer membrane, which includes all true gram-negative bacteria) (Fig. 1b) (100). The sequence data also strongly indicate that the ancestral eukaryotic cell is not a direct descendant of the archaebacterial lineage but is a chimera that resulted from a unique fusion event involving two very different groups of prokaryotes—a thermoacidophillic ar-chaebacterium (monoderm) and a gram-negative eubacterium (diderm), followed by integration of their genomes. Thus, all eukaryotic organisms, including the amitochondriate and aplastidic cells, received and retained gene contributions from both lineages.
CURRENT EVOLUTIONARY PERSPECTIVE
The quest for an understanding of the evolutionary relation-ships between extant organisms has posed a major challenge to biologists for centuries (23, 43, 159, 167). Since all living or-ganisms are specifically related to each other by the presence of numerous common (or related) biomolecules and follow a similar complex strategy for growth and propagation, there is now little doubt that they all evolved from a common (univer-sal) ancestor (3, 228). However, discerning how different major groups of organisms are related to each other and tracing their evolution from the common ancestor remains controversial and unresolved. After the invention of the microscope in the 17th century, studies on the morphological characteristics of cells from extant organisms led to the identification of two
distinct types of cells (3), later termed prokaryotes and eu-karyotes (34, 173), which could be readily distinguished. The eukaryotic cells are distinguished from prokaryotes by a num-ber of different characteristics including the presence of a cytoskeleton, endomembrane system, etc. (3, 159). However, the hallmark feature of all eukaryotic cells is the presence of a membrane-bounded nucleus, and any organism lacking a nu-clear membrane is considered a prokaryote (4, 34, 173). Eu-karyotic organisms were classified into a number of different groups or kingdoms, namely, Animalia, Plantae, Fungi, and Protoctista, based on their detailed and complex morphologies and with the aid of fossil records (164, 248). However, a similar Linnaean approach to classification based on cell shape, phys-iology, and other characteristics was unsuccessful in detecting the phylogeny of prokaryotic organisms (23, 24, 121, 140, 194, 195, 227, 228, 230, 245, 250, 252, 254). The problem was partly due to their very simple morphologies but was also due in large part to the difficulty in determining which of the cellular fea-tures and characteristics of prokaryotes is most meaningful for taxonomic purposes.
Despite the ill-defined state of bacterial taxonomy, one em-pirical criterion that has proven of much practical value in the classification/identification of prokaryotes is their response to the Gram stain (121), discovered by Christian Gram in 1884 (88). As has been noted by Murray, “Gram-positiveness and Gram-negativeness are still unassailable characters except in Archaebacteria, the radiation-resistant cocci and . . . the wall-less mollicutes” (175). Gram staining involves successive treat-ment of cells with the basic dye crystal violet followed by treatment with iodine solution and then extraction with a polar organic solvent such as alcohol or acetone. The cells which resist decolorization and retain the blue-black dye complex are referred to as gram positive, whereas those which do not retain the stain are classified as Gram negative (12, 13, 88, 121). The FIG. 1. Evolutionary relationships among living organisms in the three-domain model of Woese et al. (258) (a) and as suggested here based on protein sequence data and structural characteristics of organisms (b). In panel b, the solid arrows identify taxa that evolved from each other in the directions shown by accumulation of mutations and the dotted lines denote symbiotic events that led to the acquisition of mitochondria and plastids. These latter events, which are common in both models, are not shown in panel a. In panel b, the double-headed arrow between archaebacteria and gram-positive bacteria indicates the polyphyletic relationship between these groups for several genes. The terms “monoderm” and “diderm” refer to prokaryotic cells that are bounded by only one membrane or two different (cytoplasmic and outer) membranes, respectively. The dashed lines indicate the first fusion between an archaebacterium and a gram-negative bacterium that is postulated to have given rise to the ancestral eukaryotic cell (102, 105). Abbreviations: CM, cytoplasmic membrane; CW, cell wall; OM, outer membrane, PE, periplasm.
Gram-staining response, although not always reliable due to its dependence on cell physiology and cell integrity (11, 228), thus divides prokaryotes into two main groups, the gram-positive and the gram-negative (121, 228). Although the Gram reaction is an empirical criterion, its basis lies in the marked differences in the ultrastructure and chemical composition of the cell wall (14, 192, 228, 229, 235). The Gram-positive bacteria in general contain a thick cell wall (20 to 80 nm) that is very rich in cross-linked peptidoglycan (accounting for between 40 and 90% of the dry weight) and also containing teichoic acids, teichuronic acid, and polysaccharides (6, 14, 192, 229). Because of their rigid cell walls, these bacteria have been named Fir-micutes in Bergey’s Manual of Systematic Bacteriology (174); a number of other bacteria which possess the above structural characteristics but may show gram-variable (or gram-negative) staining are also placed in the same group. In contrast, all “true” gram-negative bacteria, named Gracilicutes in Bergey’s Manual (174), have only a thin layer of peptidoglycan (2 to 3 nm) and have, in addition to the cytoplasmic membrane, an outer membrane containing lipopolysaccharides, which lies outside of the peptidoglycan layer. As noted by Tru¨per and Schleifer (244) “A clear separation of the Gram-positive and Gram-negative bacteria can be obtained by the differences in the ultrastructure and chemical composition of the cell wall”. In the present work, I have used the term “gram negative bacteria” to describe prokaryotes whose envelopes contain a cytoplasmic membrane, a murine cell wall, and an outer mem-brane rather than by their Gram-staining response.
Based on the nature of the bounding layer of the cells, which is reflected in the Gram-staining reaction, a major microbiol-ogy textbook (228) suggested the division of prokaryotes into three main groups: “The Mycoplasma which do not synthesize a cell wall, the membrane serving as the outer bounding layer; the Gram-positive bacteria, which synthesize a monolayered cell wall; and the Gram-negative bacteria, which synthesize a cell wall composed of at least two structurally distinct layers.” Although they could not know the extent of the problem, many earlier bacteriologists recognized the importance of cell struc-ture and the bounding layer in the classification of prokaryotes: “It is self evident that the shape of the cell is of outstanding importance for determining the place of bacterium in any phylogenetic system” (140). However, as noted in a leading textbook, distinguishing between cells containing different types of envelopes was not an easy task (228): “The Gram-staining procedure is not always a wholly reliable method (and) the differentiation of these two subgroups (i.e., Gram-positive and Gram-negative) by other and more reliable methods is not easy; it requires either electron microscopic examination of wall structure in thin sections of the cells or chemical detection of the group specific polymers.” In view of these difficulties, the results obtained were often difficult to integrate into a coherent scheme (24, 121, 174, 194, 195, 227, 228, 230, 245).
By the late 1950s and early 1960s, when microbiologists were feeling increasingly frustrated in their attempts to understand the natural relationship among prokaryotes, the era of molec-ular biology dawned. With this came the important realization, spelled out clearly by Zuckerkandl and Pauling (264), that the linear sequences of bases and amino acids in nucleic acids and proteins are informative documents containing a record of organismal evolutionary history from the very beginning and that in this regard the prokaryotic organisms are just as plex and informative as any eukaryote (65, 264). Thus, a com-parison of sequences of the same gene or protein from various species could be used to deduce and reconstruct the evolution-ary history of organisms. This marked the beginning of the field of molecular evolution. The rationale for using molecular
se-quence data to deduce the evolutionary relationship between organisms is described in a number of excellent reviews (58, 60, 61, 64, 65, 178, 236) and is not covered here except for certain relevant points.
The initial molecular approaches based on DNA base com-position, nucleic acid hybridization, and immunological cross-reactivities were of limited use and were generally successful in establishing or rejecting relationships only among bacteria that were thought to be closely related species (224, 226, 228). The full impact of the molecular approach on evolutionary biology did not become evident until Woese and coworkers (71, 250, 256) had completed systematic studies of a significant number of living organisms based on the small-subunit rRNA se-quences (SSU or 16S rRNA). The earlier studies in this regard were based on comparison of the oligonucleotide catalogs of the 16S rRNA, but these were later supplanted by phylogenetic analysis based on complete sequences of the molecules. These studies revealed that, based on genetic distances and signature sequences in the 16S rRNA, various prokaryotic and eukary-otic organisms fell into three distinct groups (71, 250, 256). One group consisted of all eukaryotic organisms, the second consisted of all commonly known bacteria (the term “eubac-teria” was suggested for this group) including various genera of gram-positive and gram-negative bacteria and cyanobacteria, and the third group consisted of a number of previously little-studied prokaryotes (methanogens, extreme thermoacidophiles, and extreme halophiles) which grow in unusual habitats. Because of their assumed antiquity, this last group of prokaryotes was named “archaebacteria” (256).
In terms of their genetic distances (or similarity coefficients from oligonucleotide catalogs) based on rRNA, the archaebac-teria were no more closely related to the eubacarchaebac-teria than to the eukaryotes. This observation, in conjunction with a number of unique characteristics of archaebacteria (e.g., lack of muramic acid in cell walls [127)] membrane lipids that contain ether-linked isoprenoid side chains [127, 133)], distinctive RNA poly-merase subunits structures [263], and lack of ribothymine in the TCC loop of tRNA), led Woese and collaborators to propose that the archaebacteria were totally distinct from other bacteria and constituted one of the three aboriginal lines of descent from the universal ancestor (71, 250, 256). The prokaryotes thus consisted of two distinct and non-overlapping (i.e., monophyletic) groups: eubacteria and archaebacteria, which were no more specifically related to each other than either was to the eukaryotes (250, 256). Since microbiology at the time was lacking any formal basis for phylogeny, this pro-posal, based on more defined and quantitative molecular char-acteristics, was generally favorably received, and within a de-cade most microbiology textbooks took notice of or were revised in the light of these new findings (6, 8, 14, 121, 192, 229).
The archaebacterial proposal received a major boost in 1989 when the phylogenies based on a number of protein sequences were added to the analysis, including those for the protein synthesis elongation factors EF-1a/Tu and EF-2/G, RNA poly-merase subunits II and III, and F- and V-type ATPases (82, 126, 196). These studies again supported the distinctness of archaebacteria from eubacteria. Further, in contrast to the rRNA phylogeny, where only an unrooted tree was possible for archaebacteria, eubacteria, and eukaryotes, for the paralogous pairs of protein sequences (namely, ETu and EG; and F-and V-ATPases) which appeared to be the results of ancient gene duplication events in the common ancestor of all extant life, it was possible to root the universal tree by using one set of genes as an outgroup for the other (82, 126). These studies indicated that the root of the universal tree lay between
chaebacteria and eubacteria, and in both cases the eukaryotes were indicated as specific relatives of archaebacteria (82, 126). In 1990, Woese et al. (258) adopted this rooting, and a formal three-domain proposal for the classification of organisms was put forward. The proposal assigned each of the three groups, archaebacteria, eubacteria, and eukaryotes, a Domain status (a new highest taxonomic level) and renamed them Archaea, Bac-teria, and Eucarya. The name Archaea was specifically pro-posed to indicate that this group of prokaryotes bear no spe-cific relationship to the other prokaryotes (i.e., Bacteria or eubacteria) (258). This rooted version of the universal tree (Fig. 1a), commonly referred to as the archaebacterial or three-domain tree, is now widely accepted as the current par-adigm in the field (54, 91, 171, 187, 258).
But does this tree or view represent the true relationship between the organisms? In recent years, much new informa-tion based on a large number of gene and protein sequences, including the complete genomes of several prokaryotic and eukaryotic organisms, has become available (26, 45, 66, 72, 73, 80, 119, 128, 138, 147, 215, 242). Based on this information, it is now possible to critically evaluate the three-domain proposal and its various predictions and to determine if this view is supported by all data or is true only for a subset of gene and protein sequences. These studies should also indicate whether a different sort of relationship between the organisms is more consistent with most of the available data. Since most biologists are not familiar with the assumptions and pitfalls of phyloge-netic analyses, I will try to point out the strengths as well the subjective and weak aspects of such analyses so that the read-ers can undread-erstand and evaluate the results which form the bases for any classification.
MOLECULAR PHYLOGENIES: ASSUMPTIONS, LIMITATIONS, AND PITFALLS
The use of molecular sequences for phylogenetic studies is based on the assumption that changes in gene sequences occur randomly and in a time-dependent manner and that a certain proportion of these become fixed in the molecules (58, 65, 136, 178, 236). The accumulation of changes in gene sequences in a quasi clock-like manner has given rise to the concept of “evo-lutionary clock” or molecular chronometer (136). Following the clock analogy (252), just as different hands or features (e.g., the month, day, minute, and second) in a clock move at very different rates, the changes in different gene sequences (or sometimes within different parts of the same gene) also occur at vastly different rates. Thus, some sequences which change very slowly (like the year, month, or day) are well suited for monitoring ancient events, while others, with a higher rate of change (like the hour, minute, or second), provide the sensi-tivity and resolution to measure relatively recent occurrences. Since the evolutionary history of life on this planet spans a vast period (approximately 3.8 Ga, 109years), different sequences
have different utilities in evolutionary studies. In the present context, where our main focus is on examining very ancient evolutionary events (e.g., relationships within the higher
pro-karyotic taxa and the origin of eupro-karyotic cells), the sequences which change very slowly and hence show a high degree of conservation in all extant organisms (i.e., the best-preserved molecular fossils) are most useful.
Phylogenetic analysis can be carried out based on either nucleic acid or protein sequences. For noncoding sequences such as various rRNAs, tRNAs, and introns, phylogenetic anal-ysis can be carried out based on only the nucleotide sequence data. However, for gene sequences that encode proteins, anal-yses can be performed based on either the nucleic acid or the amino acid sequence data. For proteins, the two kinds of anal-yses appear analogous at first. In fact, the analysis based on nucleic acid sequences, with three times as many characters, would seem to be more informative (181, 250). While this is true in principle, for phylogenetic analyses involving distantly related taxa the increased information content in nucleic acid sequences as opposed to protein sequences is merely an illu-sion and in most cases is a major liability. The main reason for this lies in the degeneracy of the genetic code. All but two amino acids (Met and Trp) are encoded by at least two codons which differ in the third position. In view of this degeneracy, most changes in the third codon positions are selectively neu-tral (i.e., they do not result in any change in the protein se-quence) and, as a consequence, change frequently even in closely related species (58, 60, 136). In distantly related taxa, which diverged from each other a long time ago, the bases at the third codon positions may have changed so many times that the actual bases found at these positions are random in nature and their information content is virtually nil. The inclusion of such bases in the analyses, therefore, would lead to uncertainty at every third position, thereby reducing the signal (i.e., tions which are evolutionary important)-to-noise (i.e., posi-tions or changes which provide no evolutionary information) ratio in the data set.
Another important factor affecting the usefulness of nucleic acid sequences compared to protein sequences relates to the differences in the genomic G1C content of species (113, 231). The G1C content of different species is known to differ greatly (this is often true for two species within the same genus as well), and it is generally homogenized over the entire genome. In the protein-coding sequences, these differences in the G1C contents are accommodated by selective changes (i.e., codon preferences) in the third codon positions. The species which are rich in G1C show a strong preference for codons that have G or C in the third position (often .90%), whereas species with low G1C content predominantly utilize the codons with A or T in these positions. Thus, two unrelated species with similar G1C contents (e.g., either very high or very low) may have very similar bases in the third codon positions. If phylo-genetic analysis is carried out based on nucleic acid sequences, these species may show a strong affinity for each other but for the wrong reason (113, 231). Thus, the third codon positions, rather than being informative, can introduce major bias into the analyses. For a similar reason but to a lesser extent, the bases in the first codon positions are also evolutionarily less informative and can cause reduced signal-to-noise ratio. Thus,
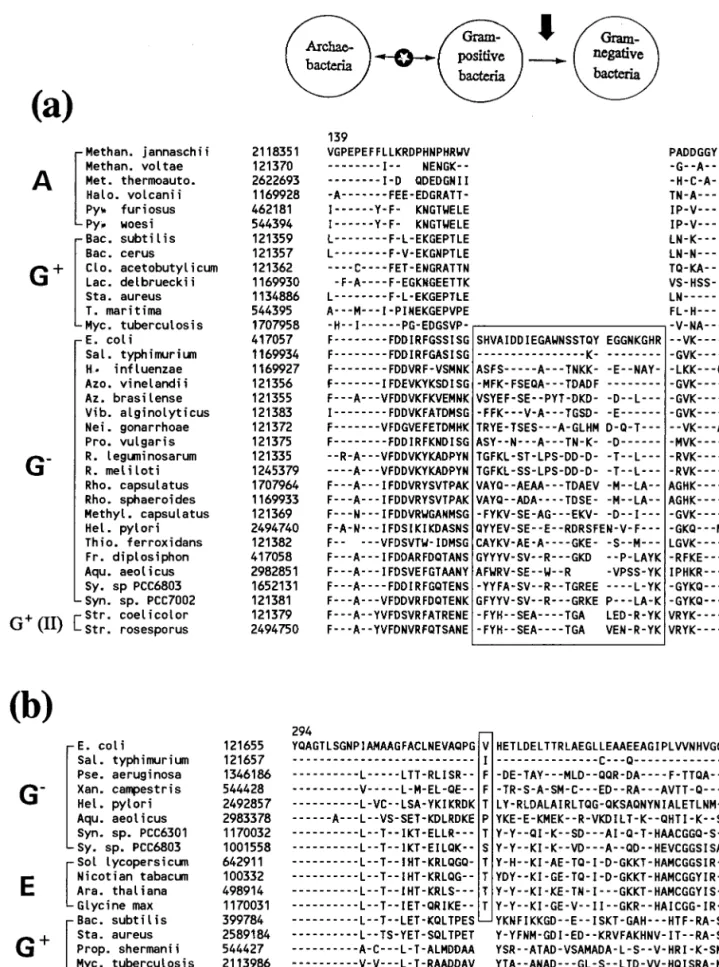
FIG. 2. Alignment of representative Hsp70 sequences from archaebacteria (A), gram-positive bacteria (G1), gram-negative bacteria (G2), eukaryotic-organellar
(O), and eukaryotic nuclear-cytosolic (E) homologs. Small regions from the N- and C-terminal ends, which are not properly aligned in the global alignment of sequences and hence are not included in phylogenetic analyses, are not shown. The dashes indicate identity to the residue in the top line. The accession numbers of the sequences are shown. The boxed region shows the large insert in the N-terminal region present in all gram-negative bacteria and eukaryotic homologs. The solid lines above the sequence alignment identify several highly conserved regions that have proven useful to design degenerate primers for cloning purposes (57, 76, 102, 103, 107). The numbers at the beginning and at the end of the alignment denote the positions of the first and last amino acids included in individual protein sequences. The sequences were aligned by using the CLUSTAL program from PC Gene software package (IntelliGenetics), and minor changes were made to correct any visible misalignments. The abbreviations (m) and (chl) identify mitochondria and chloroplasts.
FIG. 2—Continued.
in the phylogenetic analyses of distantly related taxa with vary-ing G1C contents, the larger number of characters in the nucleic acid sequences does not offer any real advantage, and if the bases at the third codon positions (and often those at the first positions as well) are not excluded from the analyses, misleading results could be obtained. In view of these consid-erations, for the protein-coding regions, the amino acid se-quences, which are minimally affected by the differences in the G1C contents of the species, have proven more reliable and are the preferred choice for phylogenetic analyses (111, 113, 231).
In contrast to the protein-coding regions, where the codon degeneracy provides a natural mechanism for accommodating changes caused by G1C drifts, the effect of varying G1C compositions on structural nucleic acid sequences such as rRNA or tRNA remains largely undetermined. Thus, when comparing sequences from different species with varying G1C compositions, it is difficult to distinguish between the changes that are due to G1C drift (evolutionarily not significant) from those that are evolutionarily important. Thus, in any analyses based on structural nucleic acid sequences, the signal-to-noise ratio is inherently low. The effect that this will have on phylo-genetic reconstruction cannot be easily determined or cor-rected, but this is a major and continuing source of concern in phylogenetic studies based on structural nucleic acids such as the 16S rRNA. As pointed out by Woese (251), “The problem (of) disparity in base composition is far more troublesome than is generally recognized and has almost received no attention to date. . . . It is important to understand the extent to which the general pattern reflects rRNA compositional disparity rather than the true phylogeny.”
Another major problem in phylogenetic analyses is the reli-ability of the sequence alignment. The alignment of homolo-gous positions in a set of sequences is the starting point in phylogenetic analyses from which all inferences are derived. Hence, the importance of having a reliable alignment for phy-logenetic studies cannot be overemphasized. Most sequence alignment programs work by recognizing local similarity in different parts of molecules and then creating an alignment of all positions which maximizes the number of matches between the sequences, keeping the number of gaps introduced to a minimum (117). Although the alignment programs work sim-ilarly for both nucleic acid and protein sequences, there are important differences. In nucleic acid sequences there are only four characters, and hence the number of matches between any two sequences (unrelated) is expected to be a minimum of 25%; with the introduction of a small number of gaps, it is commonly in the range of 40 to 50%. In view of this, the probability of chance alignment of nonhomologous regions in two sequences is quite high, particularly if the sequences being compared are of different lengths and have either unusually high or low G1C contents. In contrast, in proteins each char-acter has 20 states, which greatly reduces the probability of chance alignment between nonhomologous regions. There are no standard criteria for a good alignment, but it is generally assessed empirically by means of visual inspection. If the set of sequences contains highly conserved regions dispersed throughout the alignment, the proper alignment of such re-gions in all sequences is indicative of a good alignment. How-ever, for sequences which do not contain many such regions, it is often difficult to get a reliable alignment for phylogenetic studies. Very often, differences in sequence alignment, the regions included in the phylogenetic analyses, or even the order in which the sequences are added in an alignment (151) could lead to important differences in the inferences drawn (42, 112).
Most extensive phylogenetic studies of living organisms have been carried out based on the SSU rRNA sequences (8, 77, 86, 149, 152, 224), which have been called the “ultimate molecular chronometers” by Woese (250). However, the alignment of rRNA sequences from various prokaryotic and eukaryotic spe-cies presents unique problems. In view of the large differences in the lengths of prokaryotic ('1,500 nucleotides) and eukary-otic ('2,000 nt) SSU rRNAs (mitochondrial SSU rRNA from some species is only 612 bp long [89]) and the wide variations in the G1C contents of species, a reliable alignment of rRNA sequences from distantly related taxa cannot easily be obtained based on the primary sequence data alone. The approach taken to get around this problem is to rely on the secondary-structure models of rRNA, based on the assumption that the secondary structure of the rRNA is highly conserved and pro-vides a reliable guide for identification of homologous posi-tions (252, 257, 259). Based on this, porposi-tions of the folded molecules (i.e., particular loops or stems) that are postulated to be similar in different sequences are aligned and used for phylogenetic studies.
The use of secondary-structure models for identification and alignment of homologous positions in the SSU rRNA is a very serious and far-reaching assumption. From an energetic point of view, the SSU rRNA can assume many different but equally likely secondary structures (259). While the proposed struc-tures of rRNAs are supported by enzymatic digestion and chemical modification studies of some species (257, 259), their validity in distantly related prokaryotic and eukaryotic taxa is far from established. The effect that these far-reaching as-sumptions, on which all rRNA alignments are based (8, 33, 181, 184, 189, 224, 251), will have on the deduced phylogenetic relationships remains to be determined. However, it is clear that these assumptions have the potential to profoundly influ-ence the outcome of any analyses (111).
In contrast to the rRNA sequence alignment, alignment of amino acid sequences of a highly conserved protein such as the 70-kDa heat shock chaperone protein (Hsp70) requires mini-mal or no assumptions. Because of the similar size of this protein in various prokaryotic and eukaryotic species (includ-ing organellar homologs) and its high degree of sequence con-servation, a good alignment of the sequences from various species is readily obtained by using any common sequence alignment program (117) or even manually by placing the se-quences next to each other. Figure 2 shows an alignment of 25 Hsp70 sequences covering the prokaryotic and eukaryotic spectrum as well as organellar homologs. The alignment shown was obtained with the CLUSTAL program from the PCGENE software, and only minor corrections to it have been made manually. The large number of identical and conserved resi-dues present throughout the length of this alignment gives confidence that the observed alignment is reliable. The global alignment of Hsp70 sequences shows many regions that are nearly completely conserved in all species. Degenerate primers based on these sequences have been successfully used to clone the gene encoding Hsp70 from a wide range of prokaryotic and eukaryotic organisms (56, 57, 76, 102, 103, 107, 108).
Once a (reliable!) sequence alignment has been obtained, three main types of methods are used for phylogenetic recon-struction: those based on maximum parsimony (58, 64), those based on pairwise genetic distances between the species (65, 207), and the maximum-likelihood method (58, 137). These methods interpret the sequence alignment in different ways, and therefore the results obtained from them often differ (110, 238). All these methods, as well as the others (e.g., evolution-ary parsimony [152]), can give rise to incorrect relationships under different conditions. Five main factors affecting the
come of these analyses are (i) an underestimation of the num-ber of genetic changes between the species (often multiple changes in a position are counted as either one or no change); (ii) the long-branch-length effect, where two distantly related taxa may appear more closely related than they truly are if there are no intermediate taxa to break the long branches (62); (iii) large differences in the evolutionary rates among different species in the data set; (iv) horizontal or lateral gene transfers between the species (236a); and (v) comparison of paralogous sequences which are the results of unidentified ancient gene duplication events (62, 110, 152, 233, 238). In most cases, it is difficult to ascertain the effects of different factors and to de-termine which phylogenetic method is more suitable or reli-able. Hence, phylogenetic analyses are generally carried out by different methods to see if all the methods give similar results. The reliability of phylogenetic relationships inferred from the above methods is commonly assessed by performing a bootstrap test (59). In this test, the aligned sequences are sampled randomly and certain numbers of columns in the original alignment are replaced with columns from elsewhere in the sequences to obtain 100 or more different alignments, each containing the same number of columns. Thus, in a given bootstrap set, some columns will not be included at all, others will be included once, and still others will be repeated two or more times. Phylogenetic analysis is then performed on each of the bootstrap replicates, and a consensus tree from this data is drawn. The main purpose that bootstrap analyses serve is to provide a measure of the variability of the phylogenetic esti-mate or confidence levels in the observed evolutionary rela-tionships. If the sample data throughout the sequence length support a particular relationship, this will be reflected in the grouping of the species in all (or a vast majority) of the boot-straps. The results of these analyses are presented by placing bootstrap scores (indicated by the percentages or the number of times that different species group together in bootstrap trees) on different nodes in the tree. Bootstrap values of.80 to 85% are generally considered to provide good support for a specific phylogenetic relationship.
Despite due care in the alignment and analyses of the se-quence data, interpretation of the phylogenetic trees that are obtained is not straightforward. The most common problem in this regard is that phylogenetic trees based on different genes or proteins may differ from each other in terms of the evolu-tionary information that they provide. Based on the clock anal-ogy discussed above, some genes are better suited to resolve certain relationships than are others. Thus, while a particular relationship may be clearly resolved and strongly supported by one gene phylogeny, the same relationship may not be obvious from a different gene phylogeny. Such results are generally regarded as controversial by many scientists, including evolu-tionary biologists (49, 53, 69, 70), but it is important to realize that they are not. Part of the problem in the interpretation of new data stems from the commonly held perception that phy-logenetic trees based on just one or two molecules (e.g., 16S rRNA) can clearly establish the evolutionary relationships be-tween all extant species (181, 184, 188, 202, 224, 250–252). This means that any results that do not concur with the 16S rRNA phylogenies are generally considered deviant and suspicious (69). However, such a notion is clearly erroneous, in view of the limitations of the rRNA-based phylogenies noted above and the inability of the 16S rRNA trees to resolve the branch-ing orders of the deeply lybranch-ing taxa within eubacteria: “(In the 16S rRNA phylogeny) the majority of the bacterial phyla arise in such a tight radiation that their exact order of branching has yet to be resolved” (252).
Cognizant of these problems, many scientists working in this
area have urged caution in the interpretation of phylogenetic data. Woese wrote (252): “The scientifically proper stance for the microbiologists to take at this juncture will be to treat these phylogenies (bacterial) as hypotheses, and test them using other molecules, phenotypic characteristics of the organisms, and so on. When the same or very similar relationships are given by different molecular systems or when new phenotypic similarities consistent with the projected phylogenies turn up, then that phylogeny can be confidently accepted”; Rothschild et al. wrote (202): “We encourage phylogenetic analyses where molecular approaches are evaluated in the light of other avail-able data, and where the strengths as well as subjective and weak aspects of the analyses are made explicit”; and Murray et al. stated (177): “The integrated use of phylogenetic and phe-notypic characteristics, called polyphasic taxonomy (38), is nec-essary for the delineation of taxa at all levels from Kingdom to genus”. I do not think any evolutionary scientist will disagree with the above statements or suggested approaches.
It is clear from the above discussion that the results of phylogenetic analyses should not be uncritically accepted but instead should be evaluated in the light of other available data, including data from morphological, geological, and fossil sources. There is also a pressing need to develop additional sequence-based criteria for determining the evolutionary rela-tionships among species, which are based on minimal assump-tions and which could be readily understood and interpreted by both specialists and nonspecialists. In the next few sections, I present evidence that conserved inserts or deletions restricted to specific taxa (170), which are referred to as signature se-quences in the present work, provide such criteria.
SEQUENCE SIGNATURES AND THEIR IMPORTANCE IN EVOLUTIONARY STUDIES
Signature sequences in proteins could be defined as regions in the alignments where a specific change is observed in the primary structure of a protein in all members of one or more taxa but not in the other taxa (99, 107, 198). The changes in the sequence could be either the presence of particular amino acid substitutions or specific deletions or insertions (i.e., indels). In all cases, the signatures must be flanked by regions that are conserved in all the sequences under consideration. These conserved regions serve as anchors to ensure that the observed signature is not an artifact resulting from improper alignment or from sequencing errors. Although changes of various kinds can serve as sequence signatures (56, 99), in the analyses pre-sented here I have mainly considered only signatures involving indels. My reason for focusing on indels is that I think they are less likely to result from independent mutational events occur-ring over a long period (see below), compared with change in nucleotides and hence amino acids. Since this review is the first detailed attempt to use conserved indels as phylogenetic mark-ers to discern the course of evolutionary history, a discussion of the rationale for such studies as well as their limitations and pitfalls is provided.
The rationale of using conserved indels in evolutionary stud-ies could briefly be described as follows. When a conserved indel of defined length and sequence, and flanked by conserved regions (which ensure that the observed changes are not due to improper alignment or sequencing errors), is found at precisely the same position in homologs from different species, the sim-plest and most parsimonious explanation for this observation is that the indel was introduced only once during the course of evolution and then passed on to all descendants. This is a minimal assumption implicit in most evolutionary analyses.
Thus, based on the presence or absence of a signature se-quence, the species containing or lacking the signature can be divided into two distinct groups, which bear a specific evolu-tionary relationship to each other. A well-defined indel in a gene or protein also provides a very useful milestone for evo-lutionary events, since all species emerging from the ancestral cell in which the indel was first introduced are expected to contain the indel whereas all species that existed before this event or which did not evolve from this ancestor will lack the indel. Further, if specific indels could be identified in proteins that coincide with or were introduced at critical branch points during the course of evolution, such signatures could serve as important phylogenetic markers for distinguishing among ma-jor groups of organisms.
In using conserved indels as phylogenetic markers, two po-tentially serious problems that could affect the interpretation of any data should be kept in mind. First, there is the possibility that the observed indel was introduced on multiple occasions in different species due to similar functional constraints and selection pressure rather than being derived from a common ancestor. Second, lateral gene transfer between species could also readily account for the presence of shared sequence fea-tures in particular groups of organisms. While a definitive resolution of the question whether a given sequence signature is due to common ancestry or results from these two causes is difficult in most cases, important insights concerning the sig-nificance of such data are often provided by consideration of information from other sources.
The most important and relevant information bearing on this issue is provided by consideration of cell structure and physiology. In this context, it should be emphasized that the aim of phylogenetic analysis is to explain and reconstruct the evolutionary history of organisms. Hence, the structural and physiological characteristics of organisms are of central impor-tance, and they should be the ultimate arbiter in determining the significance of such data. Without this context, phyloge-netic analysis of sequence data could become an end in itself, bearing little relation to the organisms. Therefore, if the infer-ence derived from a given signature sequinfer-ence or phylogenetic analysis is consistent with an important structural (e.g., cell envelope structure) or physiological attribute of the organisms, it is likely that we are on the right track, and it gives confidence in the correctness of the inference. On the other hand, if the inferences based on signature sequences and phylogenetic analyses are at a variance with important structural and physiological characteristics, one should ask questions about why it is so rather than distrusting or ignoring these char-acteristics.
Another useful criterion in assessing whether a given signa-ture is of evolutionary significance is provided by its species distribution. If a given sequence signature is present in all known members of a given taxa, it is more probable that it was introduced only once in a common ancestor of the group and then passed on to all descendants. In such cases, phylogenies based on other gene sequences are also expected to be gener-ally consistent with and support the inference drawn from the signature. In contrast, when a shared indel is present either in only certain members of particular taxa or when species con-taining the signature show no obvious structural or physiolog-ical relationship, the possibility that the observed signature is a result of independent evolutionary events or horizontal gene transfers becomes more likely. In our analysis, we have come across several examples of signature sequences which provide evidence of lateral gene transfers between species
(unpub-lished results). Such signatures are of limited use in deducing phylogenetic analysis and, except for a few, will not be de-scribed here.
The presence of well-defined signature sequences in pro-teins should allow one to establish evolutionary relationships among species by means of molecular cladistic analysis. This approach, although not generally applicable to all proteins (because most proteins do not contain useful sequence signa-tures), has certain advantages over traditional phylogenetic analyses based on the gene or protein sequences. First, in traditional phylogenetic analysis, the evolutionary relation-ships among different species are determined based upon the assumption of a constancy of evolutionary rate in all species (58, 60, 65, 136). Since this assumption is rarely correct over long periods (84), the differences in evolutionary rates could lead to incorrect species relationships. However, the signature sequences, such as conserved indels of defined sizes, should not be greatly affected by the differences in evolutionary rates. The proteins which are greatly affected by the differences in evolutionary rates are unlikely to contain well-defined indels in conserved regions and hence will be excluded from consider-ation. A second common and serious source of problems in phylogenetic analysis involves sequencing errors, and anyone involved in DNA sequencing should be familiar with this. For example, sequence compressions which are not satisfactorily resolved are a common occurrence, particularly in G1C-rich sequences. The errors introduced in reading such regions could lead to either localized (from base and amino acid sub-stitutions) or extended (from frameshifts) changes in the gene or protein sequences. In one study, the error frequency in DNA sequences in the databases has been estimated at 3.55% (146), although other estimates indicate it to be much lower (145). An additional but related problem involves the increas-ing number of sequences in the databases which have been obtained by PCR amplification and sequenced by automated means. The higher rates of sequence errors and contamination in such sequences should be a cause of concern. These factors could affect the branching orders of species in phylogenetic trees. However, it is highly unlikely that a sequencing error could give rise to an indel of a defined length and sequence at a precise position within a conserved region. A signature of even one amino acid involves the addition or deletion of three nucleotides in the DNA sequence at a precise position and hence is highly significant. Third, a very common problem in evolutionary analyses (discussed in the previous section) is that the phylogenetic trees based on certain genes (or proteins) may fail to resolve the branching orders (e.g., low bootstrap scores for the nodes) for particular groups of species and hence the results of these studies will be indeterminate; i.e., they neither support nor refute a particular relationship (21, 85). However, this is not a problem in the case of signature se-quences, where the relationship is assessed based on the pres-ence or abspres-ence of a given signature and thus its interpretation is unambiguous. One expects that the relationship indicated by signature sequences should generally be consistent with and supported by the phylogenetic analysis based on other gene or protein sequences. However, the analyses based on signature sequences are limited in one sense: whereas a phylogenetic tree provides information about evolutionary interrelation-ships among all species in a tree, a given signature sequence is limited to distinguishing and establishing the evolutionary re-lationship between the two groups of species, i.e., those con-taining and those lacking the signature.
ROOT OF THE PROKARYOTIC TREE: ANCESTRAL NATURE OF ARCHAEBACTERIA AND
GRAM-POSITIVE BACTERIA
To fully understand and correctly interpret the implications of a given sequence signature, a reference point is required. When an indel is present in one group of species and absent from others, it is difficult to say a priori which of these groups is ancestral and which is derived. While this problem cannot be resolved in most cases, one instance where valuable additional information helpful in resolving this question is available cor-responds to a signature identified in the Hsp70 family of pro-teins. Hsp70 homologs from different gram-negative bacteria contain a conserved insert of 21 to 23 amino acids which is not present in any homolog from gram-positive bacteria or archae-bacteria (Fig. 3) (103, 107, 108). This sequence signature could result either from a deletion in the common ancestor of all archaebacteria and gram-positive bacteria or from an insertion in the common ancestor of all gram-negative bacteria. De-pending upon which of these scenarios is correct, one of these groups of prokaryotes becomes ancestral and the other be-comes derived. Resolution of this question is provided by a number of different observations.
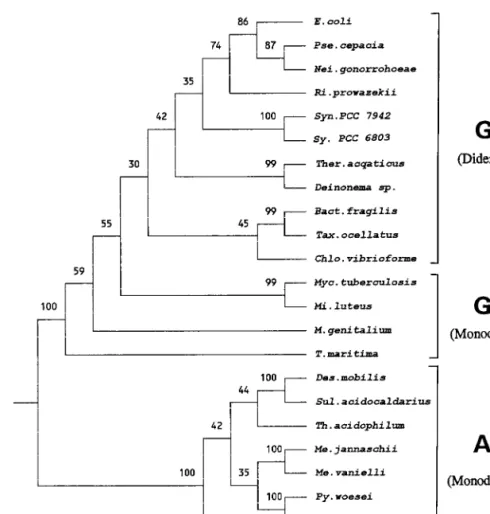
First, based on the duplicated gene sequences for EF-1a/Tu and EF-2/G proteins, where one set of sequences could be used to root the other tree, the roots of both EF-1a/Tu and EF-2/G trees have been shown to lie between the archaebac-terial lineage and the eubacarchaebac-terial species Thermotoga maritima (7, 21, 112). A tree for EF-1a/Tu sequences, which was rooted by using EF-2/G, is shown in Fig. 4. As seen in this figure, the root of the tree lies in between archaebacteria and eubacteria and the deepest branches within eubacteria consist of T. ma-ritima and other gram-positive bacteria. A similar rooting of the universal tree in between archaebacteria and T. maritima has been independently made based on trees constructed from homologous isoleucine-, leucine-, and valine-tRNA synthetase sequences (20). Although the species T. maritima has been assumed to be a gram-negative bacterium in the past (184, 250, 251, 258), recent studies based on several proteins provide evidence that it should in fact be grouped with gram-positive bacteria (22). This inference is supported by signature se-quences in Hsp70 (Fig. 3) and a number of other proteins (see “Evolutionary relationships among prokaryotes”), where T. maritima behaves similarly to various gram-positive bacteria and differently from different gram-negative bacteria. Phyloge-netic analyses based on a number of proteins, i.e., Rec A (55, 131, 247) and sigma factor 70 (39), also provide evidence of a grouping of T. maritima with gram-positive bacteria. Most im-portantly, Cavalier-Smith (31) has pointed out that T. mari-tima, similar to other gram-positive bacteria, is bounded by only a single unit lipid membrane, which I consider to be the main defining characteristic of gram-positive bacteria. In view of these observations, the results of the above rootings indicate that the root of the prokaryotes lies between archaebacteria and gram-positive bacteria.
A second independent line of evidence supporting the an-cestral nature of the clade consisting of archaebacteria and gram-positive bacteria is provided by a comparison of se-quences for the Hsp70 and the MreB families of proteins. We have previously shown that MreB protein, which is about half the length of Hsp70 (about 340 amino acids [aa], with respect to 600 to 650 a.a. for Hsp70) and is present in all major groups of prokaryotes (archaebacteria, gram-positive bacteria, and gram-negative bacteria), shows significant similarity to the N-terminal half of Hsp70 sequences (107), where the large indel in the Hsp70 homologs is present. The three-dimensional
structures of the MreB protein and the N-terminal half of Hsp70 are also very similar (18, 65a), supporting the view that these proteins have evolved from a common ancestor (18). Since both Hsp70 and MreB proteins are found in all main groups of prokaryotes, they very probably evolved by an an-cient gene duplication in the universal ancestor, before Hsp70 acquired the C-terminal domain (104, 107). In view of this, we expect that if the above indel in Hsp70 is an insert in gram-negative bacteria, the MreB protein sequences should not pos-sess it. On the other hand, if the homologs containing the insert are ancestral, this insert should also be found in the MreB sequences. A comparison of MreB and Hsp70 sequences from the major group of prokaryotes (Fig. 5) shows that, sim-ilar to the Hsp70 from archaebacteria and gram-positive bac-teria, this insert is not present in any of the MreB sequences, including those from gram-negative bacteria. (It should be mentioned that since MreB and Hsp70 are very distant ho-mologs, the sequence similarity between these proteins is lim-ited. However, despite this fact, the inference that MreB pro-tein does not contain the insert is quite apparent.) This observation provides strong independent evidence that the prokaryotic organisms lacking the insert (i.e., archaebacteria and gram-positive bacteria) are ancestral and that this insert was introduced into Hsp70 in a common ancestor of the gram-negative bacteria (104, 107). I will refer to this insert, which is a distinguishing feature of gram-negative bacteria and eu-karyotes, as the diderm insert, signifying its point of evolution-ary origin.
Lastly, the view that archaebacteria and gram-positive bac-teria are ancestral lineages is also consistent with the available evidence concerning the planet’s early environment. Based on Earth’s geological history, the conditions under which the ear-liest organisms evolved were hot and anaerobic (Fig. 6). The widespread prevalence of the ability to exist under these con-ditions in various archaebacteria and gram-positive bacteria (67, 186, 232, 250) is consistent with the view that these groups are ancestral. Based on the above pieces of evidence, all of which lead to a similar inference, I am going to assume that the rooting of the prokaryotic tree between (or within) archaebac-teria and gram-positive bacarchaebac-teria is correct, and I will examine whether this rooting can explain other observations and phy-logenies.
The root provides an important reference point for evolu-tionary studies. By using this reference point, it should now be possible to understand and interpret signature sequences in different proteins to piece together the evolutionary relation-ship and history of the other groups of prokaryotes. In the following sections, I describe signature sequences in different groups of species and my interpretation of them based on the above rooting. Since a great deal of work that follows is based on signature sequences that are reported for the first time, it is appropriate to describe the approach taken to identify the signature sequences. The signature sequences in a number of proteins such as Hsp70 and Hsp60 were empirically discovered (96, 104, 107, 108). However, the complete genomes of several gram-positive bacteria (Mycoplasma genitalium [73], Myco-plasma pneumoniae [119], and Bacillus subtilis [147], gram-negative bacteria (Haemophilus influenzae [66], Escherichia coli [15], Synechococcus sp. strain PCC 6803 [128], Helicobacter pylori [242], Borrelia burgdorferi [72], and Aquifex aeolicus [45]), and archaebacteria (Methanococcus jannaschii [26], Meth-anobacterium thermoautotrophicum [215], and Archaeoglobus fulgidus [138]) have recently been reported. In view of this, to search for signature sequences in different proteins, a system-atic approach was used. For these purposes, we performed a BLAST search (5) on each of the unique proteins identified in
FIG. 3. Signature sequence in Hsp70 proteins showing a specific relationship between archaebacteria (A) and gram-positive bacteria (G1) (both monoderm
prokaryotes) and the distinctness of gram-negative bacteria (G2) (diderm prokaryotes). The large indel common in all gram-negative bacteria (referred to as the diderm
insert) but absent in all monoderm prokaryotes is boxed. In the top diagram,Wdenotes the root of the prokaryotic tree as inferred in the text. The thick arrow indicates the probable stage where this signature was introduced. The dashes in all sequence alignments show identity to the amino acids in the top line.
the genomes of M. genitalium, H. influenzae, and M. jannaschii. The BLAST program compares a given query sequence against all other proteins and nucleic acid sequences in the databases (with the nucleic acid sequences translated in different possible frames) to identify related proteins and present them in the order from highest to lowest similarity scores. For many pro-teins, too few high-scoring sequences, which are suggestive of true homologs, were available to be useful for evolutionary studies. These proteins were not further considered at this stage. However, for proteins for which sufficient high-scoring sequences were identified from the major groups of pro-karyotes, the sequences for various homologs were retrieved and a multiple sequence alignment was created with the CLUSTAL program (117). The sequence alignments were in-spected visually for signature sequences (indels) that were shared by all members from particular taxa of prokaryotes. The indels which were not flanked by conserved regions were judged to be unreliable and were not considered as signature sequences in the present work. In cases where useful sequence signatures were observed in prokaryotic organisms, homologs from eukaryotic species were also retrieved and aligned to determine the relationship to the prokaryotes. Much of the work on the identification of signature sequences was com-pleted by October 1997, and hence information released after this date may not be included here.
EVOLUTIONARY RELATIONSHIPS AMONG PROKARYOTES
That the ancestral organisms were prokaryotes and that the eukaryotes originated from these at a later time is a view consistent with the fossil record, which supports the existence of prokaryotic organisms as far back as 3.5 to 3.8 Ga whereas the earliest identifiable eukaryotic fossils are only about 1.8 Ga old (30a, 141, 162, 209). The Earth’s geological and environ-mental history also supports this view (Fig. 6). There is good evidence that for the first 2.0 to 2.5 Ga, the Earth’s atmosphere contained little, if any, oxygen, and hence the earliest organ-isms that evolved were anaerobic, whereas aerobic organorgan-isms evolved from these at a later time (132, 141, 208, 209). Since most eukaryotic organisms require oxygen for growth, it is very likely that they arose at a time when the atmospheric oxygen content was stable and relatively high (162, 208). There is thus little doubt that “All of the planet’s early evolutionary history and well over 90% of life’s phylogenetic diversity lie in the microbial world” (183). In view of this, the problem of under-standing the evolutionary relationships among living organisms could be divided into two distinct parts. In the first part, we will examine the evolutionary relationship within the prokaryotes that pre-dated the eukaryotes. In the second part, based on our understanding of the prokaryotes, we will try to determine how FIG. 4. A rooted neighbor-joining tree of prokaryotic organisms based on EF-1a/Tu sequences. The tree was rooted by using aligned EF-2/G sequences, which are derived from an ancient gene duplication in the common ancestor of prokaryotes (126). The tree shown is a neighbor-joining consensus tree obtained after 100 bootstraps. The bootstrap scores for various nodes are shown. The tree reveals that the root of the prokaryotes lies in between two groups of monoderm prokaryotes. A, G1, and G2refer to archaebacteria, gram-positive bacteria, and gram-negative bacteria, respectively.
eukaryotic organisms are related to the prokaryotes. It should be emphasized that these two questions are completely inde-pendent. Therefore, while considering the evolutionary rela-tionships within prokaryotes, there is no need to confound or bias the evolutionary relationships by considering sequences from various prokaryotes and eukaryotes at the same time, as has been commonly done in most earlier studies (7, 21, 49, 53, 69, 70, 81, 112, 126, 196, 198, 258, 262).
Signature Sequences Showing the Distinctness of Archaebacteria
Signature sequences consisting of distinct nucleotides that are present at particular positions in the SSU rRNA and that
distinguish archaebacteria from other prokaryotes have been described by Woese (251, 253). The view that archaebacteria are distinct from other prokaryotes is also supported by signa-ture sequences in many proteins. The elongation factor EF-1/Tu provides a well-studied example (Fig. 7a), where a 12-aa indel is present in various archaebacteria but not in any of the eubacteria including different genera of gram-positive bacteria (99, 112). Some other proteins where signature sequences unique to archaebacteria are found include ribosomal proteins L5 (Fig. 7b), S5 (Fig. 7c), and L14 (Fig. 7d). As expected from these signatures, the inference that archaebacteria are distinct from other prokaryotes is strongly supported by phylogenetic analyses based on rRNA, EF-1/Tu, and these other proteins (7, 21, 71, 87, 112, 126, 250). For all the above proteins, the FIG. 5. Alignment of Hsp70 and MreB sequences from different groups of species showing the absence of the diderm insert in the MreB sequences. The absence of the insert in all MreB proteins, as well as Hsp70 homologs from archaebacteria and gram-positive bacteria (boxed region), provides evidence that the homologs lacking the insert are ancestral. (104, 107). The numbers at the beginning and at the end indicate the position of the sequence in individual proteins.
FIG. 6. Time line showing some of the main events in the history of this planet based on geological and fossil evidence (132, 141, 208, 209).
identified signature sequences are present only in archaebac-teria but not in any eubacarchaebac-teria. These results support the view that archaebacteria are monophyletic and distinct from other prokaryotes. (The question of archaebacterial monophyly and of the evolutionary relationships within archaebacteria is ex-amined in detail below; see “Nature of the archaebacterial group and its relationship to gram-positive bacteria”). In my working model, which places the root between archaebacteria and gram-positive bacteria, these signatures were probably in-troduced in a common ancestor of either archaebacteria or gram-positive bacteria after separation of the two lineages (diagram in Fig. 7). In addition to these signature sequences, the distinctness of archaebacteria from eubacteria is supported
by a number of other genes (21, 144, 183). These include large-subunit (LSU) rRNA (48); many genes involved in DNA replication (54), transcription (158, 197, 203), translation (47, 183), tRNA splicing (9), and in histones (197); and the Tcp-1 chaperonin (96). For a number of these genes and proteins, no eubacterial homologs or any closely related eubacterial ho-mologs have been found (9, 21, 47, 54, 95, 96, 144, 183, 197).
Signature Sequences Distinguishing Archaebacteria and Gram-Positive Bacteria from Gram-Negative Bacteria
A specific relationship between archaebacteria and gram-positive bacteria to the exclusion of other prokaryotes is sug-FIG. 7. Excerpts from EF-1a/Tu (a), ribosomal protein L5 (b), ribosomal protein S5 (c), and ribosomal protein L14 (d) alignments identifying signature sequences that show the distinctness of archaebacteria (A) from eubacteria (G1and G2). The common indels that distinguish archaebacteria from eubacteria are boxed. (The
relationship of prokaryotes to the eukaryotes [E] is considered in later figures).Wdenotes the root of the prokaryotic tree as inferred in the text, and the thick arrow indicates the probable stage where these signatures were introduced.
gested by a number of protein sequences. The Hsp70 protein discussed above provides the best-studied example of such sequences. As seen in Fig. 3, the Hsp70 homologs from various archaebacteria and gram-positive bacteria are distinguished from all other prokaryotic homologs by the absence of the large diderm insert in their N-terminal quadrant. The species which do not contain the insert include the methanogenic, thermoacidophilic (Thermoplasma acidophilum), and halo-philic archaebacteria and different genera of low-G1C and high-G1C gram-positive bacteria. The Mycoplasma species, which lack a cell wall, and a number of other species, e.g., Thermotoga maritima and Megasphaera elsdenii, showing anom-alous Gram staining (251), also lacked the diderm insert, pro-viding strong evidence for their placement in this group. In contrast to these groups, all members of other eubacterial divisions, including the alpha, beta, gamma, delta, and epsilon subdivisions of the proteobacteria, chlamydias, spirochetes, cy-tophagas, flavobacteria, cyanobacteria, green nonsulfur bacte-ria, Deinococcus, Thermus, and Aquifex, which traditionally form the gram-negative group, contained this insert. The in-ference from this shared signature sequence that archaebacte-ria are specific relatives of and more closely related to gram-positive bacteria than to gram-negative bacteria is strongly supported by the detailed phylogenetic analyses based on Hsp70 sequences (56, 57, 85, 103, 104, 108). A neighbor-joining tree based on Hsp70 sequences is shown in Fig. 8. Various archaebacteria and gram-positive bacteria grouped together in 99% of the bootstraps, indicating strongly that they are evolu-tionarily closely related. In contrast, all of the gram-negative bacteria formed a separate clade, indicating their phylogenetic distinctness. A close relationship of archaebacteria to gram-positive bacteria and the distinctness of gram-negative bacteria are also supported by other phylogenetic methods such as maximum parsimony and maximum likelihood (85, 104, 108). Furthermore, it should be noted that the archaebacterial spe-cies in the Hsp70 tree do not form a monophyletic clade but instead show polyphyletic branching within gram-positive bac-teria. The significance and possible interpretations of this ob-servation are discussed below (see “Nature of the archaebac-terial group and its relationship to gram-positive bacteria”).
A close and specific relationship between archaebacteria and gram-positive bacteria is also supported by signature se-quences in a number of other proteins. In the glutamine syn-thetase I (GS I) sequences, a conserved insert of 26 aa is present in all gram-negative bacteria but not in various archae-bacteria or gram-positive archae-bacteria (Fig. 9a) (22). Similar to the Hsp70 sequence, T. maritima also lacked the insert in its GS I sequence, supporting the view that it is a gram-positive bacte-rium. Aquifex aeolicus, on the other hand contained this insert, supporting its grouping with gram-negative bacteria as indi-cated by its Hsp70 sequence signature (Fig. 3). Phylogenetic analyses of GS I sequences again strongly support the view that archaebacteria are evolutionarily close relatives of the gram-positive bacteria and show polyphyletic branching within them (22, 85, 239). It should be mentioned that although both Hsp70 and GS I sequences show similar relationships, the presence of two different families of GS sequences in a number of different soil bacteria means that the evolutionary inferences based on GS I sequences are not as clear-cut as those based on Hsp70 (22, 239). The GS II homologs from certain soil bacteria in-cluding some gram-positive bacteria (Streptomyces coelicolor and S. roseosporus) contain the insert, which is absent in their GS I sequences (Fig. 9a). These homologs in gram-positive bacteria are likely derived by means of horizontal gene transfer from the gram-negative species (146a).
The protein glutamate-1-semialdehyde 2,1-aminomutase
provides another example where a conserved indel is shared by various archaebacteria and gram-positive bacteria (Fig. 9b) but not by any of the gram-negative bacteria that have been exam-ined.
The presence of signatures that are common to archaebac-teria and gram-positive bacarchaebac-teria but not present in gram-neg-ative bacteria is best explained in terms of their introduction in a common ancestor of all gram-negative bacteria (Fig. 9, top diagram). Further, based on these signatures and those dis-tinctive for archaebacteria (Fig. 7), it is clear that gram-positive bacteria are related on the one hand to archaebacteria and on the other to gram-negative bacteria. Thus, gram-positive bac-teria occupy an intermediate position between archaebacbac-teria and gram-negative bacteria, and based on the rooting, the latter group has evolved from them.
The distinctness of gram-positive bacteria from gram-nega-tive bacteria is also supported by signature sequences in a number of other proteins. In the highly conserved Hsp60 or GroEL protein, where sequence information is available for most of the known bacterial phyla, including different subdivi-sions of proteobacteria, chlamydia, spirochetes, cytophagas, flavobacteria, cyanobacteria, Deinococcus, Thermus, Aquifex, and different groups of gram-positive bacteria, a 1-aa insert is present in various gram-negative bacteria (Fig. 10). The spe-cies Thermus aquaticus and Deinococcus proteolyticus, which contain an outer membrane, are exceptions which are dis-cussed below (see “Signature sequences indicating that Deino-coccus and Thermus are intermediates in the transition from gram-positive to gram-negative bacteria”). Additional exam-ples of proteins which show similar behavior to Hsp60 are also described in this later section. In phylogenetic trees based on Hsp60 sequences, the gram-negative bacteria form a monophy-letic clade distinct from various gram-positive bacteria (Fig. 11) (96, 98, 246). The tree shown in Figure 11 is unrooted. However, in other studies where the Hsp60 tree was rooted with the TCP-1 protein, which is a distant Hsp60 homolog present in archaebacteria (95, 243), the low-G1C gram-posi-tive bacteria were the deepest-branching group within the eu-bacteria (96, 98).
A Specific Relationship between Archaebacteria and Gram-Positive Bacteria and the Distinctness of Gram-Negative
Bacteria Is Consistent with Prokaryotic Cell Structures and Other Gene Phylogenies
The presence of the indicated signatures in Hsp70, GroEL, and GS I sequences in all members of the main phyla or divisions within the gram-negative bacteria provides evidence that this group of prokaryotes is monophyletic and distinct from archaebacteria and gram-positive bacteria. This inference is in sharp contrast to that reached based on SSU rRNA sequences. The trees based on SSU rRNA generally place positive bacteria between different divisions of gram-negative bacteria (55, 75, 181, 184, 250, 251). The eubacterial divisions, consisting of Thermotogales, green nonsulfur bacte-ria, deinococci, and cyanobactebacte-ria, generally show deeper branching than do gram-positive species, whereas other divi-sions, including proteobacteria, planctomycetes, spirochetes, chlamydiae, cytophagas, and flavobacteria, branch either lower than or in a similar position to gram-positive bacteria (35, 181, 184, 250, 251). However, most published eubacterial phylog-enies based on rRNA do not give any bootstrap scores or other measures by which the confidence of these branching orders may be assessed (181, 184, 250, 251). In a few cases, where bootstrap scores are indicated, the values for most of the crit-ical nodes leading to gram-positive bacteria are in the range of
25 to 50%, indicating that these branching orders are unreli-able (55, 75). Thus, as acknowledged by Woese (251, 252), the branching orders of major eubacterial phyla cannot be resolved based on SSU rRNA phylogenies. A number of other gene and protein phylogenies that have been previously studied, e.g., 5S rRNA (122, 211), LSU rRNA (48), EF-Tu (42, 126), EF-G (16, 42), Rho (185), aspartate aminotransferase (249), glyceralde-hyde-3-phosphate dehydrogenase (114), sigma factor 70 (94), aminoacyl-tRNA synthetases (20), and RecA (55, 247), and a large number of proteins examined by Brown and Doolittle (21) similarly lacked the resolution to clarify the relationship between gram-positive bacteria and gram-negative bacteria. The inability of these phylogenies to resolve this relationship
occurs in part because these genes and proteins are not highly conserved (see also other factors discussed in “Molecular phy-logenies: assumptions, limitations, and pitfalls”), and for many of them only limited representation of eubacterial phyla was available.
Although most earlier gene phylogenies did not resolve the relationship between gram-positive and gram-negative bacte-ria, it is important to note that in the vast majority of these cases, gram-positive prokaryotes were indicated to be the clos-est relatives of archaebacteria. For example, in the reported phylogenies for 16S rRNA, EF-1a/Tu, EF-2/G, RNA polymer-ase, aminoacyl-tRNA synthetases, and various ribosomal pro-teins, which form the basis for defining archaebacteria as a FIG. 8. Consensus neighbor-joining tree for prokaryotic organisms based on Hsp70 protein sequences. The tree, which was bootstrapped 100 times, is based on 362 aligned positions for which sequence information from all species are known. Other trees based on larger numbers of aligned characters also show similar results (see Fig. 27) (57, 103, 108). The archaebacterial species (marked with asterisks) show a polyphyletic branching within gram-positive bacteria (both monoderm prokaryotes), which is statistically strongly supported (95, 108). The gram-negative bacteria (diderm prokaryotes) form a distinct clade in 99% of the bootstraps, which is highly significant. The relationships and branching orders of some of the main divisions within eubacteria are indicated.
FIG. 9. Signature sequence (boxed insert) in GS I (a) and glutamate-1-semialdehyde 2,1-aminomutase (b), showing the relatedness of archaebacterial (A) homologs to gram-positive (G1) bacteria and the distinctness of gram-negative (G2) bacteria. The top diagram indicates the suggested interpretation that these signature, as well
as the large diderm insert in Hsp70 protein (Fig. 3), were introduced into a common ancestor of G2bacteria. (a) G1(II) identifies sequences from some of the GS
II family of proteins (22, 205). E, eukaryotes.