Procedia Computer Science 85 ( 2016 ) 490 – 495
1877-0509 © 2016 Published by Elsevier B.V. This is an open access article under the CC BY-NC-ND license (http://creativecommons.org/licenses/by-nc-nd/4.0/).
Peer-review under responsibility of the Organizing Committee of CMS 2016 doi: 10.1016/j.procs.2016.05.198
ScienceDirect
International Conference on Computational Modelling and Security, CMS 2016
Classification of EEG Motor imagery multi class signals based on
Cross Correlation
D.Hari Krishna
a*, I.A.Pasha
a, T.Satya Savithri
b aB V Raju Institute of Technology, ECE Dept, Narsapur, Medak Dt 502313, India b
JNTU College of Engg, ECE Dept , Hyderabad 500085, India
Abstract
Many techniques are developed for improving the classification performance of motor imagery (MI) signals used in Brain computer interfacing (BCI). Still there is scope for improvement of performance using various techniques. In this paper, cross correlation (CC) technique has been used for features extraction from EEG signal and the final classification was done based on voting method which selects the best classifier among the five classifiers used for classification. Our approach was tested on public data set 2a from BCI competition IV. The results proved that our approach outperformed already existing approaches with 29.82% improvement in kappa values.
Keywords: Brain Computer Interface (BCI); Motor Imagery; EEG multi class Classification;cross correlation
1.Introduction
The term Brain-Computer Interface (BCI) depicts a system which decodes the brain signals and allows one to communicate or control a device. BCI was originally envisioned as a means through which the individuals with physical disabilities or the ones with neurological disorders such as ALS can communicate and control the specific devices [1, 2, 3]. Current BCI approaches also include applications in recreational domain as in gaming and virtual reality devices [4]. One of the studies implements a non-invasive BCI system to control an autonomous robot [5].
Electroencephalogram (EEG) is one of the popular approaches in BCI. Even though EEG provides low spatial resolution, its low cost and high temporal resolution makes it a very favoured among researchers. In EEG based BCI, there are two main approaches which are usually applied. The two approaches are called as ³Reactive BCI´
and ³Active BCI´ [6@7KHµ5HDFWLYH%&,¶DSSURDFKUHOLHVXSRQWKHLQYROXQWDU\QHXUDOUHDFWLRQVRIWKHVXEMHFWVWR
the presented stimuli. Steady-state visually evoked potential (SSVEP) is one of the example of these kind of BCI system. The SSVEP based BCI systems detects the changes in brain signal patterns related to flickering of the visual stimuli on which the subject is fixated [7]. The Second approach, ³Active BCI´, relies upon the voluntary cognitive
* Corresponding author. Tel.: +91-8458-222040; fax: +91-8458-222002. E-mail address: [email protected]
activity. This approach usually differentiates between two or more mental states. The imagination of a motor activity
LV FRQVLGHUHG DV D PHQWDO UHKHDUVDO RI PRWRU DFW 7KLV DSSURDFK FRPHV XQGHU WKH µ$FWLYH %&,¶ SDUDGLJP 7KH
imagination of motor activity involves similar brain regions as the physical motor activity [8]. Earlier studies suggest that the motor imagery activity can produce replicable signals over primary sensory and motor areas [9] and it is possible to distinguish between different kinds of motor imagery activities [10]. In the present paper, we examined the EEG patterns related to four types of motor imagery activities. The main purpose of this process was to develop a method based on cross-correlation approach to classify amid four types of motor imagery activities with reasonable accuracy.
2. Proposed method
7KH SURSRVHG PHWKRG LV GHVLJQDWHG DV µFXPXODWLYH VHJPHQWDWLRQ¶ PHWKRG The method contains four stages of data processing (Fig 1). These stages are: First, extraction of EEG signals from native gdf files, Second, Feature Extraction, which includes separating signals epoch wise, calculating statistical features using cross-correlation technique, third, training the classifiers and lastly, validating classification using the K-Fold cross validation.
2.1.Dataset
To verify our approach, we have used the publicly available dataset 2a from BCI competition IV [11]. The dataset was recorded from nine subjects who performed four motor imagery tasks (Left Hand, Right Hand, Both Feet and Tongue). The data collection is divided into short runs where each run contains 48 trials of each of the motor imagery activities. The data was collected in two sessions in two days where session comprises of six runs with a short break between them. So, the data contains total of 288 trials of each motor imagery activity. The EEG data was recorded with 22 Ag/AgCl electrodes arranged in standard 10-20 system around the scalp. The data was sampled at 250 Hz and band pass-filtered between 0.5 Hz to 100 Hz. The amplifier sensitivity was set to 100 μV. An additional 50 Hz notch filter was enabled to suppress line noise. In addition, 3 monopolar Electrooculography (EOG) channels were recorded and also sampled with 250 Hz. They were band pass filtered between 0.5 Hz and 100 Hz (with the 50 Hz notch filter enabled), and the amplifier sensitivity was set to 1 mV. The main reason why EOG channels are provided is for the subsequent application of artifact processing methods [12].
2.2.Basic Noise removal and artifact rejection
The dataset was provided with the list of trials which contains artifacts. These trials were discarded and were not included in the analysis. For basic noise removal, we employed a moving average filter and a band pass filter with a range of 8-40 Hz. TKLV IUHTXHQF\ EDQG FRQWDLQV DOSKD Į DQG EHWDȕ EDQGV ZKLFK DUH XVHG IRU FODVVLILFDWLRQ LQ
motor imagery data. 2.3.Data analysis
In the study performed by [13], they reported that the multichannel EEG signals are interrelated with each other and different signals from different scalp sites do not provide the same amount of discerning information. Based on this, we used cross-correlation technique for the feature extraction. However, as cross-correlation techniques work well in binary mode only (as it depicts the between two signals), we used one verses rest approach for multiclass classification of motor imagery activity. Fig.2 shows the Imagination activity brain maps corresponding to four activities of subject 1 & 2. The reason for variation in maps might be that different might think differently about same activity.
The cross-correlation between two signals is calculated by
ܴ௫௬ሾ݉ሿ ൌ ݔሾ݅ሿݕሾ݅ െ ݉ሿ
ேିȁȁିଵ
݉ ൌ െሺܰ െ ͳሻǡ െሺܰ െ ʹሻǡ ǥ ǥ ǤͲǡͳǡʹǡ͵ǡ ǥ ǥ ሺܰ െ ʹሻǡ ሺܰ െ ͳሻ (1)
Fig.1. Block diagram for data analysis
Fig.2. Imagination activity brain maps corresponding to four activities of subject 1 & 2
Rxy [m] is the cross-correlated sequence with m lag. When two signals, x and y, consists of M finite number of
samples, the resultant cross-correlation sequence has 2M-1 samples. In general, it was reported that the six statistical features mean, median, mode, standard deviation, maximum and minimum are the most valuable factors that symbolise the brain activity for imagination of the motor activity [14]. Thus, these statistical values of cross-correlation sequence were used as features in this study.
The features were extracted from EEG signals using cross-correlation technique by
x Selection of one of the EEG channels (e.g. Fpz) as a reference channel
x Cross-correlate the reference channel with the remaining data channel
x Six statistical features (mean, median, mode, standard deviation, maximum and minimum) are calculated from each cross-correlation sequence so that the dimensions are reduced.
In our dataset, we have 22 channel EEG data with four types of motor imagery activities. As stated earlier, cross-correlation technique works well only in binary mode, so to calculate features and classify between these four motor imagery data, we used one verses rest approach of multiclass classification. This approach is very popular in multiclass classification for its interpretability. As this approach relies on comparing one class against all others, a classifier is trained for each of the classes and to train each classifier, one class is fitted against all the other classes. So, basically we will have multiple smaller classifiers than one big classifier which leads to better computational efficiency.
The classifiers are trained for their respective classes so that, the samples from the same class are treated as positive samples and rest of the samples as negative samples. So, in Fig. 3, for the Model 1, the samples from class A are perceived as positive samples while the samples from classes B, C and D are perceived as negative samples.
Fig.3. One verses Rest Classification approach
As an addition to this approach, for each class we trained five different classifiers, Support Vector Machine (SVM), K-Nearest Neighbours (KNN), Linear Discriminant Analysis (LDA), Naïve Bayes (NB) and Binary Decision Tree (DT) Classifier. The voting approach was used to determine the class designation.
In this approach, we chose the Fp1 as reference channel as there is no specific selection criterion in the Cross Correlation system. The EEG data contains 22 channels. So, in one verses rest approach, one class will have 22 channels while the other class which is basically union of all other classes will have 66 (22x3) channels of data. The reference channel is correlated with the data from the remaining 21 channels of the same class and 21 cross-correlation sequences are obtained for same class. The reference channel is also cross-correlated with remaining 66 channels data of other classes and produces 66 cross-correlation sequences. Thus, a total of 87 cross-correlation sequences were obtained. The results of cross-correlation sequences named as cross-correlograms.
To determine the performance of the classifiers, we used k-fold cross validation technique. Cross validation is a way of measuring the performance of a trained classifier. The statistics of trained classifier (i.e. R2 in Regression) are not a good guide in deciding how a classifier will predict a new set of data. For Example, in a simple polynomial regression, we can just keep adding the higher order terms to get better and better fitting of the data. But, these higher order terms usually make the prediction for the new data worse. This problem is called as over-fitting the classifier.
To resolve this issue, a small part of data (which is not used in training) is used to test the performance of the
FODVVLILHU7KLVVHWRIGDWDFDOOHGµ7HVW6HW¶DQGWKHGDWDXVHGIRUWUDLQLQJWKHFODVVLILHULVFDOOHGµ7UDLQLQJ6HW
Here, we used K-Fold Cross Validation method to determine the performance of the classifier. Given the set of data of size m, The K-Fold Cross Validation proceeds as follows:
x Arrange the data in random order
x Divide the data into k folds ( k chunks of approximately m/k samples each)
x )RUL «N
R Train the classifier using all the samples not belong to Fold i
R Test the classifier on the sample of the Fold i
R Compute the percentage Pi of correctly classified samples
x Return the accuracy of the classifier as:
3.Results
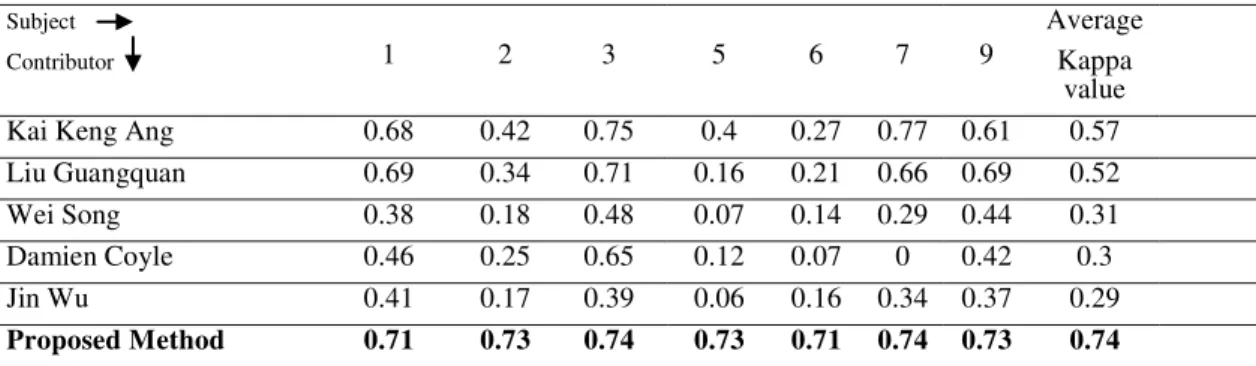
In the present approach, we have employed 6-fold cross validation to estimate the performance of the classifier. From the analysis, though the accuracy values and kappa values were better than the participants of the BCI IV competition, the classifier Naïve Bayes did not converge for two subjects (subject 4 and subject 8) for some reason. So, we omitted the data of these two subjects from the analysis results. On an average, there is 29.82% improvement in kappa value (Table 1) which indicates our method performed better than the winner of the BCI IV competition.
Table 1. Comparison of kappa values for BCI competition IV dataset 2a Subject
Contributor 1 2 3 5 6 7 9
Average Kappa
value Kai Keng Ang 0.68 0.42 0.75 0.4 0.27 0.77 0.61 0.57 Liu Guangquan 0.69 0.34 0.71 0.16 0.21 0.66 0.69 0.52 Wei Song 0.38 0.18 0.48 0.07 0.14 0.29 0.44 0.31 Damien Coyle 0.46 0.25 0.65 0.12 0.07 0 0.42 0.3 Jin Wu 0.41 0.17 0.39 0.06 0.16 0.34 0.37 0.29
Proposed Method 0.71 0.73 0.74 0.73 0.71 0.74 0.73 0.74
Table 2. Comparison of classifiers performance for BCI competition IV dataset 2a Classifier Subject KNN SVM NB LDA DT Voting Method 1 0.76 0.73 0.80 0.75 0.75 0.71 2 0.73 0.69 0.76 0.70 0.80 0.73 3 0.77 0.75 0.75 0.77 0.74 0.74 4 0.77 0.70 0.00 0.72 0.77 0.78 5 0.77 0.72 0.80 0.79 0.73 0.73 6 0.71 0.75 0.77 0.72 0.72 0.71 7 0.70 0.68 0.79 0.68 0.75 0.74 8 0.73 0.76 0.00 0.71 0.72 0.74 9 0.77 0.71 0.75 0.71 0.79 0.73 Average without 4,8 0.75 0.72 0.77 0.73 0.75 0.74 Overall average 0.75 0.72 0.60 0.73 0.75 0.74 4.Conclusion
In this paper, cross-correlation technique with one verses rest approach has been implemented for multiclass classification. In addition, we also employed multiple classifiers (Support Vector Machine (SVM), K-Nearest Neighbours (KNN), Linear Discriminant Analysis (LDA), Naïve Bayes (NB) and Binary Decision Tree (DT) Classifier.) to improve the classification accuracy. While comparing individual performance of classifiers ( not employing voting method), Naïve Bayes classifier performed as best classifier for four subjects (Subject 1, subject 5, subject 6 and subject 7) except for two subjects (Subject2 and subject4) where we got performance as 0 (Table 2).
As a result, we achieved improvement in kappa values (29.82 %) when compared to results achieved by Kai Keng Ang et al [15].
Acknowledgements
The authors would like to thank Dr.Rakesh Sengupta and Mr Jigar Patel for their extended support & suggestions during the preparation of the manuscript.
References
1. Mak, J. N., and Wolpaw, J. R, Clinical applications of brain-computer interfaces: current state and future prospects, IEEE Rev. Biomed. Eng. 2: 187±199, 2009
2. Wolpaw, J. R., Birbaumer, N., McFarland, D. J., Pfurtscheller, G., and Vaughan, T. M, Brain±computer interfaces for communication and control, Clin. Neurophysiol. 113: 767±791, 2002
3. Joseph N Mak, Dennis J McFarland, Theresa M Vaughan, Lynn M McCane, Phillippa Z Tsui, Debra J Zeitlin, Eric W Sellers, and Jonathan R Wolpaw, EEG correlates of p300-based brain-computer interface (BCI) performance in people with amyotrophic lateral sclerosis, Journal of neural engineering 9(2):026014, 2012
4. Lécuyer, A., Lotte, F., Reilly, R. B., Leeb, R., Hirose, M., Slater, M., et al. Brain-computer interfaces, virtual reality, and videogames. IEEE Comput. 41: 66±72, 2008
5. B. Gerstner J Renkens F Millán J, Mouriñoand W, Non-invasive brain actuated control of a mobile robot, IEEE Trans. Biomed. Eng. 51(6):1026±1033, 2003
6. Zander, T. O., and Kothe, C, Towards passive brain±computer interfaces: applying brain±computer interface technology to human± machine systems in general, J. Neural Eng. 8:025005, 2011
7. Cheng, M., Gao, X., Gao, S., and Xu, D, Design and implementation of a brain-computer interface with high transfer rates, IEEE Trans. Biomed. Eng. 49: 1181±1186, 2002
8. M. J. Jeannerod, Mental imagery in the motor context, Neuropsychologia 33(11): 1419±1432, 1995
9. R. Beisteiner, P. Ho¨llinger, G. Lindinger, W. Lang, A. Berthoz, Mental representations of movements. Brain potentials associated with imagination of hand movements, Electroencephalogr. Clin. Neurophysiol. 96: 183 ± 193, 1995
10. G. Pfurtscheller, C. Neuper, D. Flotzinger, M. Pregenzer, EEG-based discrimination between imagination of right and left hand movement, Electroencephalogr. Clin. Neurophysiol. 103 (5): 1 ± 10, 1997
11. BCI Competition IV[Online], Available: http://www.bbci.de/competition/iv/
12. M. Fatourechi, A. Bashashati, R. K. Ward, G. E. Birch, EMG and EOG artifacts in brain computer interface systems: a survey, Clinical Neurophysiology 118: 480±494, 2007
13. J. Meng, G. Liu, G. Huang, and X. Zhu, Automated selecting subset of channels based on CSP in motor imagery brain-computer system, in Proc. 2009 IEEE Int. Conf. Robot. Bioinformat., Guilin, China, 2290±2294, Dec. 19±23, 2009
14. Siuly, S., & Li, Y, Improving the separability of motor imagery EEG signals using a cross correlation-based least square support vector machine for brain±computer interface, Neural Systems and Rehabilitation Engineering, IEEE Transactions on, 20(4): 526-538, 2012 15. K. K. Ang, Z. Y. Chin, H. Zhang, and C. Guan, Filter Bank Common Spatial Pattern (FBCSP) in Brain-Computer Interface, in