Exploring the causes of the poor performance by Grade 12 learners in
Calculus-based tasks
by
REUBEN BAFANA DLAMINI
Submitted in accordance with the requirements
for the degree of
MASTER OF EDUCATION WITH SPECIALISATION IN MATHEMATICS EDUCATION
at the
UNIVERSITY OF SOUTH AFRICA
SUPERVISOR: PROF D BRIJLALL
DECLARATION
I declare that the dissertation titled Exploring the causes of the poor performance by Grade 12 learners in calculus-based tasks is my own work and that all the sources that I have used or quoted have been indicated and acknowledged by means of complete references. I further declare that I have not previously submitted this work, or part of it, for examination at UNISA for another qualification or at any other higher education institution.
_________________ _____________________
ACKNOWLEDGEMENTS
First and foremost, I would like to thank the Almighty God for providing me with energy and strength during what ended being one of the toughest times of my life. It was very difficult to make a balance between my job related duties, family responsibilities and the demands of this research. However, through His never-ending grace and mercy I managed to complete the research.
Conducting the research and writing this project report has been a period of intensive learning for me. The project was so demanding in such a way that I had to get assistance from some people. Therefore, I would like to reflect on the people who have supported and helped me so much throughout this period:
I am heartily thankful to my supervisor Prof. D. Brijlall who tirelessly guided me throughout this research study. His guidance helped me to develop an understanding of the research
I would like to thank Mr S. B. Msezane for the support and encouragement when I started. I also thank you for the counselling you gave me when thought of giving up on my studies
I wish to express my sincere gratitude to the Head of Department of Education in Mpumalanga Province, Mrs M. O. C. Mohlabane for granting me the permission to conduct this research in the three schools that were selected for the study
My special gratitude also goes to the District Director of Gert Sibande Department of Education, Mr P. P. Magagula for endorsing the conducting of this study in his District
I wish to extend my sincere gratitude to the Circuit Manageress of Msukaligwa 1, Mrs E. S. A. Marais, the Principal of Ithafa Comprehensive School, Mr D. R. Mango; the Principal of Reggie Masuku Secondary School, Mr M. S. Mahlambi; and the Principal of Ligbron Academy, Mr D. van Rensburg, for allowing me to conduct this research in their areas.
I would like to thank my colleagues, Mr A. N. Nkambule and Mr D. J. Ncongwame for their support and encouragement they gave me and for being there for me while I was busy with the research.
I am equally grateful to Mrs E. Steyn for editing the language of the final dissertation
I wish to express special thanks to Mr S. S. Gama for assisting in typing this dissertation
I would like to thank my fiancée, Duduzile, for her unending support and love. She was always there when I needed her, and she encouraged me to do my best. When I would lose confidence or was ready to give up, she would motivate me to continue
I wish to thank all my children; Fisiwe, Simangaliso, Sisanda, Okuhle, Sinethemba and Mcebo for being patient and understanding when it looked I have ignored them while I was busy with this research. I thank them for their endless patience when it was most required
Last but not the least; I would like to thank both my late parents, for bringing me to this academic world, raising and supporting me throughout my life
DEDICATION
This study is dedicated to the following people:
My late parents, for raising, supporting and loving me from the day I was born to the day they left this world
All my six children; two girls and four boys for their patience when it looked like I was ignoring them. You are my source of inspiration.
My fiancée Duduzile for her innumerable love and encouragement throughout this research
Both my late uncle and aunt Mr Zachariah Sibhebhu Simelane and Mrs Albertinah Mayovu Simelane for giving me quality secondary school education. This laid a proper foundation for me and enabled me to survive in this world of academics
ABSTRACT
The study attempted to determine the causes of poor performance among Grade 12 learners in tasks involving calculus, especially in cubic graphs and the application of differential calculus. The study was conducted in three schools of the Msukaligwa 1 Circuit in the Gert Sibande District, Mpumalanga Province in South Africa.
Differential calculus is a branch of mathematics that is concerned mainly with the study of the rate of change of functions with respect to their variables especially through the use derivatives and differentials. Students have difficulties in learning and mastering this section of calculus as is revealed by examiners’ and moderators’ reports year after year. The purpose of this study was to investigate the possible reasons for the poor performance by Grade 12 learners in calculus-based tasks, especially in cubic graphs and the application in optimisation.
The study sought to investigate the causes of the poor performance by Grade 12 learners in tasks based on these two subtopics of calculus. Three schools were selected by means of purposive sampling: one former model C, one Mathematics, Science and Technology Academy (MSTA) and one other school that does not fall in either of these two categories. This enabled the study to have participants from diverse backgrounds.
A qualitative research design was used. Data was collected using learners’ scripts for the three formal tasks: May common test, June (midyear) and Trial (preparatory) examinations. Only the questions involving cubic graphs and the application of calculus were part of the study. Analysis was done in order to determine learners’ challenges, common mistakes, and misconceptions, but also of good responses given by learners.
CONTENTS
ABSTRACT ... .vi LIST OF TABLES...xi LIST OF FIGURES...xii TERMINOLOGY ...xvi ACRONYMS...xvi CHAPTER 1 BACKGROUND AND PURPOSE OF THE STUDY ... 11.1 Introduction ... 6
1.2 Rationale of the study ... 7
1.3 Research questions ... 7
1.4 Details of the study ... 7
1.5 Thesis outline ... 8
1.6 Conclusion ... 10
CHAPTER 2 LITERATURE REVIEW AND THEORETICAL FRAMEWORK ... 11
2.1 Introduction...11
2.2 Literature review...11
2.2.1 Mathematics curriculum and performance in other countries ... 11
2.2.2 South Africa’s mathematics curriculum and performance ... 20
2.3 Theoretical framework ... 33
2.3.1 Strands in learning mathematics ... 33
2.3.2 Constructivism as a theory of teaching and learning mathematics ... 38
2.3.3 Singapore Mathematics – The Mathematical Framework ... 43
2.3.4 APOS theory ... 46
2.4 Factors that may cause poor performance in mathematics ... 49
2.4.1 Learners’ attitude ... 54
2.4.2 Textbooks... 56
2.4.3 Technology ... 58
2.5 Calculus... ...60
2.6 Factors that may cause poor performance in calculus ... 67
2.7 Difficulties in calculus...82
2.8 Interventions that may be used to improve performance in mathematics ... 83
2.8.1 Use of questions that promote mathematical thinking ... 86
2.8.2 Counter-examples in assisting learners to understand mathematics ... 89
2.8.3 Importance of errors in correcting misconceptions ... 91
CHAPTER 3
RESEARCH METHODOLOGY AND DESIGN ... 101
3.1 Introduction ...101
3.2 Research approach ... 101
3.3 Research method...102
3.4 Population and sampling ...102
3.5 Data collection techniques ...104
3.6 Trustworthiness of a research study...104
3.6.1 Credibility ...105 3.6.2 Transferability ...105 3.6.3 Dependability ...106 3.6.4 Conformability ...106 3.7 Research ethics ...107 3.8 Conclusion ...108 CHAPTER 4 RESULTS AND DATA ANALYSIS...110
4.1 Introduction ...110
4.2 Question 4 from the May test ...111
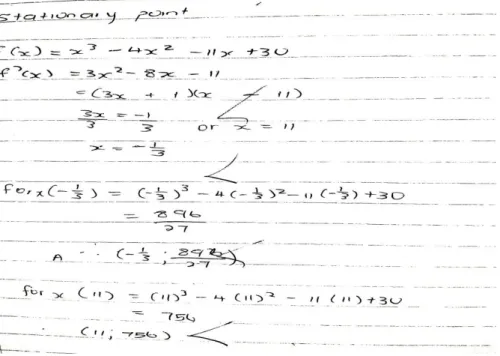
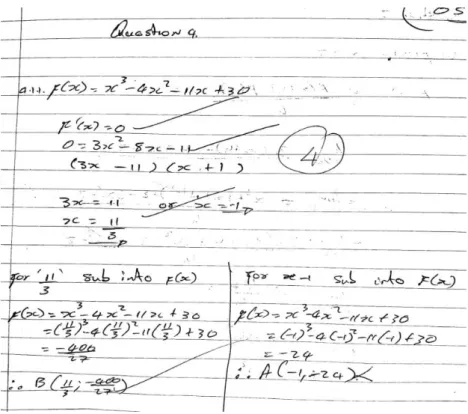
4.2.1 Subquestion 4.1.1 ...111
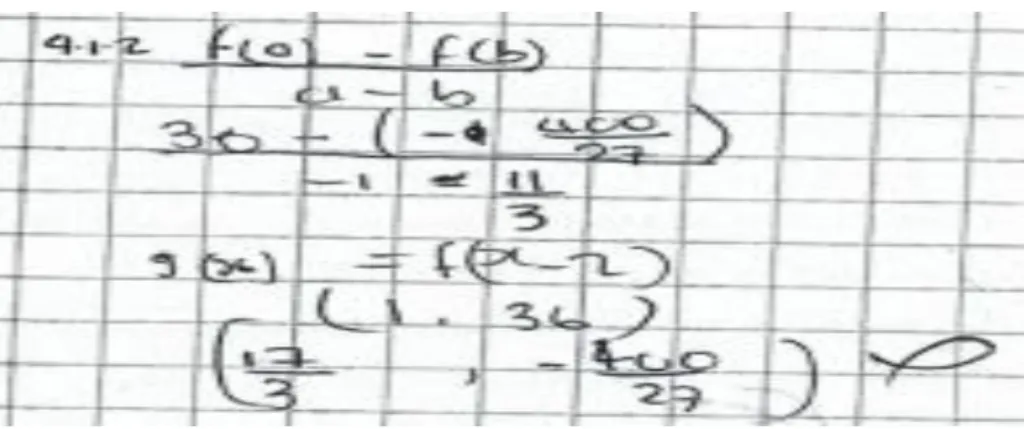
4.2.2 Subquestion 4.1.2 ...120
4.2.3 Subquestion 4.1.3 ...128
4.2.4 Subquestion 4.1.4 ...133
4.3 Questions from the June examination ...135
4.3.1 Subquestion 10.1...137 4.3.2 Subquestion 10.2...138 4.3.3 Subquestion 10.3 ...143 4.3.4 Subquestion 10.4...146 4.3.5 Subquestion 10.5 ...151 4.3.6 Subquestion 11.1...157 4.3.7 Subquestion 11.2 ...162
4.4 Questions from the Trial examination ...167
4.4.1 Subquestion 7.1...168 4.4.2 Subquestion 7.2...172 4.4.3 Subquestion 7.3...177 4.4.4 Subquestion 7.4...180 4.4.5 Subquestion 7.5...182 4.4.6 Subquestion 7.6...184 4.4.7 Subquestion 8.1...187 4.4.8 Subquestion 8.2...189 4.4.9 Subquestion 8.3...190
4.5 Conclusion...196
CHAPTER 5 DISCUSSIONS, RECOMMENDATIONS AND CONCLUSIONS ...198
5.1 Introduction ...198
5.2 Discussion of the results ...198
5.3 Challenges originating from sections of calculus ...200
5.3.1 Deriving a function ...200
5.3.2 Finding a point of inflection ...200
5.3.3 Determining the turning points...202
5.3.4 Substituting in the wrong equations...202
5.3.5 Calculating the equation of a tangent to the curve...202
5.3.6 Interpreting the meaning of a derivative of a cubic and of a quadratic function and sketching them...203
5.3.7 Comprehending the language used in questions involving application optimisation ...203
5.3.8 Procedure for calculating maximum area. ...204
5.4 Poor performance as a result of incompetence in other mathematics topics ...205
5.4.1 Lack of knowledge and skills in algebra...205
5.4.1.1 Demonstrated the lack of factorisation skills...205
5.4.1.2 Could not multiply terms containing surds and exponents ...205
5.4.1.3 Exhibited lack of algebraic manipulation skills ...206
5.4.1.4 Incorrect reasoning...206
5.4.2 Incompetence in functions ...207
5.4.2.1 Failing to sketch the graphs ...207
5.4.2.2 Lack of knowledge to calculate their x-intercepts...207
5.4.2.3 Using wrong notation in coordinates ...208
5.4.2.4 Swapping x- and y-coordinates when sketching graphs of a given function...208
5.4.2.5 Failing to read from the graph the values of k for which x34x211xk 0 will have only one real root...208
5.4.2.6 Failure to read from the graph to determine the value(s) of t for which g(x)=t will have only one real root ...209
5.4.2.7 Lack of knowledge that the constant term of a function is a y-intercept. ...210
5.4.3 Incompetent in mensuration...210
5.4.3.1 Formula for calculating the area of a rectangle ...210
5.4.3.2 Difference between area and volume ...211
5.4.4 Incompetence in inequalities...212
5.4.4.1 Distinguish between < and > ...212
5.4.4.2 State the value(s) of x that satisfy the given inequality ...213
5.5.1 Careless mistakes or slips ...213
5.5.2 Application error ...214
5.5.3. Procedural error ...214
5.5.4. Conceptual error ...214
5.6 Conclusion...215
5.7 Limitations of the study ...218
5.8 Recommendations for future researchers ...218
5.9 Recommendations. ...219
5.9.1 Challenges originating from sections of calculus...219
5.9.2 Challenges caused by incompetence in other mathematical topics ...222
5.9.3 Assessment of other mathematical strands...223
REFERENCES ... 224
APPENDICES...234
Appendix A: Questions used in the May test...…...234
Appendix B: Questions used in the June examination...…...237
Appendix C: Questions used in the Trial examination……….………….240
Appendix D: Letter requesting permission from the Head of Department...…...243
Appendix E: Letter requesting permission from the District Director…...247
Appendix F: Letter requesting permission from the Circuit Manager....………...….251
Appendix G: Letter requesting permission from the school principals………...….256
Appendix H: Parent/guardian consent……….…...…261
Appendix I: Learners’ assent...…... 263
Appendix J: Editing Certificate...265
LIST OF TABLES
Table 1.1 Distribution of high schools by performance in NSC mathematics in 2004 ...3
Table 2.1 Fourth grade performance in mathematics ...12
Table 2.2 Eighth grade performance in mathematics...13
Table 2.3 Complete rankings of smartest countries based on maths and science ...14
Table 2.4 Academics grading in Kenya ...19
Table 2.5 South Africa’s Grade 12 mathematics performance over 4 years ...21
Table 2.6 Comparison of mathematics performance in provinces 2011 - 2015...21
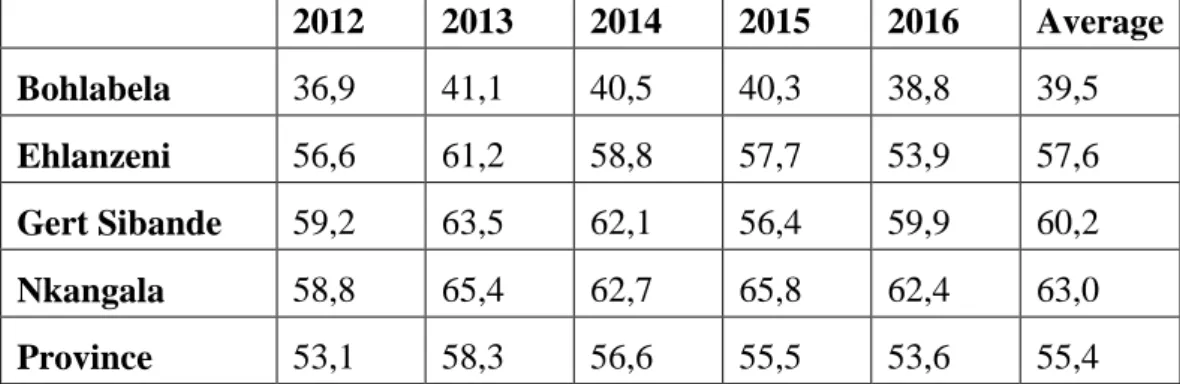
Table 2.7 Comparison of mathematical performance according to the districts...22
Table 2.8 Mathematics % performance by circuit in the past 5 years...23
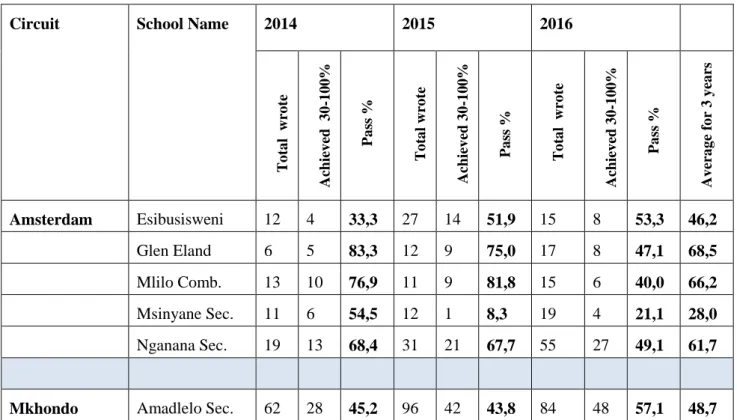
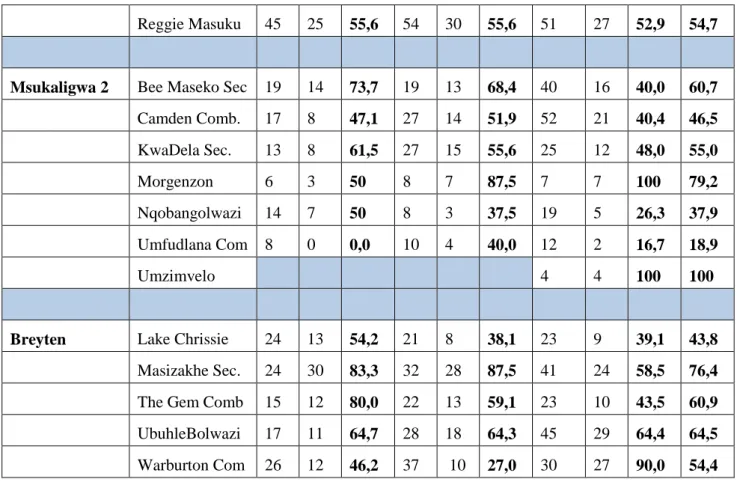
Table 2.9 Three year performance of schools from circuits involved in the study ...25
Table 2.10 Performance in ANA 2012 – 2014 ...28
Table 2.11 Average performance in calculus subtopics...68
Table 2.12 Average percentage performance per question for Paper 1 of 2015 ...68
Table 2.13 Examples of open questions that promote mathematical thinking...88
LIST OF FIGURES
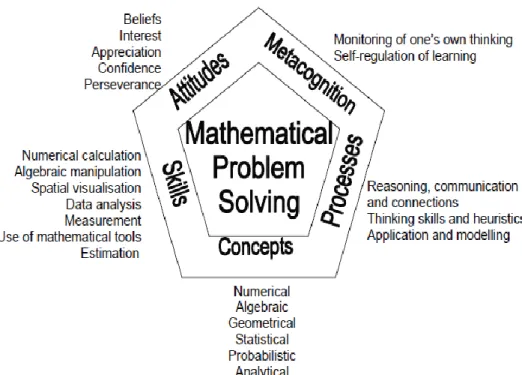
Figure 2.1 The five strands of mathematical proficiency ... 35
Figure 2.2 Singapore Mathematics Framework ... 44
Figure 2.3 Example of a cubic graph ... 59
Figure 2.4 Two main branches of calculus... 61
Figure 2.5 Two circles with the centre of one lying inside the other ... 96
Figure 4.1 Correct response to calculate turning points ... 112
Figure 4.2 Incorrect procedure to calculate a turning point ...113
Figure 4.3 An example of a slip or careless mistake ...113
Figure 4.4 Poor performance due to a lack of factorisation skills/knowledge ...114
Figure 4.5 Another response showing a lack of factorisation skill...115
Figure 4.6 A conceptual error...115
Figure 4.7 Candidate’s response that shows uncertainty ...116
Figure 4.8 Response showing a slip and incorrect notation ...117
Figure 4.9 Loss of marks due to a slip ...118
Figure 4.10 Partially incorrect response due to calculation error ...119
Figure 4.11 Wrong substitution ...119
Figure 4.12 Correct response to calculate a point of inflection ...120
Figure 4.13 An alternative method to find a point of inflection ...121
Figure 4.14 Candidate’s response showing the wrong calculation of the second derivative...121
Figure 4.15 Lack of knowledge to find the point of inflection...122
Figure 4.16 Another incorrect response in finding point of inflection ...122
Figure 4.17 Incomplete response to find the point of inflection ...123
Figure 4.18 Candidate’s response that went beyond the answer ...123
Figure 4.19 Application error ...124
Figure 4.20 Incorrect procedure in calculating point of inflection ...125
Figure 4.21 An example of a slip that led to a loss of marks ...125
Figure 4.22 Another response showing a slip or careless mistake ...126
Figure 4.23 A response showing a lack of algebraic manipulation skills ...126
Figure 4.24a: Response to question 4.1.1 ...127
Figure 4.24b: Response to question 4.1.2 ...128
Figure 4.25 A response showing lack of knowledge of finding an equation of a tangent ...129
Figure 4.27 Application error ...130
Figure 4.28 A response showing a lack of knowledge of how to find a derivative ...130
Figure 4.29 Incorrect response to calculate an equation of a tangent to a curve ...130
Figure 4.30 An error in substitution ...131
Figure 4.31 Wrong equation used to find the equation of a tangent ...131
Figure 4.32 Incorrect procedure to find the equation of a tangent to a curve ...132
Figure 4.33 Application of a formula in a wrong question ...133
Figure 4.34 Candidate’s incorrect response to question 4.1.4 ...134
Figure 4.35 Mistake in an inequality sign led to loss of marks ...134
Figure 4.36 Candidate’s response to question 4.1.4 ...134
Figure 4.37 Candidate’s correct response to question 4.1.4 ...135
Figure 4.38 Candidate who got the answer from the graph ...137
Figure 4.39 Candidate who obtained the answer by making some calculations ...137
Figure 4.40 Wrong notation for writing a constant term of a function ...138
Figure 4.41 Incorrect response to question 10.1 ...138
Figure 4.42 Candidate’s correct response to calculate turning points ...139
Figure 4.43 Alternative method to answer question 10.2 ...140
Figure 4.44 A slip or careless mistake caused loss of marks...140
Figure 4.45 Another slip that resulted in the loss of a mark ...141
Figure 4.46 Candidate’s response indicated that the use of variable c caused a problem…...142
Figure 4.47 A response showing no proficiency in adaptive reasoning ...142
Figure 4.48 Candidate lacking knowledge of how to derive ...143
Figure 4.49 Lack of calculation or calculator skills led to loss of a mark...143
Figure 4.50 Correct response to question 10.3...144
Figure 4.51 Applying wrong procedure to a wrong question...144
Figure 4.52 Not proficient in conceptual understanding and procedural fluency ...145
Figure 4.53 Candidate that was not proficient in adaptive reasoning ...145
Figure 4.54 Another response indicating a lack of conceptual understanding ...146
Figure 4.55 Not competent in finding the equation of the tangent to the curve ...146
Figure 4.56 Incorrect response caused by application error ...147
Figure 4.57 Wrong procedure and therefore not competent ...148
Figure 4.58 Candidate applied zero factor property incorrectly ...148
Figure 4.60 Lack of knowledge and procedures in solving equations ...150
Figure 4.61 Application of a quadratic formula in a non-quadratic equation ...150
Figure 4.62 A correct response to question 10.4 ...151
Figure 4.63 A correct response to question 10.5 ...152
Figure 4.64 Response showing all essential points ...153
Figure 4.65 A response showing a lack of knowledge of sketching a graph ...154
Figure 4.66 Incompetence in sketching graphs ...155
Figure 4.67 A response that was partially competent ...156
Figure 4.68 Lack of skill in plotting points...156
Figure 4.69 Candidate’s correct response...158
Figure 4.70 A response that could have earned a mark if it had been in question 11.2 ...158
Figure 4.71 Wrong substitution ...159
Figure 4.72 Incomplete working to earn full marks ...160
Figure 4.73 Incorrect procedure to derive a function ...161
Figure 4.74 Lack of knowledge of how to derive ...161
Figure 4.75 Another example of incompetence in deriving a function...162
Figure 4.76 A candidate’s correct response...163
Figure 4.77 A response showing the common error of substituting in L instead of L...164
Figure 4.78 Another incorrect response caused by wrong substitution...164
Figure 4.79 Not proficient in conceptual understanding and procedural fluency...165
Figure 4.80 Incorrect responses to question 11.1 and 11.2 ...166
Figure 4.81 Lack of knowledge of how to derive ...166
Figure 4.82 Correct response to question 7.1 ...169
Figure 4.83 Loss of a mark due to the use of a wrong method ...170
Figure 4.84 Response showing unnecessary working ...170
Figure 4.85 A straightforward response illustrating competence ...171
Figure 4.86 A candidate who swapped x- and y-coordinates ...171
Figure 4.87 A candidate who mistook a turning point for an x-intercept ...172
Figure 4.88 A correct response to question 7.2 ...173
Figure 4.89 Incorrect notation for representing coordinates ...174
Figure 4.90 A mistake in using a calculator ...175
Figure 4.91 Another response showing an error in using a calculator ...175
Figure 4.94 A slip in the writing of a sign resulted in the loss of marks ...177
Figure 4.95 Correct response to question 7.3 ...177
Figure 4.96 Correct response written without much calculation ...178
Figure 4.97 Omitting or skipping some information caused loss of marks ...178
Figure 4.98 Incorrect response resulting from not reading all the supplied information ...179
Figure 4.99 A response showing that the candidate overlooked given information ...180
Figure 4.100 An extract showing a correct response to question 7.4 ...181
Figure 4.101 An alternative method for finding the x-coordinate of the point of inflection ...181
Figure 4.102 A slip or careless mistake contributed to the loss of marks ...182
Figure 4.103 Correct response to question 7.5 ...183
Figure 4.104 A response with the correct values of t but incorrect inequality signs ...183
Figure 4.105 A response with only one correct solution ...183
Figure 4.106 A candidate used variable x instead of t ...184
Figure 4.107 Correct response to question 7.6 ...184
Figure 4.108 Candidate’s lack of knowledge of inequality signs ...185
Figure 4.109 A response with one correct solution and the other one incomplete ...185
Figure 4.110 A setup that could have given correct solution if f(x) had been correct ...186
Figure 4.111 An accepted proof that was awarded full marks ...188
Figure 4.112 A mark for showing that angle B=60° ...188
Figure 4.113 An extract showing that not any angle of 60° earned a mark ...188
Figure 4.114 A correct response to question 8.2 ...189
Figure 4.115 A candidate who did not know the formula for the area of a rectangle ...190
Figure 4.116 Lack of knowledge of the formula for the area of a rectangle ...190
Figure 4.117 A correct response to question 8.3 ...191
Figure 4.118 Lack of multiplication skills evident in this extract ...192
Figure 4.119 Not proficient in the procedural fluency strand...193
Figure 4.120 Not competent in procedures for calculating the maximum and minimum quantities in calculus...193
Figure 4.121 Incomplete response to question 8.3...194
Figure 4.122 A diagram for question 8...194
Figure 4.123 A candidate who could not multiply surds and powers...195
Figure 4.124 Incompetent in multiplying and deriving terms with surds and exponents...195
TERMINOLOGY
APOS Theory A theory begins with the hypothesis that mathematical proficiency consists in an individual’s tendency to deal with perceived mathematical problem situations by constructing mental actions, processes and objects and organising them in schemas that make sense of the situations and solve the problems
Constructivism A theory that says people construct their own understanding of the world, through experiencing things and reflecting on those experiences.
Differential calculus A branch of mathematics concerned with the determination, properties and application of derivatives and differentials
Mathematical proficiency
High skills or expertise in mathematics
Optimisation Getting a maximum or minimum value of a function
ACRONYMS
CAPS Curriculum Assessment Policy Statement DBE Department of Basic Education
FET Further Education and Training
MSTA Mathematics, Science and Technology Academy NCS National Curriculum Statement
NSC National Senior Certificate SBA School Based Assessment
CHAPTER 1
INTRODUCTION
1.1 BACKGROUND AND PURPOSE OF STUDY
This chapter gives an overview of this research project study. The background and purpose of this study is mentioned here. The rationale or logical basis for doing this research, the significance of this study, the purpose of the study and the dynamic context within which the study take place are explained in this chapter. The research questions and details of the study are discussed here. This is followed by summaries of upcoming chapters (thesis outline).
Mathematics is one of the core curriculum subjects taught in all schools in South Africa, from Grade R to Grade 9. In Grade 10 learners may choose between Mathematics and Mathematical Literacy. Generally, learning mathematics is not fun for the majority of learners as they find it difficult to master. This is because the mathematics curriculum contains specialised knowledge which requires analytical and logical thinking. As a result, a large number of learners choose to take Mathematical Literacy instead of Mathematics.
There is a worldwide concern about learners’ poor performance in mathematics. In addition, mathematics is generally considered as the most important school subject all over the world. This may be due to the fact that it integrates with many subjects at school level, such as physical science, technology, accounting and technical subjects.
International studies have shown that South Africa has the poorest performance when compared to other middle-income countries and low-income African countries that participated in cross-national assessments of educational achievement, especially in mathematics (Centre for Development and Enterprise [CDE], 2013). The performance of learners in mathematics is poor when compared to other subjects. Almost every year when the Grade 12 results are announced, the overall performance in mathematics is the lowest in relation to other subjects.
The academic performance of Grade 12 learners in South Africa has become a yardstick for measuring our education system. At the same time these academic performances are used as a
standard to determine which learners qualify to further their studies at tertiary institutions. The major problem is that most tertiary institutions require a good mark in mathematics as an entry requirement for a career in engineering, medicine, accounting, technology and other fields that involve science.
Mathematics is a channel to various fields of study. In order to have many opportunities or choices of fields of study, learners have to do mathematics while at school. Without mathematics career options will be limited. For a career in science, learners have to pass mathematics in Grade 12 and achieve at least at level 5. Therefore there is a need to improve learners’ performance in mathematics so that the number of learners who will pursue careers that regard mathematics as a prerequisite may be increased. Despite its importance, it is said that mathematics was used to deprive other races of the chance to pursue careers in fields that require mathematics. Feza (2013) says mathematics education is one of the subjects used during apartheid in South Africa to exclude blacks from careers in science, technology and engineering.
In South Africa, every year when the matric (Grade 12) results are announced, they usually show that learners performed poorly in mathematics when compared to other subjects. Former Model C (white) schools also appear to obtain good results when compared to many black schools. These former white schools obtain good results in all subjects, including mathematics. However, there are fewer former Model C schools as compared to black schools. This means very few learners succeed in getting good results in mathematics because the total number of learners produced by these former white schools is smaller than the number of learners from black schools.
The differences in terms of performance is said to be caused by many factors such as resources and others which are related to socio-economic conditions. It remains a fact that the former white schools were better resourced than other schools during the apartheid era. However, the impact of resources on learners’ performance does not depend on their availability at a school, but on how they are used to enhance teaching and learning. For example, the Mpumalanga Department of Education has provided its high schools with DVDs to help learners during revision. It is surprising that in some schools these DVDs are safely stored in the principal’s office or kept by the head of department (subject head).
In the Mpumalanga Province, secondary schools have been classified into two categories based on their performance in the Grade 12 final examination: those at 70% and below and those above 70%. A school is defined as a performing school if it has obtained an overall performance of above 70% in the National Senior Certificate examinations.
Schools’ underperformance that exists now in the time of a curriculum called Curriculum and Assessment Policy Statement (CAPS), has been going on even before the introduction of the curriculum called National Curriculum Statement (NCS). The first Grade 12 paper under NCS was written in 2008 while the first for CAPS was written in 2013. Table 1.1 shows the relative performance of South African schools in 2004. From the table it can be seen that about 80% of South African schools are underperforming in National Senior Certificate (NSC) mathematics. It must be remembered that prior to 2008 Grade 12 examination papers were set at two levels, namely standard grade (SG) and higher grade (HG). Top achievers would register for higher grade while weaker ones registered for standard grade papers. Table 1.1 also shows that the underperforming schools contributed only 15% of HG passes in mathematics. It is amazing that the country’s top performing secondary schools (which make up 7% of the total schools) produced 66% of HG passes.
Table 1.1: Distribution of high schools by performance in NSC mathematics in 2004 (Simkins 2005 in Taylor 2008) Privileged* schools African schools Subtotal Proportion of total Prop of HG math passes Top performing 380 34 414 7% 66% Moderately performing 254 573 827 14% 19% Poor performing 600 4 277 4 877 79% 15% Total 1 234 4 884 6 118
* Under apartheid these schools were administered by the House of Assembly (for whites), House of Representatives (‘coloured’) or House of Delegates (Asian); they were relatively more privileged than those for Africans, with white schools significantly more privileged than those for any other group.
When the setting of two different papers (SG and HG) was abolished, Mathematical Literacy was introduced to Grade 10 learners in 2006. The low achieving students in Mathematics were channelled to take this subject. In South Africa, it is compulsory that a learner take either Mathematics or Mathematical Literacy as required by the National Senior Certificate, meaning that a learner has to make a choice between the two. At first, the performance in Mathematical Literacy was promising. However, recently the pass rate has dropped. More learners are registering for Mathematical Literacy as compared to Mathematics. Unfortunately, not all universities recognised Mathematical Literacy as an entry requirement. Even those that do recognise it, require a good pass. For example, where the pass level required for Mathematics is level 4, they will require a pass level of 5 or more for Mathematical Literacy. It remains to be seen whether South Africa will continue with the present situation or go back to the previous situation of having two papers of different cognitive levels, a standard and a higher grade paper.
The poor learner performance in mathematics is a worldwide concern. Many Departments and Ministries of Education globally have put more effort and funds in the improvement of learners’ performance in the subject. South Africa is not an exception. The Department of Basic Education has been trying hard to come out with strategies that will assist in improving the performance of learners in mathematics. One strategy, for example, was the Dinaledi Schools Project. (Dinaledi is a Sotho word for ‘stars’). This is an initiative that provided focused support to learners and teachers of mathematics and science at selected high schools. This project focused on four areas: learners, teachers, development of the learning environment, and teacher education and development. The Dinaledi Schools Project did not yield good results and as a result the Department of Basic Education has introduced another initiative in which a certain school may become a Mathematics, Science and Technology Academy (MSTA). These MSTA schools have been given resources aimed at improving their results in these three subjects.
It is still early to make any judgement about the success or failure of the MSTA strategy. The Department of Education has tried hard to improve the results in mathematics and science, but all the effort done has not yielded the expected results. According to the South African Non-Government Organisation Network (SANGONET) many interventions have been done which are aimed at improving mathematics performance in underperforming schools.
However, the schools continue to perform poorly as revealed by the matric results every year (SANGONET 2011).
Hoffmeester (2015) quotes the vice-principal of Research and Innovation and professor of Mathematics at the University of South Africa, Mamokgethi Phakeng, saying there is a concern in South Africa about the state of mathematics education. The poor performance by learners in mathematics has negative consequences for the development of the country. She made uttered these remarks at the launching of Tshwane-Gauteng Region Maths and Science Teacher Strategy on 31 January 2015. She said unless South Africa increases the quality and quantity of learners who can be the country’s future engineers, scientists and technical specialists, South Africa’s vision for a sustainable democracy will not be realised or achieved. In her address she mentioned that although South Africa has one of the best school mathematics curriculums in the world, the major challenge faced by the country is the ability to implement it. We cannot find proper solutions unless we know the causes of poor performance in mathematics (Naidu-Hoffmeester 2015).
The performance of learners in mathematics varies from topic to topic. There are topics in which learners continue to perform poorly and at the same time there are topics where they perform well. Generally, the overall performance in mathematics is poor. The mathematics curriculum for Further Education and Training (FET) in South Africa consists of ten main topics, namely algebra; number patterns, sequence and series; functions; finance, growth and decay; differential calculus; statistics; probability; trigonometry; Euclidean geometry and measurement, and finally analytical geometry (Department of Basic Education 2011).
One of the mathematics topics in which learners continue to perform poorly is calculus. In South Africa calculus is introduced in Grade 12. Only differential calculus is taught in this grade. The other subtopic, integral calculus, is introduced at tertiary level. The overall calculus content taught in Grade 12 includes an intuitive understanding of the concept of a limit, differentiation of specified functions from first principles, use of the specified rules of differentiation, the equations of tangents to graphs, the ability to sketch graphs of cubic functions, practical problems involving optimisation and rates of change including the calculus of motion (Department of Basic Education 2011).
Calculus is important to many students at tertiary level because of its widespread use in science, engineering, economics, business, medicine, industry and many other fields to understand and apply the concept of change and motion. It is well known that despite the importance of calculus many learners fail to master it. These learners find that calculus is very hard and abstract. They do not see its use in real-life situations. They find themselves in a situation where they are compelled to learn it to pass the examination. In order to pass the examination, students need to memorise formulae and procedures that have been taught in the classroom. The task or problems presented during lessons do not have any meaning for them.
The section on sketching the graphs of cubic functions and practical problems involving optimisation and rates of change, including the calculus of motion, seem to present the South African Grade 12 learners with the greatest challenges. Each year, when the Mpumalanga Department of Education makes the Grade 12 results analysis in Mathematics per topic, it is found that the poorest performance always occurs in cubic graphs and the application of differential calculus. This research will attempt to determine the causes of this poor performance and ways how learners can be assisted to improve their performance.
According to the reports made by the Mpumalanga moderators on the 2011 NSC Grade 12 examination in Mathematics, candidates performed very poorly in cubic graphs and the application of calculus (Mpumalanga Department of Education, 2012). The average performance of sampled scripts was 11,4% in cubic graphs and 7,6% in the application of calculus. The poor performance in these two topics occurred again in the 2012 final examination. The average learner performance in cubic graphs was 24, 96% and 13, 65% in the application of calculus (Mpumalanga Department of Education, 2013).
1.2 RATIONALE OF THE STUDY
The purpose of the study was to investigate the causes of the poor performance by Grade 12 learners in mathematics topics, namely cubic graphs and the application of differential calculus, in the Gert Sibande District, Mpumalanga. The poor performance by learners in Mathematics has made it necessary to investigate the factors that contribute to poor achievement in Mathematics. The study attempted to reveal reasons for the poor performance and then looked at possible interventions that would alleviate the situation. This will be done
An improvement in mathematics results can be achieved if the factors that cause poor performance in certain topics can be identified and proper intervention strategies implemented. Improving mathematics results may mean that more learners will qualify for entering university programmes that require a mathematics background. Therefore there is a need to investigate the causes of the poor performance in calculus-based tasks in order to propose programmes or strategies that may assist in reducing the failure rate in calculus, especially in cubic graphs and the application of differential calculus. Improvements that can be made in each topic of mathematics may result in an improved learner performance.
It is hoped that that the information gathered in this study will be able to identify the major causes of the poor performance in cubic graphs and the application of differential calculus. Once these are identified, possible strategies to alleviate the challenges will be recommended that will assist both teachers and learners in improving the teaching and learning of the two sections of calculus.
1.3 RESEARCH QUESTIONS
In order to explore the causes of poor performance by Grade 12 learners in calculus-based tasks, the following research questions were developed:
What are the causes of the poor performance in calculus (cubic graphs and the application of differential calculus)?
What common errors are made by learners when trying to work out these sections of calculus?
1.4 DETAILS OF THE STUDY
In this study the researcher was interested in determining the possible factors that cause poor performance in calculus-based tasks, especially in the sections that involve cubic graphs and the application of differential calculus. In recent years it has been found that learners achieved low marks in these two subsections of calculus. In other words, this study was necessitated by the continual poor performance in cubic graphs and the application of optimisation.
At present, the Department of Basic Education is attempting to improve learners’ performance in mathematics throughout the country. The significance of this study will be its contribution in improving learners’ performance in cubic graphs and the application of differential calculus, both of which are subtopics of calculus. Learners, teachers and the Department of Education will benefit from this research since the research aims at determining the causes of the poor performance in these sections of calculus, and at the same time at assisting in developing ways that can be used by teachers to improve their teaching methods. If teachers can know exactly what it is that learners are not doing right or what the learners’ common errors and misconceptions are when answering questions on calculus, they will be in a better position to develop relevant interventions that may be used to rectify the situation and thus improve the performance in mathematics.
The study was conducted in three schools from three different categories of schools. The three categories were former model C school, a Mathematics, Science and Technology Academy (MSTA), and one other school not belonging to either of these two categories. It was conducted in the three schools of Msukaligwa 1 Circuit, in the Gert Sibande District in the Mpumalanga Province. Msukaligwa 1 was chosen in order to retrieve data from different categories of schools.. In this Circuit there are former model C schools, MSTA and schools that do not belong to either category. This allowed the researcher to obtain data from learners from different backgrounds and settings. In fact, Msukaligwa 1 is the only circuit of the Ermelo sub-district that can provide two schools in each of the three categories mentioned. Three schools were eventually involved in the study.
Learners’ scripts for formal tasks that involved questions on calculus, especially cubic graphs and the application of calculus, were used to analyse learners’ responses. The formal tasks used were the Grade 12 May test, the June (midyear) examination and the Trial (Preparatory) examinations.
1.5 THESIS OUTLINE
This outline shows how the research report is divided or arranged and what the content of each chapter is.
Chapter 1: Introduction and background
This chapter consists of the overview of the study. It indicates the background, purpose and significance of the study. In other words, it is a clear explanation of what the study was about, why it had to be undertaken and who would benefit from it. The researcher introduces the problem, states the rationale of the study, gives the details of the study and states the research question.
Chapter 2: Literature review
In this chapter the conceptual framework guiding the study and a review of some related literature are presented. It covers all the sources that have a link to the problem being investigated. In other words, the connection between existing knowledge and the research problem being investigated is covered.
Chapter 3: Research design and data collection
Chapter 3 describes the procedures for conducting the study. The researcher indicates how the research was set up, what happened to the subjects/participants, and what methods of data collection were used. In short, the research design explains in full the procedures of conducting the study, including when, from whom and under what conditions the data was collected.
The chapter focuses on the methods used in the study including the research design, sample selection method, data collection and procedures, data analysis methods and ethical issues of the study.
Chapter 4: Discussion of results and data analysis
The chapter indicates how the collected data was organised and analysed. The chapter also explains how the data is presented in the report. The discussion includes an evaluation and interpretation of the findings.
Conclusions about the findings of the study and possible recommendations are made in this chapter. Ways and strategies of improving the study are listed in this section. Recommendations made will have to be realistic, achievable and as specific as possible, and will have to assist future researchers on the topic to effect improvement.
Possible factors that may be a hindrance in achieving the desired outcomes of the study are included in this chapter. The challenges or limitations may be a result of factors such as time, response from participants or the wrong method of sampling the population to be studied.
1.6 CONCLUSION
In this chapter the orientation of the study is established. The study is put into context. The problem issue on which the study is based, the objective of the study and the significance of the study are discussed here. It is hoped that once the study is completed it will give results that will bring about an improvement in the teaching and learning of mathematics, in particular the sections of calculus covered in this study.
The next chapter deals with the literature that was reviewed for this study. Chapter 2 gives in detail the complete picture of previous studies conducted by other researchers on work relevant to this study.
CHAPTER 2
LITERATURE REVIEW AND THEORETICAL FRAMEWORK
2.1 INTRODUCTION
In this chapter the literature relevant to the study is reviewed, namely on performance in mathematics. Other topics discussed in this chapter are mathematical proficiency, constructivism, APOS theory, Singapore Mathematics and factors causing challenges in mathematics, in particular calculus.
2.2 LITERATURE REVIEW
Mathematics is a prerequisite for learners who wish to pursue a career in fields such as engineering, medicine and accounting. Despite its being an important subject, learners continue to perform below expectations in mathematics (Tachie & Chireshe 2013). Very few learners achieve good marks in mathematics. This means that only a small number of learners meet the university entrance requirements to pursue their studies in fields that require good marks in mathematics.
2.2.1. Mathematics curriculum and performance in other countries
Many countries have made great progress in the teaching and learning of mathematics, while others are still performing poorly. Countries like Singapore, Japan and the Netherlands are doing well in mathematics; it is therefore necessary for this study to look at curriculum transformations made and good practices introduced by these performing countries.
East Asian countries continue to lead the world regarding achievement in mathematics. Singapore, South Korea, Hong Kong, Taiwan and Japan were the top five performers in Trends in International Mathematics and Science Study (TIMSS) 2011 in the fourth grade. The eighth grade top five performers in descending order were South Korea, Singapore, Taiwan, Hong Kong and Japan (TIMSS 2011).
Table 2.1 shows the distribution of student achievement for participants in the TIMSS 1995– 2011 fourth grade assessment, including the average scale score. Fifty-two (52) countries took part in the TIMSS 2011 assessment in the fourth grade and forty-five (45) in the eighth grade. None of the African countries managed a position in the top ten in either of the two grades. From Table 2.1, it can be seen that the fourth-grade learners performed well with more than six countries having average achievement above the High International Benchmark of 550.
Table 2.1 Fourth-grade performance in mathematics
TIMSS 1995 TIMSS 2003 TIMSS 2007 TIMSS 2011
Singapore 625 Singapore 594 Hong Kong 607 Singapore 606 South Korea 611 Hong Kong 575 Singapore 599 South Korea 605 Japan 597 Japan 565 Taiwan 576 Hong Kong 602 Hong Kong 587 Taiwan 564 Japan 568 Taiwan 591 Netherlands 577 Belgium 551 Kazakhstan 549 Japan 585 Czech Rep. 567 Netherlands 540 Russia 544 N. Ireland 562 Austria 559 Latvia 536 England 541 Belgium 549 Slovenia 552 Lithuania 534 Latvia 537 Finland 545 Ireland 550 Russia 532 Netherlands 535 England 542 Hungary 548 England 531 Lithuania 530 Russia 542 (Source: TIMSS 2011)
There is a trend in the performance of grade four and eight learners. As in the fourth grade assessment, the Asian countries took the top five spots in the grade eight performance. Table 2.2 shows the distribution of student achievement for participants in the TIMSS 1995–2011 eighth grade assessment.
The results of the eighth grade showed South Korea, Singapore and Taiwan to be the top achievers. They were followed by Hong Kong and Japan. Also, countries like Russia, Israel, Finland, the United States and England managed to be in the top ten countries in 2011.
It can be seen from Table 2.2 that the top five spots were occupied by the Asian countries from the TIMSS 1995–2011. South Korea, Singapore, Taiwan, Hong Kong and Japan had the highest average achievement in eighth grade mathematics. None of these top five countries obtained an average score below 570 in the TIMMS 1995–2011.
Table 2.2 Eighth grade performance in mathematics
(Source: TIMSS 2011)
From the last TIMSS results, the TIMSS 2011, it can be seen that Singapore, South Korea, Taiwan, Hong Kong and Japan are the five countries with the highest average mathematics achievement at fourth and eighth grade, with an average achievement above the High International Benchmark of 550 in each case. This means learners from these Asian countries excelled in mathematics in the two grades, when compared to the other countries in the world. It can be also seen from Table 2.1 and Table 2.2 that no African country occupied the top ten positions in terms of learners’ performance in mathematics. This means African countries are performing poorly in mathematics.
In his article titled “The 10 smartest countries based on math and science” Speiser (2015) gives the 2015 Organization for Economic Cooperation and Development (OECD) rankings based on test scores for 76 countries. The 2015 test scores were based on knowledge of
TIMSS 1995 TIMSS 1999 TIMSS 2003 TIMSS 2007 TIMSS 2011
Singapore 643 Singapore 604 Singapore 605 Taiwan 598 South Korea 613 S. Korea 607 S. Korea 587 S. Korea 589 S. Korea 597 Singapore 611 Japan 605 Taiwan 585 Hong Kong 586 Singapore 593 Taiwan 609 Hong Kong 588 Hong Kong 582 Taiwan 585 Hong Kong 572 Hong Kong 586 Flanders 565 Japan 579 Japan 570 Japan 570 Japan 570 Czech Rep 564 Flanders 558 Flanders 537 Hungary 517 Russia 539 Slovakia 547 Netherlands 540 Netherlands 536 England 513 Israel 516 Switzerland 545 Slovakia 534 Estonia 531 Russia 512 Finland 514 Netherlands 541 Hungary 532 Hungary 529 US. 508 US 509 Slovenia 541 Canada 531 Malaysia 508 Lithuania 506 England 507
mathematics and science among 15-year-old learners. Table 2.3 shows the rankings of the 76 countries involved in the study.
Table 2.3 Complete rankings of smartest countries based on math and science
1. Singapore 20. United Kingdom 39. Israel 58. Lebanon 2. Hong Kong 21. Czech Republic 40. Greece 59. Georgia
3. South Korea 22. Denmark 41. Turkey 60. Brazil
4. Japan (tie) 23. France 42. Serbia 61. Jordan
4. Taiwan (tie) 24. Latvia 43. Bulgaria 62. Argentina
6. Finland 25. Norway 44. Romania 63. Albania
7. Estonia 26. Luxembourg 45. UAE 64. Tunisia
8. Switzerland 27. Spain 46. Cyprus 65. Macedonia 9. Netherlands 28. Italy (tie) 47. Thailand 66. Saudi Arabia 10. Canada 28. United States (tie) 48. Chile 67. Colombia
11. Poland 30. Portugal 49. Kazakhstan 68. Qatar
12. Vietnam 31. Lithuania 50. Armenia 69. Indonesia
13. Germany 32. Hungary 51. Iran 70. Botswana
14. Australia 33. Iceland 52. Malaysia 71. Peru
15. Ireland 34. Russia 53. Costa Rica 72. Oman
16. Belgium 35. Sweden 54. Mexico 73. Morocco
17. New Zealand 36. Croatia 55. Uruguay 74. Honduras 18. Slovenia 37. Slovak Republic 56. Montenegro 75. South Africa
19. Austria 38. Ukraine 57. Bahrain 76. Ghana
(Source: Speiser 2015)
Again, from Table 2.3, it can be seen that African countries were among the bottom rankings, with South Africa and Ghana occupying the last two positions respectively. Most of the European countries filled the top half of the rankings. Finland in the sixth spot was the top performer among the European countries. The US and Italy were tied in 28th position.
Frand (2008) points out that after 1993, Singapore ranked number one in the world and has continued to hold the top or second place for more than 20 years. Unfortunately, the US continues to rank low. Singapore is said to have improved in mathematics results because it had to undergo many changes in the teaching and learning of mathematics. That is to say the mathematics content was not changed, but what had to be changed was the philosophy about what has to be emphasised and the pedagogy about how the content is taught. The factors that make Singapore Math such a strong curriculum are listed below. Note that Singapore Math is the name given to the mathematics curriculum developed in Singapore. Singapore Math is said to be now used in many schools and districts in the US. Frand (2008) lists the developments that made Math Singapore successful as follows:
Singapore Math emphasises the development of strong number sense, excellent mental-math skills and a deep understanding of place value.
The curriculum is based on progression from concrete experience, use of manipulatives, use of pictures, and finally to the abstract level or algorithm. This sequence gives students a solid understanding of basic mathematical concepts and relationships before they start working at the abstract level.
Singapore Math includes a strong emphasis on model drawing, a visual approach to solving word problems that helps students organise information and solve problems in a step-by-step manner.
Concepts are taught to mastery, then later revisited but not re-taught. It is said that the US curriculum is a mile wide and an inch deep, whereas Singapore’s math curriculum is just the opposite.
The Singapore approach focuses on developing students who are problem solvers (Frand 2008).
Again, it is necessary for this study to look at what is done by those countries performing well in mathematics against activities done in the USA. From Tables 2.1 and 2.2, Singapore, Japan and the Netherlands are in the top ten positions and therefore a short comparison of these three countries with the United States had to be made in order to see what it is that the USA is not doing right. A comparison was made with regard to the following aspects: anxiety on students’ performance, textbooks, curriculum, tuition time, and culture and parental involvement.
(a) Anxiety and students’ performance
According to Abuja (2006) research studies have revealed that a dislike of or anxiety towards mathematics has an effect on mathematics performance. These studies have shown that Singapore students’ dislike for mathematics is much lower than that of their counterparts in the USA. This may explain why Singapore performed better than the USA in the TIMSS. It has been suggested that in order to develop a positive attitude towards learning mathematics, children need to be shown from an early age that mathematics can be fun (Abuja 2006).
(b) Textbooks
Textbooks play an important role in preparing learners to understand mathematics, especially while in the lower grades. In the article “Mathematics in the school curriculum: an international perspective” Ruddock (1989) points out that in counties like Japan and Singapore textbooks are either produced or have to be approved by national or local Education Ministries. On the other hand, in the Netherlands there is no system for the official approval of textbooks. In the USA, 21 out of the 50 states have to obtain approval from the local Ministry of Education. In countries or states where approval is needed, this involves checking that the prescribed curriculum is being followed. Japan uses a Textbook Authorisation and Research Council to recommend textbooks to the Minister of Education. The council comprises school teachers, university lecturers and Ministry officials.
In Singapore, textbooks must adhere to the syllabus, give comprehensive coverage of the topics in the syllabus, adopt a clear and logical presentation of concepts and offer activities to enhance the learning experiences of pupils. In the USA, states that use recommended textbooks have a state textbook adoption programme.
Teachers in Singapore work from a centralised curriculum and books that are prepared by the Curriculum Division of the Ministry of Education. Every textbook has accompanying workbooks, especially at the elementary and middle school levels, all prepared and published by the Curriculum Division. These books are very well presented and include numerous examples for the teachers to use.
(c) Curriculum
In Singapore, problem solving is the central theme of the curriculum. Concepts are taught to an extent that students master them. The revision of past examination papers and the use of the problem-solving approach cause Singapore to perform better in international studies. The curriculum is based on progression from concrete experience to a pictorial stage and finally to the abstract level or algorithm.
In the Netherlands, the Realistic Mathematics Education (RME) curriculum is mainly driven by context. This curriculum says mathematics must be connected to reality and at the same time taken as a human activity. So the real-life contexts are used as starting points. Gravemeijer & Doorman (1999) said that the role of context problems used to be limited to the applications that would be addressed at the end of a learning sequence.
In the Netherlands, Singapore and Japan, the curriculum is not wide but it is very deep in terms of concepts. Topics from the elementary grades are not repeated. This means these countries teach fewer content areas in any given year than.
According to Cogan and Schmidt (1999), the mathematics curriculum in the USA covers many topics as compared with other countries that performed well in TIMMS. They say having few topics helps learners to master the content as compared to learners who have to cover more work. In their article “What we’ve learned from the TIMSS” Cogan and Schmidt (1999) explain that in the USA teachers are expected to teach and students to learn more mathematics topics every year in the first eight grades than do the vast majority of other TIMSS countries. They say, for example, in grades 5 to 8, the USA expects between 27 and 32 topics to be taught each year. This far exceeds the international median for each of these grades (21-23 topics per year) and contrasts sharply with the 20-21 topics intended by the highest achieving TIMSS countries.
(d) Tuition time
Mastrull (2002) said time spent by learners on schoolwork seems to have an impact on success in mathematics achievement. She said that success of Japanese students in mathematics does not mean that they are smarter than American students or other students
elsewhere in the world, they just work harder. American students attend school an average of 178 days per year as compared to 200 days in Japan. Japanese students go to school Monday to Saturday, with Saturday a half day (Mastrull 2002).
(e) Culture and parental involvement
The culture of teaching in Japan involves a full partnership with the family. Teachers are to some extent accountable for their students’ behaviour and well-being both inside and outside of official school hours. Mastrull (2002) points out that Japanese parents, especially mothers, take an active role in their children’s education. She said few Japanese women have jobs and once they get married, their primary measure of success becomes the education of their children. This means that their children get more support from them in terms of their education or school work
Although the USA has adopted some of the strategies of Singapore Math, they have applied them differently from what is done in Singapore (Frand 2008). It is rare that one will find a classroom in the USA applying all the strategies of Singapore Math.
African countries perform poorly in mathematics when compared to most of the Asian and European countries. This is shown by Table 2.3. A number of reasons for the poor performance have been given. A study by Mbugua, Ribet, Muthaa and Nkonke (2012) tried to investigate the factors that contribute to students’ poor performance in mathematics in Kenya. Factors that were found to contribute to poor performance included teachers’ workload, overloaded syllabus, parent/guardian level of education and cultural factors. For example, the study revealed that students who come from unsecure environments caused by socio-cultural practices such as cattle rustling, early marriages and female genital mutilation (FMG) show emotional problems at school. They lack concentration in class (Mbugua et al. 2012).
Another important study was done by Sila (2014) in Kenyan schools. The study investigated the factors that influence students’ academic performance in mathematics in secondary schools in the Kathonzweni district in Kenya. The findings of this study showed that students’ performance in mathematics in the Kenya Certificate of Secondary Education
schools that took part in the study had obtained a grade or symbol better than D in any of the five years under study (Sila 2014).
In order to have a better understanding of the performance of the five schools used in the study, it will be necessary to consider Table 2.4, which gives the grading system of Kenya. By using the grading system from Table 2.4, it can be seen that the learners from the five secondary schools failed to get a percentage mark of more than 44 percent during the five years under study.
Table 2.4 Academics grading in Kenya
Percent % 0 – 29 30 – 34 35 – 39 40 – 44 45 – 49 50 – 54 55 – 59 60 – 64 65 – 69 70 – 74 75 – 79 80 – 100 Grade E D- D D+ C- C C+ B- B B+ A- A Points 1 2 3 4 5 6 7 8 9 10 11 12
Source: Wikipedia (Academics grading in Kenya)
Like other African states, Nigeria also experiences a poor performance of learners in mathematics. According to Avong (2013) concerns for the high rate of failure in public examinations in Nigeria have led to a number of studies conducted in search of causes of this poor performance. These studies are said to have paid more attention to identifying factors responsible for the high rates of failure among others: students’ negative attitude to the subject, a lack of qualified teachers, the inadequacy of teachers, a lack of the necessary learning skills, the specialised language of the subject and inadequate and unsuitable textbooks (Avong 2013).
A study conducted by Avong has shown that the shortage of qualified teachers, inadequate resource materials for teaching, poor teaching methods, a lack of motivation of students by teachers and the attitudes of teachers and students towards teaching and learning mathematics greatly affect students’ performance. However, this study found that mathematics anxiety was not as important a factor in the poor performance in mathematics as was generally believed (Avong 2013).
Different researchers have come up with different reasons that cause learners to perform poorly in mathematics. Kukogho (2015) quotes Professor Mohamed Ibrahim (Professor of Mathematics and President of the Mathematical Association of Nigeria) saying that the poor performance in mathematics in Nigeria has been caused by poorly trained teachers. Ibrahim has been quoted saying that students have developed “mathematical phobia”, which results in fear and failure. According to Ibrahim the dislike of mathematics is linked to teachers’ methodology. He also said most teachers in Nigeria cannot use modern technology, such as computers, which are now commonly used in advanced countries. In these countries learners are exposed to computer techniques right from primary school.
Kukogho (2015) also cites Ibrahim saying that the training gap has been minimised by workshops organised by the Mathematical Association of Nigeria (MAN). MAN organises workshops from time to time to show teachers the latest techniques on how they can teach effectively from primary school to tertiary level.
In addition, Ibrahim has proposed that the Nigerian government introduce incentives like bursaries to create interest in mathematics. A special bursary for students that show a love for mathematics must be introduced. In the case of teachers, government must give them mathematics allowances (Kukogho 2015).
2.2.2. South Africa’s mathematics curriculum and performance
In South Africa learners’ performance in mathematics is generally poor even though learners are considered to have passed mathematics if they obtain 30%. Table 2.5 shows the performance in mathematics of South Africa’s Grade 12 learners in the past four years, from 2012 to 2015. One can see that there was a slight improvement from 2012 to 2013. The performance dropped again in 2014 and 2015. The table also shows that the overall pass rate in the past four years (2012 to 2015) has never exceeded 60%. The situation would have been worse if the pass mark had been 40% because the pass rate would not have exceeded 41% for the past four years.
Table 2.5 South Africa’s Grade 12 mathematics performance over 4 years Year No. of candidates that wrote maths Achieving at 30% or above % at 30% and above Achieving at 40% or above % at 40% and above 2012 225 874 121970 54,0 80 716 35,7 2013 241 509 142666 59,1 97 790 40,5 2014 225 458 170535 53,5 79 050 35,1 2015 263 903 129481 49,1 84 297 31,9
(Source: Department of Basic Education: 2016)
Since this study was to be conducted in the Mpumalanga Province, it was necessary to compare the performance of Mpumalanga in mathematics in relation to other provinces. The results of the South African National Study in mathematics and science revealed that there was a difference in performance among the provinces (Siyepu 2013). The table compares the performances of South Africa’s provinces over the past six years.
It appears that there was a steady increase from 2011 to 2013, but afterwards there was a decline from 2014 to 2016. Most provinces improved performance from 2015 to 2016 with the exception of Mpumalanga and Gauteng. Mpumalanga had the greatest decline of 1,9% in 2016, unlike Gauteng, which that had a decline of 0,9%.
Table 2.6: Comparison of mathematics performance in provinces: 2011 – 2015
(Source: Mpumalanga Department of Education, 2017)
Year EC FS GP KZN LIM MP NW NC WC National 2011 33,5 53,9 61,3 39,5 44,5 46,2 53,4 50,5 68,7 46,3 2012 38,1 64,8 71,0 48,1 52,4 53,1 59,6 54,9 73,5 54,0 2013 43,3 71,1 73,6 53,6 59,3 58,3 67,4 57,7 73,3 59,1 2014 42,0 65,8 69,3 40,7 56,9 56,6 61,7 63,4 73,9 53,1 2015 37,3 69,1 69,6 33,2 52,1 55,5 59,6 57,0 74,9 49,1 2016 37,5 71,3 68,7 37,9 53,9 53,6 62,7 60,7 77,2 51,1