The Effects of Competition on the Fee Structures of the Major
Stock Exchanges
Giuseppina Chesini
This paper investigates whether, as a result of competition, certain explicit transaction costs (execution fees) paid by broker-dealers to execute client orders on trading platforms are effectively decreasing, and considers the implications for stock exchanges and equity markets. It aims to integrate the literature on trading costs in equity markets by focusing on qualitative aspects and their specific relevance to the assessment of securities market quality, considering that in a high quality market, transaction costs are low. Changes in the price lists of the major European stock exchanges and multilateral trading facilities (MTFs) are examined to highlight the main pricing policy trends. In line with the prevailing literature, trading fees paid by brokers on these platforms are compared. The decrease in execution fees has coincided with a fall in trading revenues; lower revenues may undermine the profitability and long term stability of stock exchanges, and have a negative impact on equity market quality. It emerges that stock exchanges are progressively diversifying their business, increasing other sources of income to compensate for the loss of trading revenues.The findings relate largely to the period 2008 – first half 2012.
JEL Codes
:
G15, G18, M211. Introduction
Two factors are changing the nature of equity trading in Europe, and at the same time raising doubts over both the quality and the technical and operational efficiency of equity markets. The first is more intense competition, both among trading venues and between trading venues and intermediaries; the second is the increasingly significant role of technology in trading processes. Fiercer competition has primarily been the result of regulation, particularly the rules imposed by the Market in Financial Instruments Directive (MiFID), that has fostered the emergence of new trading venues, multilateral trading facilities (MTFs) and systematic internalisers (SIs), that operate alongside traditional, regulated markets. The impact of intensified competition on stock exchange trading volumes and trading venue price lists is relevant to the present research. The second factor, technology, is also significant in so far as the algorithms used by high-frequency traders (HFTs) have changed the operating procedures underlying the execution of orders. Whilst advances in technology represent a natural evolution of the marketi, they have a major impact on market quality.
In the light of the dramatically changing face of equity trading, this paper aims to verify whether there has been a decrease in execution fees and to assess the effects on stock exchange profitability and equity market quality. In order to do so, it is necessary to first consider the structure and composition of execution fees, and changes relating to the different pricing policies of stock exchanges.
Prof. Giuseppina Chesini, Department of Business Administration, University of Verona, Italy. Email: [email protected]
101
The paper is original because it offers three distinctive contributions that go beyond the current literature, and presents some interesting new findings. First, it focuses on current developments in trading on European equity markets, describing determinants and new areas of research; second, it gives an unique description of the main trends in stock exchange pricing policies by examining changes in price lists; and third, it adopts a price comparison methodology, widely used in the literature, to a sample of major European stock exchanges.
This paper is organised as follows: after a review of the literature, the third section describes the explicit cost components of trading services across major European trading venues, highlighting pricing policy trends; the fourth section presents a comparison of trading fees charged to brokers operating on different trading platforms. The concluding section discusses results and key findings.
2.
Literature Review
In terms of transaction costs, the literature has long highlighted the relationship between automation, volatility, liquidity, efficiency and the cost of trading (Domowitz & Steil 1999; Domowitz , Glen & Madhavan 2001). Many studies have also compared transaction costs on traditional trading venues with those of the most innovative alternative trading systems (Barclay, Hendershott & McCormick 2003; Fink, Fink & Weston 2006). Another line of research has investigated what constitutes an optimal market design for stock exchanges and which specific design features reduce execution costs in particular market environments (Aitken et al. 2009).
Estimation of trading costs depends on the relative size and heterogeneity of the various cost componentsii. In general, transaction costs are divided into explicit costs and implicit costs (Harris 2003, p. 421). Explicit costs are clearly identifiable and easily measurable, and include commissions, fees and spreads. The most important component of explicit costs is brokerage commissions, or fees charged by broker-dealers for trading services, calculated in basis points (bps)..These include the cost that brokers incur to post customer orders on a trading venue, i.e. the return to the trading venue. As explained below, some trading venues require payment only for orders that take liquidity away from trading platforms (aggressive orders). Another key component is spread cost, a cost that compensates traders for providing liquidity: the width of the spread is indicative of the liquidity of the security. On the other hand, implicit costs are more difficult to quantify, not being directly observable, yet they often have a large impact on overall costs. Implicit costs can be broken down into market impact, price trending, timing risk and opportunity costs (Wagner & Edwards 1993; Johnson 2010, pp. 47-51 and pp. 161-187).
Several studies reported a rapid drop in brokerage commissions in all six main areas of the world from 2006 to 2008 (Pagano 2009 a). In particular, empirical analysis conducted by MS Pagano in 2009 showed a worldwide decline in transaction costs following a sharp fall in brokerage commissions in United States (Pagano 2009b). Although this should not surprise us, in view of ever-closer links between markets and increasingly high capital mobility, Pagano also reported that indirect one-way transaction costs, the implicit costs related to market impact and to delays in order execution, reached a minimum value of approximately 2 bps. Indeed, despite considerable geographical differences in trading costs, implicit trading costs seem to have converged towards a base of about 2 bps per trade. Pagano also noted that movements in overall trading costs were strongly correlated with movements in transaction costs on US equity markets. This suggests that US market
102
costs play a leadership role in driving changes in transaction costs in international equity markets that have now become more sensitive to global competition for order flows. Accordingly, global investors appear increasingly sensitive to transaction costs; other conditions being equal, they send orders to markets where the costs are lowest.
In a European context, a seminal work by Alemanni, Lusignani and Onado (2006) evaluated explicit trading costs on major European stock exchanges, highlighting the impact of competition. The authors also underlined how analyses of this kind tend to use two basic approaches: top-down and bottom-up. The top-down approach calculates total commissions paid by brokers-dealers on each trading platform, and divides this amount by the number of executed trades. Though it has the advantage of using objective data and requiring no special assumptions on the use of trading services, the top-down approach may be misleading since it takes into account a number of heterogeneous factors, such as market structures, trading systems and methods used in calculating volumes. This makes comparison between stock exchanges problematic, since data are affected by structural differences between markets and the diverse composition of price lists (Write 2005).The bottom-up approach is more traditional and static, and analyzes trading costs from a microeconomic perspective. To generate comparable results, it relies on assumptions about the characteristics of clients and the types of transaction.
Also in a European context, Oxera published in 2007 a methodologically rigorous study of transaction costs across eighteen financial centres in Europe commissioned by the European Union. In 2009, the same author produced a second survey that used a specific dataset for the years 2006 and 2008, collected with the assistance of intermediaries (fund managers, brokers and custodians) and market infrastructures (trading platforms, CCPs and CSDs) (Oxera 2009) The latter survey reported a substantial reduction of average trading fees, from 1.18 Euros to 0.79 Euros. A more recent survey found that in 2009 trading costs decreased further to 0.47 euros on averageiii (Oxera 2011).
Finally, a number of studies have shown a continuous decrease in transaction costs from 2006 to 2009. Major changes in the European scenario since 2010 call for fresh investigation of at least two significant aspects. Firstly, to what extent have the changes in market microstructure described above had a negative impact on market quality in terms of liquidity and transaction costs? In fact, a relevant part of transaction costs is determined by so-called implicit trading costs that are driven by a market's liquidity. Since liquidity is subject to strong positive network externalities, market venues are eager to attract as much interest in trading as possible. It is useful to remember that before the introduction of MiFID, stock trading took place mainly on the market where a given stock was listed (Petrella 2010), so it was easy to assess market quality in terms of liquidity for a given security. Today, owing to fragmentation, stock trading is distributed across multiple trading venues and market quality has become more difficult to measure (Harris 2010).
In terms of fragmentation, several studies on US financial markets have already shown that fragmentation of trading does not diminish market quality in terms of liquidity. Furthermore, fragmentation appears to reduce effective spreads and increase execution speeds (O’Hara & Ye 2010). The US markets, however, benefit from certain infrastructures, such as consolidated tape, that do not exist in Europe. In this context, more recent research has presented empirical evidence that market fragmentation in Europe has led to higher quality in terms of market liquidity and to a lower cost of capital for the issuers (Gomber, Gsell & Lutat 2011). Furthermore, owing to the effects of automated trading, the most significant example of which is high frequency trading (HFT),
103
market quality has become less evident. Some studies have found that high frequency trading leveled out price differences between trading venues and provides valuable liquidity to markets. The activities of HFT firms have been credited with reducing bid-ask spreads, thereby making markets more efficient for all involved (SEC 2010). Despite this research, both fragmentation and HFT may well have an ambiguous impact on market efficiency and quality and also on price volatility (Schwartz 2010). As a result, these are now issues of specific interest to scholars and regulators (SEC 2010; CESR 2010).
In a very complex and rapidly evolving context, this paper offers an original contribution by addressing the research question with a methodology that differs from previous studies. Rather than elaborating data obtained directly from financial intermediaries and market infrastructures, we make extensive use of public data (trading venue pricelists and stock exchange balance sheets) to describe the main pricing policies and to evaluate the impact of decreasing fees on the annual reports of stock exchanges.
3. First Research Method: Analysis of Changes in Fee Structures due to
Competition
Analysis of trading service price lists has become easier in recent years thanks to the full implementation of the EU Code of Conduct for Clearing and Settlement Services, drafted by the three main European industry associations to improve price transparency and freedom of choice for traders (EACH, ECSDA & FESE 2006). Before starting the analysis, it is necessary to make a preliminary distinction between the price lists of stock exchanges and those of MTFs, the latter having greatly exploited the price element to gain market share. Starting with stock exchanges, let us consider the fees charged for the execution of orders relating to equity securities in cash markets. These consist, commonly and variously, of two main components:
- fixed fees that may in some cases be of the initial one-off type, or, more commonly, ongoing (annual) membership fees. In addition, fees are charged for technical connections to the stock exchange on an annual or monthly basis that include IT connections and in some cases information and data distribution services; the main component of these fees is usually the connectivity charge, which is greatly influenced by the number and speed of links to the trading platform;
- variable fees proportional to the volume of transactions.
Ultimately, the amount of fixed fees and methods for calculating variable fees are the two elements that differentiate stock exchange trading fee packages: trading platforms do not usually charge flat rates regardless of platform usage intensity and nor do they offer solutions based solely on effective use of trading services (pay per use). Note also that some stock exchanges offer more than one trading fee package, with different combinations of fixed and variable components.
Let us now proceed to analyze the main changes in fee structures due to competition. The sample analyzed included the following stock exchanges: London Stock Exchange (LSE), Borsa Italiana, Deutsche Boerse, NYSE Euronext, Nasdaq OMX, Swiss Exchange and Bolsa Y Mercados Españoles (BME).
The first aspect to consider is membership fees. Among the sample stock exchanges, only Bolsa Y Mercados Españoles (BME) requires an entry fee (initial fee) in the form of a €100,000 one-off payment to operate on the Spanish markets. Conversely, NYSE
104
Euronext does not charge membership fees, while the Italian Stock Exchange and Deutsche Boerse charge €15,000 a year. In addition, certain exchanges charge membership fees proportionate to the size of broker-dealer operations. In particular, LSE used to base fees on the number of employees until 2011, when it introduced a single fee of £12,500 for all trading fees; BME fees are a function of trading volumes executed in the previous year.
Moving on to variable fees, transaction fees (the amount due for a single transaction) often consist of a fixed trading fee for the execution of a single order and an ad-valorem, variable trading fee based on the value traded. So variable fees paid by broker-dealers are often a function of both the number and the value of trades. Sometimes the transaction component includes a minimum activity charge (MAC), payable by a broker-dealer with respect to a specific period, if variable trading fees amount to less than the minimum value. Even if MACs are not strictly speaking fixed costs, they put a floor on variable costs and affect the flexibility of individual fee packages. For example, the Italian Stock Exchange makes use of an MAC in pricing model 1.
Further examination of Borsa Italiana and Deutsche Boerse price lists highlights that both exchanges reduce the unit fees as the number of trades increases, while unit fees tend to increase as the value of single trades increases. The latter feature is also seen in the price list of BME. On the other hand, NYSE Euronext used to base fee calculations on the type of broker-dealer operation, distinguishing the principal from the agent, though in the latest versions of its fee schedule this distinction has been abandoned. Conversely, LSE’s pricing structure used to be based on the capitalization of the stock being traded; this distinction has also been abandoned. So following MiFID, the trend has been towards simplification in the calculation of trading fees.
Having analyzed the principal features of fee structures for execution services, let us now examine three factors that characterized developments in the trading service price lists of the main European stock exchanges from 2008 to 2010:
1. the abolition of order management fees;
2.the diversion of orders by stock exchanges from regulated markets to their MTFs, with no additional costs for the broker-dealer but rather a system of incentive pricing;
3.the introduction, by some stock exchanges, of price lists based on the maker-taker pricing model, used mainly by MTFs.
Firstly, as regards the abolition of order management fees, note that until a few years ago price lists differentiated between order execution and order management, with specific fees for order-entry, order-cancellation and order modification fees. For example, until 2008 LSE used this type of fees extensively. Fierce competition among different trading platforms has led to the abolition of management fees to attract the largest number of orders and liquidity. As a result, high-usage fees have been introduced to remunerate platforms where the broker-dealers use the trading platform intensively without final order execution.
Secondly, stock exchanges operating both traditional regulated markets and various types of MTFs (with price discovery and dark pools) are able to trade across different platforms, providing broker-dealers with rebates on some trading platforms for operations on other platforms managed by the exchange. The first stock exchange to adopt this strategy in Europe was NYSE Euronext; from 1st April 2009, it introduced a pricing structure that gave a fee reduction to customers operating both on its regulated markets and its MTF. In
105
practice, customers of NYSE Euronext, through a single connection could send orders simultaneously to the various trading platforms (regulated markets, lit MTFs and dark pools) in a simple way and at a discounted price. In particular, by routing orders to NYSE Arca Europe (a MTF), broker-dealers were entitled to a special tariff - bridge fees - for operations on regulated markets. Consequently, the more a broker-dealer operated on NYSE Arca Europe, the more they benefited from discounts on operations on NYSE Euronext regulated markets. Ultimately, this innovative pricing structure made the volume of trading on NYSE Arca Europe a sort of ‘bridge’ to discounts on trades conducted on regulated markets. The bridge fees varied according to whether the operator acted passively (liquidity maker) or aggressively (liquidity takers) on NYSE Arca Europe. Before introducing the new pricing model, NYSE Euronext had estimated the benefit to its customers of an overall reduction of 20% of trading fees. This pricing innovation was replaced not long after by simpler fees.
Thirdly, the maker-taker pricing model is a pricing structure whereby firms that provide liquidity to the trading platform are rewarded with a rebate, instead of a fee. The model provides an incentive structure that helped MTFs to accrue the crucial seed liquidity necessary to gain traction quickly. This model was initially introduced in the US stock market in the late nineties, when Electronic Communications Networks (ECNs) began to compete with the US stock exchanges (Stoll 2006). In particular, the need to divert the abundant liquidity of the big stock exchanges that were poorly responsive to market changes urged ECNs to attract orders to their trading platforms by offering a maker-taker pricing model (Angel, Harris & Spatt 2010). Given the success of major ECNs - such as BATS Trading that diverted a large number of trades from the NYSE - their European counterparts immediately embraced the maker-taker pricing model.
Even the most traditional European stock market - LSE - decided to introduce the maker-taker pricing structure to defend its market share. In September 2008, LSE introduced a rebate for broker-dealers routing passive orders, effectively introducing this model on its regulated market. The fact that a such traditional stock exchange implemented the pricing structure previously adopted by the new MTFs shows that this pricing model, far from being a marketing strategy pursued by new entrants, is one of the pillars of pricing developments in post MiFID stock markets. However, the pricing model adopted by LSE was not able to prevent orders flowing away from its regulated markets, and in September 2009 the LSE returned to the traditional model with no distinction between aggressive and passive orders.
In general, the maker-taker pricing model has increased price competition among European trading platforms. In particular, the maker-taker pricing structure introduced by one MTF, Chi-X, has remained unchanged since its creation. Other MTFs have adopted less static pricing policies. For example, on 1st June 2009, BATS Europe and NASDAQ OMX Europe announced the launch of a new pricing model, limited to the trading of listed shares in the three regulated markets of Euronext (Paris, Amsterdam and Brussels), where competition was and is particularly fierce. Specifically, the NASDAQ OMX Europe pricing model, for the specified securities only, generated equal amounts of fees and rebates, thus eliminating the beneficial impact of such fees on the operating results of the MTF. According to the BATS Europe price list, even broker-dealers who sent liquidity increasing orders received a discount of 0.50 bps (instead of 0.18), while those that decreased liquidity paid 0.28 bps. This has even resulted in a reversal of the maker-taker model, for certain securities, assuming that the MTF operated at a loss to gain market share.
106
The aggressiveness of the pricing policies discussed above attracted the interest of the Committee of European Securities Regulators (CESR) which, in April 2010, invited operators to comment on six points designed to assess trading operations following the implementation of MiFID. The fourth point specifically concerned trading platform fee structuresiv; CESR posed a number of questions concerning the impact and the negative aspects of the maker-taker pricing model. Overall, the operational environment of the European stock exchanges became increasingly competitive after MiFID, and pricing policies became crucial because, among other things, trading volumes were decreasing as a result of the financial crisis.
Finally, during the period from 2011 to 2012, a number of new pricing policies emerged even though the pricing of execution services remained one of the key elements used to curb the migration of trades. The following must be highlighted:
1. the new MTFs have developed different pricing strategies: the pan-European approach used by early entrants (Chi-X, Bats Europe and Turquoise) contrasts with the niche-focused approach of venues that entered the market more recently, such as Burgundy. 2. following this more focused pricing strategy, new short term price campaigns have been designed to subtract market shares from incumbent stock exchanges.
3. some stock exchanges, including LSE and Deutsche Boerse, have recently introduced rebates or waivers to new members who connect to their platforms, usually for a period of twelve months.
4. in the first months of 2012 a number of European stock exchanges, including NASDAQ OMX, Borsa Italiana and Deutsche Boerse announced new tariffs designed to curb the excessive message traffic that drives high frequency trading strategies.
Firstly, in terms of new pricing strategies, new trading platforms tend to operate differentiated fee schemes tailored to specific market environments. For example, Burgundy’s pricing structure is focused to attract flows of orders for specific shares and its price list is very detailed and completely different from those of its predecessors. Equiduct, an MTF that recently become a regulated market in Germany, has adopted a similar pricing structure.
Secondly, in terms of specific price campaigns, Chi-X Europe used a price strategy in 2011 to open up Spanish equity markets to the competition introduced by MiFID across Europe. Until then all European markets had improved in terms of quality of trading and execution fees, except Spain. The Spanish market had remained almost entirely dominated by Bolsas y Mercados Españoles (BME) that maintained 98% of on-exchange trading in Spanish stocks. Before 2011, Chi-X Europe had had limited success in Spain; competition and beneficial cuts to the cost of trading had not yet kicked in. Chi-X Europe decided to launch a three-month price promotion in six blue-chip Spanish stocks (constituents of the Euro Stoxx 50 index) by slashing its fees from October 1st 2011 to break the dominance of the incumbent exchange. Orders in these six stocks became free of clearing and settlement fees once clients had traded €200m in stocks in a single month. Furthermore, the rebate for posting passive orders (that add liquidity) increased from 0.2 to 0.3 basis points. The charge for aggressive orders (that remove liquidity) remained at 0.3 basis points. At the beginning of 2012 Bats Chi-X Europe, the entity resulting from the merger of the two MTFs, extended the three-month price promotion on the six Spanish blue-chips until the end of March. Following the same strategy, NYSE Euronext has also sought to challenge the Spanish exchanges with a fee promotion through its pan-European trading platform, NYSE Arca Europe. The latter launched a new initiative from the beginning of June 2012v; in addition also Turquoise introduced a Spanish stocks
107
promotion, applicable to the most liquid Spanish instruments, starting from September 2012.
Thirdly, to attract new members, some stock exchanges have recently introduced rebates or waivers, usually for a period of twelve months, to new members who connect to their platforms. For example, Deutsche Boerse offered a fee waiver to new members connecting to its electronic trading system Xetra until the end of 2012, for a period of twelve months from the month of registration.
Fourthly, in terms of new tariffs, in recent years the main European stock exchanges have courted high-frequency order flows through price policies in a bid to bolster their share of secondary market trading. Exchanges have been interested in HFT not only to prop up their flagging market share; HFT flows also bring additional revenues through co-location, the practice whereby a broker locates its server in the exchange’s data centre to gain a speed advantage and access to other technology services. But the creation of this industry segment has come at a price. High-volume data-intensive HFT strategies – which can involve sending a hundred orders to execute one trade due to the need to continuously update prices - represent a major technical challenge. Exchanges effectively opened the floodgate to HFT on account of competition issues, but HFT’s success in attracting flow is putting considerable strain on technology. Increasingly, exchanges have to update to stay ahead, but the economics of these investments are questionable. Ultimately, exchanges only get paid if an order is executed, so the huge volume of message data created by HFT is a massive deadweight on the system. All this explains why stock exchanges operating this type of pricing policy have recently shifted their focus towards retail investors and traditional buy-side operators, both of whom choose increasingly to trade away from regulated markets, instead of continuing to lure high frequency traders.
Finally, it must be highlighted that the most successful European MTFs, BATS Chi-X Europe and Turquoise, announced the introduction of data market fees in the first half of 2012. It is evident that, by charging such low fees, MTFs have not yet produced sufficient profits to guarantee their long-term survival. In May 2012 BATS Chi-X Europe announced the introduction of charges for market data according to data usage and choice of service, starting from the following October; Turquoise is also poised to implement a fee structure for its market data, charging professional users and private investors separate fees for level 1 and level 2 data respectively, with effect from November 2012.
4. Second Research Method: Comparison of Trading Fees Charged to
Brokers
Analysis of trading venue price lists in the last few years offers insight into the pricing policies that stock exchanges have implemented in the face of tougher competition. In this section the fees that broker-dealers incur in using the various trading platforms, commonly called execution fees, are quantified and compared. In particular, in the light of decreasing fees in the price lists of the major trading venues in Europe, the hypotheses to be verified were:
1. is the impact of lower fees on stock exchange revenues relevant? 2. are fees lower on platforms where there is more competition?
3. could lower revenues have an impact on the ability of stock exchanges to develop their role in financial markets?
108
As mentioned in the literature review, the cost of trading can be assessed mainly through one of two approaches: bottom-up or top-down. The bottom up approach involves designing profiles for a number of different users and applying these to the pricing lists of all the platforms considered, to obtain an estimate of the total charges that each user pays on each trading platform. This standard approach is also called the “user-profile” approach, since it allows the costs of services to be estimated when they depend on the profile of the user; the disadvantage is that it can provide cost estimates for specific user profiles only, but not necessarily for an average user. In particular, due to the high degree of variation in the actual profiles of brokers and investors, this approach does not allow the entire industry to be capturedvi. In the user–profile method, costs can vary for two reasons: differences in prices and differences in the way brokers and investors use infrastructure providers. By using this methodology, the profile is kept the same across all financial centres, so that differences in costs are due only to differences in prices.
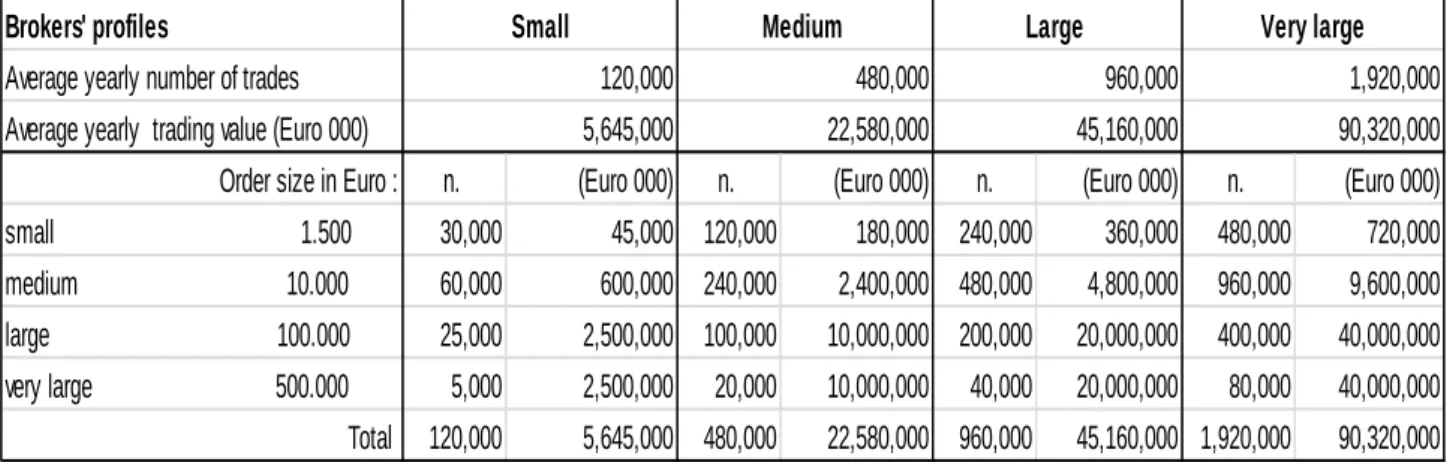
The first step in the user profile methodology is to identify the main characteristics of traders and investors. The second step is to select the specific fees to analyze. It was decided to consider annual membership fees and costs closely related to the volume and value of trading that a broker-dealer undertakes. Certain fixed cost components such as one-off application fees and connectivity costs, and certain variable cost components such as special offers, specific discounts and high usage fees, were thus excluded from the analysis. The selected trader profiles, presented in Table 1, managed a total annual turnover ranging from €5.6 billion to around €90 billion. To compute the trading fees charged to these traders, the following hypotheses were made: brokers do not act in a market maker capability; trading refers only to the most liquid equities (so called blue chips); brokers operate during continuous trading sessions and without taking advantages of fee discounts offered by some venues on automatic orders; every trader is able to choose on every trading platform the price list package or options that allow him to be charged the lowest amount.
Annex 1 shows fees charged to these brokers. Rigorous comparison of these results with similar surveys (Alemanni, Lusignani & Onado 2006; Fioranti & Gentile 2011; Oxera 2012) is not possible due to the different user profiles and different objectives of the various studies. Nonetheless it is quite evident that from 2007 to now stock exchanges have cut fees charged to broker-dealers continuously.
Table 1: Brokers’ profiles
It is important to stress that comparisons in bottom-up studies can vary hugely as a result of the inclusion or exclusion of certain items in the tariff structure or their misinterpretation
Brokers' profiles
Average yearly number of trades Average yearly trading value (Euro 000)
Order size in Euro : n. (Euro 000) n. (Euro 000) n. (Euro 000) n. (Euro 000) small 1.500 30,000 45,000 120,000 180,000 240,000 360,000 480,000 720,000 medium 10.000 60,000 600,000 240,000 2,400,000 480,000 4,800,000 960,000 9,600,000 large 100.000 25,000 2,500,000 100,000 10,000,000 200,000 20,000,000 400,000 40,000,000 very large 500.000 5,000 2,500,000 20,000 10,000,000 40,000 20,000,000 80,000 40,000,000 Total 120,000 5,645,000 480,000 22,580,000 960,000 45,160,000 1,920,000 90,320,000 5,645,000 22,580,000 45,160,000 90,320,000
Small Medium Large Very large
109
(Alemanni, Lusignani & Onado 2006). Nevertheless, bearing this in mind, some useful considerations do emerge from this analysis.
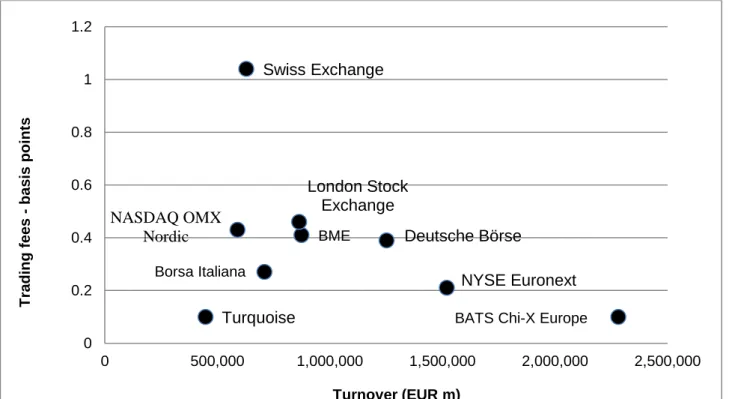
The fee levels of all the stock exchanges considered, measured in basis points for all the broker types, were very close to that of the London Stock Exchange. In particular, the Swiss Exchange had high fees for all the broker profiles, and in this estimation it appears to be the most expensive. Conversely, Borsa Italiana and NYSE Euronext seemed to be very competitive because they charged their traders lower fees, whatever their profiles. Deutsche Borse and NASDAQ OMX were in the middle. Graphs 1 and 2 consider the relationship between the cost of trading and the value of trading to determine whether economies of scale might account for the difference in trading fees between stock exchanges charged to small brokers and to very large brokers respectively.
For the MTFs, the net fees charged to the four traders were computed based on the assumption that each had executed the same number of maker and taker orders (50:50); the same procedure was used for the Swiss exchange.
It is evident that since stock exchanges often apply lower fees when certain thresholds of trading volume are exceeded, MTFs should have a greater competitive advantage for investors with lower trading activity (Fioravanti & Gentile 2011).
Under this approach, BME is competitive for neither small nor very large brokers. Indeed, BME’s monopoly position has allowed it to continue to charge high fees up to 2012. Nonetheless, the effects of competition are becoming evident and BME appeared slightly less expensive in this analysis than in the 2011 Oxera survey.
Moving on to the top-down approach, certain flaws of this methodology must be taken into account, as discussed in section 2 above. Though the top down approach does not allow rigorous comparison of fee structures, it was used in this paper to confirm that revenues from trading activity have effectively decreased following the adoption of MiFID. In this regard, the unit cost of execution services was computed on the basis of trading revenues divided by the number of transactions. The results are self-explanatory and are shown in
110
Graph 1 - Comparison of fees paid by a small broker on the main trading platforms, in relation to the annual value of trading (2011).
Graph 2 - Comparison among fees paid by a very large broker on the main trading platforms, in relation to the annual value of trading (2011).
Table 3. The decrease in trading revenues for all the exchanges is clear and it is also evident that BME, had higher revenues, having been less affected by competition until 2012; furthermore, the Swiss Exchange was expensive for traders using this approach also.
BME Deutsche Börse London Stock Exchange NASDAQ OMX Nordic NYSE Euronext Swiss Exchange Borsa Italiana
Turquoise BATS Chi-X Europe 0 0.2 0.4 0.6 0.8 1 1.2 0 500,000 1,000,000 1,500,000 2,000,000 2,500,000 T radin g f ee s - b as is p o int s Turnover (EUR m) Deutsche Börse London Stock Exchange NASDAQ OMX Nordic BME NYSE Euronext Swiss Exchange Borsa Italiana Turquoise BATS Chi-X 0.00 0.05 0.10 0.15 0.20 0.25 0.30 0.35 0.40 0.45 0 500,000 1,000,000 1,500,000 2,000,000 2,500,000 T radin g f ee s - b as is p o int s Turnover (EUR m)
111
Table 2 – Revenues per trade
2008 2009 2010 2011 LSE Group (£) 0.73 0.63 0.59 0.53 trading revenues 184,200,000 133,500,000 127,100,000 126,800,000 n. trades 253,093,903 211,587,317 215,499,540 240,389,130 DeuscheBoerse (Euro) 1.59 1.26 1.03 0.84 trading revenues 187,300,000 109,200,000 102,500,000 108,300,000 n. trades 118,036,409 86,868,001 99,900,498 129,154,036 BME (Euro) 4.06 3.93 3.42 2.92 trading revenues 150,969,000 124,097,000 137,991,000 133,273,000 n. trades 37,156,189 31,606,641 40,401,486 45,673,290
NYSE Euronext($) (a) 1.58 0.95 0.70 0.66
trading revenues 301,852,214 158,771,285 126,260,014 139,088,096
n. trades 191,045,705 167,127,668 180,371,448 210,739,540
NASDAQ OMX Nordic ($) (b) 2.17 1.86 1.31 1.04
trading revenues 116,000,000 95,000,000 90,000,000 93,000,000
n. trades 53,354,886 51,159,897 68,799,157 89,737,956
Six Swiss Exchange (CHS) 9.99 9.15 8.63 7.50 trading revenues 418,345,000 292,622,000 276,896,000 275,523,000
n. trades 41,867,194 31,990,112 32,103,416 36,734,773
(a) Revenue per trade is given in the annual report, so trading revenues from the European markets were estimated.
(b) In 2009 in trading revenues were included the profits/losses of NASDAQ OMX Neuro, which was closed later.
Source: For the computation of revenues per trade, sales revenues presented in annual reports were used while for the number of trades, the sum of the monthly number of trades in the statistics elaborated by FESE was computed.
A third approach sometimes used in competition analysis focuses on the profitability of trading platforms. It is claimed that if a trading platform is profitable, it is likely that prices will be relatively high and that there will be benefits to be had from introducing competition. Surely such an argument is inaccurate, because so many factors can make a company profitable, in addition to the high prices of services offered. In any case, profitability analysis in a competition policy context requires detailed data to allocate revenues and costs to specific services over a relatively long period of time. Unfortunately such data is not usually available outside a firm’s headquarters (Oxera 2012).
Without this detailed data, it is nevertheless possible to gain an idea of the profitability of the major stock exchange groups. As a first step, the incidence of trading revenues on the total revenues of each stock exchange was computed. Table 4 shows that, for all stock exchanges considered, revenues from trading activity are becoming increasingly less relevant. Only BME maintained more or less the same percentage of revenues from
112
trading activity over the years, owing to the lack of competition until 2012, as discussed above.
Table 3 – The incidence of cash equity trading revenues on total revenues
(1) LSE does not include Borsa Italiana
(2) This percentage included derivatives trading (2008 only)
Source: Annual Reports of each stock exchange and FESE, European Exchange Report, various years. In terms of profitability, the operating profit margin, that is the ratio of operating profit to sales, is one of the most appropriate indicators for this kind of analysis because a higher operating profit margin is usually considered the result of an appropriate pricing structure and effective cost controls. Obviously, the higher the percentage, the more profitable a company is. As Graph 3 shows, in Europe all the stock exchanges considered suffered for the impact of the financial crisis in 2009. Apart from this, the Spanish stock exchange group had the highest operating profit margin that remained constant over the years. LSE and Deutsche Boerse also had high operating profit margins. The two “Transatlantic” groups had lower ratios. Considering that trading activity is shrinking, and becoming less and less profitable, this analysis confirm that major stock exchanges are diversifying their overall activityviisuccessfully.
Graph 3 – The trend in the operating profit margin
Source: DATASTREAM and Annual Reports
Stock exchanges 2008 2009 2010 2011
LSE (1) 27% 22% 21% 19%
Deutsche Boerse 70% 51% 47% 48%
BME 43% 42% 44% 42%
SIX Swiss Exchange (2) 78% 73% 74% 72%
NYSE Euronext 52% 47% 41% 38% NASDAQ OMX 32% 28% 28% 27% 0% 10% 20% 30% 40% 50% 60% 70% 80% 2008 2009 2010 2011
LSE Deutsche Boerse BME
113
In short, decreasing trading volumes, shrinking revenues and increased competition from MTFs and other rival trading venues are forcing traditional stock exchanges to become increasingly wide-ranging financial institutions offering post-trade activities, IT outsourcing and information services. Diversification drives Europe’s leading exchanges whilst smaller exchanges may be more vulnerable because of their reliance on cash trading volumes as a driver of profits.
5. Conclusions
The increased competition introduced by MiFID from the end of 2007 quickly resulted in a sharp reduction in the fees charged by European stock exchanges and, in many cases, in a simplification of pricing structures. Nevertheless, MTFs have already eroded more than 30% of the trading volumes of the major European stock exchanges, mainly by use of the maker-taker pricing model combined with technology designed to minimize latency.
In the last few years, stock exchanges have to a certain extent reinvented themselves in response to competition from alternative venues, through new pricing models, revamped technological systems and greater client-focus. Moreover, stock exchanges have become smarter in their use of liquidity schemes, and the quality and depth of their markets continue to ensure best execution for their clients and end investors.
By updating prices lists frequently during the year, European stock exchanges have in recent years courted high-frequency order flows in a bid to bolster their share of secondary market trading, under attack from upstart competitors. However, sometimes they have done so at the expense of other constituents and in mid-2012 the exchanges seem to be turning back to reconsider other participants. In fact, through pricing policies stock exchanges, like the other firms, try to attract different member firms and diversify their clients; equity markets are best served and most valuable when used by a wide variety of customers.
Fragmentation of trades among several trading venues and fierce competition have recently fostered the introduction of new, niche-focused pricing structures, including those adopted by new MTFs such as Burgundy. Moreover, promotions, incentives and rebates are used increasingly to attract specific order flows.
The empirical analysis carried out using the methods most commonly adopted in the literature showed that trading fees have decreased in all European trading venues considered, except for MTFs that started their activities with very low margins, in some cases so low as not to guarantee their long-term survival. It also emerged that execution fees are lower on stock exchanges where competition from alternative trading venues is higher; in fact, fees are lower on the LSE, NYSE Euronext and Deutsche Boerse. The impact of lower trading fees has had a significant impact on the revenues of stock exchanges: from 2008 to 2011,trading fees per transaction fell by an amount ranging from 25% to 58%. Obviously, the incidence of cash equity trading revenues on total revenues decreased as well on all the stock exchanges, and by over 30% for LSE and Deutsche Boerse in particular. Until now, lower trading revenues do not seem to have had an impact on the ability of stock exchanges to develop their role in equity trading markets. Stock exchanges are successfully diversifying overall operations and operating profit margins are not declining.
114
In this new scenario, however, another phenomenon is worthy of note: the new MTFs are mainly user-sponsored, and among user-shareholders, high frequency firms dominate – so now over 30% of lit volumes take place on user-owned platforms. These platforms operate business models that tend to be structurally unprofitable as standalone corporate entities, yet they are ultimately profitable to their shareholders who earn indirect rents, notably in the form of maker-taker pricing, control over market structure and fee reductions from incumbent markets. On the other hand, alternative trading platforms and over-the-counter platforms offer only trading while stock exchanges play an important role as listing venues and as sources of equity financing. Stock exchanges also serve as “neutral” trading platforms and in this way they guarantee the quality of equity markets.
Furthermore, decreasing trading volumes and low margins are squeezing some new trading venues out of the market, forcing them to consider new strategies to survive, either by diversifying their activity, such as Turquoise and TOM MTF that offer trading in equity derivatives as well; or by charging new fees for market data, previously sold for free, with effect from the end of 2012.
In the meantime new regulations are due to be passed, including MiFID 2; in this regard, it seems that stock exchanges’ request (FESE 2010) to the European regulator to force banks to change their internal trading facilities (broker crossing networks or BCNs) into more transparent trading platforms (organized trading facilities or OTFs) will be contemplated in MiFID 2.
Finally, even if execution fees are decreasing, certain factors not explicitly addressed in this paper may raise the cost of trading for broker-dealers in the short term: 1) expenditure on IT systems to connect to an increasing number of trading venues; 2) higher market impact costs as a result of market fragmentation; 3) diminishing trade order size that may increase costs per transaction; the latter may also increase as a result of higher clearing and settlement costs per value of trading.
Endnotes
“The advent of advanced computers and other forms of communication has allowed markets to operate worldwide, even as the marketplace itself has changed. Compared to the traditional trading floor trading activity, remote membership, electronic order book trading, alternative trading systems, and the internalization of order flow by financial intermediaries all emerge in recent years”, (Hasan, Schmiedel & Song 2010).
2
It is not possible to define an “objective” measure of the cost of trading. It is composed of many elements and the contribution of each to the total varies from case to case. This in itself makes it difficult to carry out an objective analysis of the causes of high all-in costs for trading.” (EUROPEAN COMMISSION 2006).
3
The costs of services offered by trading platforms. The on-book trading costs in equities expressed as a cost per transaction, have decreased significantly (60%), while the costs in basis point per value of trading have increased somewhat (14%); (Oxera 2011)
4
Precisely the six topics are the following: 1) high frequency trading (HFT); 2) sponsored access; 3) co-locations: 4) fee structure; 5) tick size; 6) indications of interest.
5
The initiative gives the following benefits to the members: 1. Fee promotion on Spanish securities, offering rebates of 0.30 basis points for maker activity and 0.15 points for taker activity; 2. Liquidity Provider agreements on the ten most liquid stocks in the IBEX 35 Index, guaranteeing transactions at the European Best Bid and Offer (EBBO) and supporting the volume of transactions in the order book of €20,000 per aggregated member code per month. This initiative was in place from 4 June 2012 and the fee promotion offered rebates up to a maximum rebate.
6
Unfortunately in the real world, each user is unique: the profile of individual brokers are determined by the profile of their own trades and the profile of their underlying clients and cannot be easily summarized in one user profile
115 7 “To effectively compete against the emerging MTFs who employ an aggressively low cost/low
latency/minimal service strategy, NYSE Euronext made numerous changes to their business model and market offerings. Specifically, NYSE Euronext developed new trading technologies to diminish latency, reduce trading costs, and provide customized solutions to clients. Rules were harmonized between the European components of NYSE Euronext and adjusted to embrace MiFID. The NYSE Euronext business model was modified to take a more entrepreneurial structure to combat the reduced revenues from trading activities to diversifying into business services, especially technology services”; (Aitken et al. 2012).
References
Aitken, MJ, Cook, RM, Harris, FH & McInish, TH 2009, ‘Market Design and Execution Cost for Matched Securities Worldwide’, Institutional Investor Guides: Trading, no. 1, pp. 38-76.
Aitken, MJ, Di Marco, EM & Harris, FH 2011, ‘Price Discovery Efficiency and Information Impounding on NYSE Euronext Paris’, <http://ssrn.com/abstract=2029338>.
Alemanni, B, Lusignani, G & Onado, M 2006, ‘The European Securities Industry. Further Evidence on the Roadmap to Integration’, in G. Ferrarini & Wymeersch E (Ed.),
Investor Protection in Europe: corporate law making, the MiFID and beyond, Oxford
University Press,Great Britain, pp.199-234.
Angel, J, Harris, L & Spatt, CS 2010, Equity Trading in the 21st Century, Marshall Research Paper Series, Working Paper FBE 09-10.
Barclay, MJ, Hendershott, T & McCormick, DT 2003, ‘Competition among Trading Venues: Information and Trading on Electronic Communications Networks’, The Journal of
Finance, Vol. 58, no. 6, pp. 2637-2666.
CESR 2010, Micro-structural issues of the European equity markets, Call for evidence, 1st April.
Chesini, G 2007,‘From demutualisation to globalisation: new challenges for Stock Exchanges’, International Review of Business Research Papers, vol. 3, no.5, pp. 146-160.
Chesini, G 2010, ‘Consolidation in the Stock Exchange Industry’, in R Bottiglia, G, Gualandri & GN Mazzocco (Eds), Consolidation in the European Financial Industry, Palgrave, pp. 164-181.
CONSOB 2011, Annual Report , Rome, 31st March.
Domowitz, I & Steil, B, Automation, Trading Costs, and the Structure of the Securities
Trading Industry, in Brookings-Wharton Papers on Financial Services, 1999.
Domowitz, I, Glen, J & Madhavan, A 2001, ‘Liquidity, Volatility and Equity Trading Costs
Across Countries and Over Time’, Vol. 4, no. 2, pp. 221–255.
EACH, ECSDA, FESE 2006, European Code of Conduct for Clearing and Settlement, 7 November.
EUROPEAN COMMISSION 2006, Competition in EU securities trading and post-trading, Issues Paper, May.
FESE, European Exchange Report, 2007-2012.
FESE, 2010, FESE Position on Dark Pools and Broker Crossing Networks,12nd February. Fink, J, Fink, KE & Weston, JP 2006, ‘Competition on the Nasdaq and the growth of
electronic communication network’, Journal of Banking & Finance, Vol. 30, no. 9, pp. 2537-2559.
Fioravanti, SF & Gentile, M 2011, The impact of market fragmentation on European stock
exchanges, CONSOB Working Paper, no. 69, July.
Gomber, P, Gsell, M & Lutat, M 2011, ‘The Quality of European Equity Markets after MiFID’, in V Lazzari (ed.), Trends in the European Securities Industry, Egea, Milan, pp. 171-192.
116
Harris, L 2010, Regulated exchanges: Dynamic Agents of Economic Growth, Oxford University Press, Great Britain.
Hasan, I, Schmiedel, H & Song, L 2010, Growth strategies and value creation: what works
best for stock exchanges?, Bank of Finland Research, Discussion Paper, no. 2.
Johnson, B 2010, Algorithmic Trading & DMA, Myeloma Press, United States.
O’Hara, M & Ye, M 2010, ‘Is market fragmentation harming market quality?’, Journal of
Financial Economics, Vol. 100, no. 3, pp. 459-474.
Oxera 2007, Methodology for monitoring prices, costs and volumes of trading and post trading activities, July, <http://ec.europa.eu>.
Oxera 2009, Monitoring prices,costs and volumes of trading and post trading activities, July, <http://ec.europa.eu> .
Oxera 2011, Monitoring prices, costs and volumes of trading and post trading activities, May, <http://www.oxera.com/cmsDocuments/Oxera>.
Oxera 2012, What would be the costs and benefis of changing the competitive structure of
the market for trading and post-trading services in Brazil, July.
Pagano, MS 2009 (a), ‘International Market Structure: Global Problems and Micro Solutions’, International Journal of Managerial Finance, Vol. 5, no.1, pp. 5-15.
Pagano, MS 2009 (b), ‘Which Factors Influence Trading Costs in Global Equity Markets?’,
The Journal of trading, Vol. 4, no. 1, pp. 7-15.
Petrella, G 2010, ‘MiFID, Reg NMS and competition across trading venues in Europe and the USA’, Journal of Financial Regulation and Compliance, Vol. 18, no. 3, pp. 257-271.
Schwartz, RA 2010, ‘Dark Pools, Fragmented Markets, and the Quality of Price Discovery’,
The Journal of Trading, Vol. 5, no. 2, pp. 17-22.
SEC 2010, Concept Release on Equity Market Structure, January 14th, [Release No.
34-61358; FileNo. S7-02-10].
Stoll, HR 2006, ‘Electronic Trading in Stock Markets’, Journal of Economic Perspectives, Vol. 20, no. 1, pp. 153–174.
Wagner, W & Edwards, M 1993, ‘Best execution’, Financial Analysts Journal, Vol. 49, no. 1, pp. 65-71.
Write, W 2005, ‘Trading Fees Figures Support Claims from Deutsche Borse’, Financial News, January.
117 Annex 1
Fixed fees
Broker Small Medium Large Very large
Euro £ or CHS Euro £ or CHS Euro £ or CHS Euro £ or CHS
LSE (a) 12,500 12,500 12.500 15,840 12,500
Borsa italiana 1 15,000 15,000 15,000 161,000
Borsa italiana 2 (b) 113,000 113,000 161,000 161,000
Deutsche Boerse (c) 15,000 15,000 15,000 15,000
Nyse Euronext (d) / / / /
Nasdaq OMX Nordic price list 1 (e) 0 0
Nasdaq OMX Nordic price list 2B 480,000 480,000
Swiss Exchange (f) 20,000 20,000 20,000 20,000
BME (g) 8,545 25,480 48,060 93,220
Variable fees
Broker Small Medium Large Very large
Euro £ or CHS Euro £ or CHS Euro £ or CHS Euro £ or CHS
LSE 190,685 418.871 875,242 1,587,983
Borsa italiana 1 135,000 540,000 1,080,000 2,160,000
Borsa italiana 2 75,400 301,600 603,200 1,206,400
Deutsche Boerse "High volume" 203,220 812,880 1,625,760 3,251,520
Nyse Euronext 120,000 480,000 960,000 1,152,000 *
Nasdaq OMX Nordic price list 1 244,105 976,420
Nasdaq OMX Nordic price list 2B 1,445,120 2,890,240
Swiss Exchange 291,346 1,165,834 1,972,530 3,328,442
118 Total fees
Brokers Small Medium Large Very large
fee per fee per fee per fee per
Euro trade Euro trade Euro trade Euro trade
LSE 257,477 2.15 546,633 1.14 1,124,946 1.17 2,028,132 1.06
Borsa italiana 1 150,000 1.25 555,000 1.16 1,095,000 1.14 2,321,000 1.21
Borsa italiana 2 188,400 1.57 414,600 0.86 764,200 0.80 1,367,400 0.71
Deutsche Boerse "High volume" 218,220 1.82 827,880 1.72 1,640,760 1.71 3,266,520 1.70
Nyse Euronext 120,000 1.00 480,000 1.00 960,000 1.00 1,152,000 0.60
Nasdaq OMX Nordic price list 1 244,105 2.03 976,420 2.03
Nasdaq OMX Nordic price list 2B 1,445,120 1.51 2,890,240 1.51
Swiss Exchange 259,242 2.14 1,182,037 2.05 1,989,183 1.80 3,345,095 1.49
BME 233,361 1.94 924,696 1.93 1,846,476 1.92 3,517,352 1.83
(a) For LSE we used the standard value traded scheme in which the charge for each order executed is by reference to the cumulative value traded on the order book by the member firm in the current billing period. We use the currency rate €/£ of 0,789141.
(b) The small broker should choose the pricing package 1 while the other three brokers should choose the pricing package 2. Trading fees decrease in steps with the number of executed orders.
(c) For Deutsche Boerse, for the fixed components we should have considered also that for every trader the stock exchange charges 1500 Euro. We do not assume the number of trader in every entity but the these fees are higher for bigger companies. For the compute of the variable components we use the “high volume” fee scheme.
(d) We fall into NYSE Euronext’s “Tier 2” scheme for small, medium and large brokers and “Tier 1” scheme for the very large broker.
(e) Nasdaq OMX’s the price list has the same structure as that for the Copenhagen, Helsinki, Iceland, and Stockholm stock exchanges. To avoid currency conversions we used the Helsinki stock exchange price list. We chose price list 1 for small and medium brokers and price list 2 for large or very large brokers that use a 50:50 maker taker structure; the latter choice is equal to the option called “internal”.
(f) For the Swiss exchange we used the standard tariff for small and medium brokers, while for large brokers we used the 100,000 CHS per month commitment and the 175,000 CHS commitment per month for broker 4. For the last 2 brokers I chose the alternative fee structure called Balanced a) Poster & aggressor. If the participant does not achieve the monthly minimum fee volume for chosen commitment level, it must pay a Minimum Activity Charge (MAC). The MAC represents the difference between the commitment level and the eligible fee volume actually generated. We use the currency rate €/CHS of 1,201.