United Republic of Tanzania
Ministry of Health
Final report
Health sector PER update FY 05
Prepared by:
PER Task Team
Ministry of Health
Tanzania
Submitted to the Sector Working Group October 2005
Table of Contents
List of tables and figures……….……….………iii
Acronyms……….v
Acknowledgements………...vi
Executive Summary……….vii
1 INTRODUCTION ... 1
1.1 BACKGROUND AND CONTEXT... 1
1.2 TERMS OF REFERENCE... 2
1.3 PROCESS... 2
1.4 STRUCTURE AND CONTENTS OF THE REPORT... 3
1.4.1 CHANGES FROM PER UPDATE FOR FY04 ... 3
1.4.2 REPORT STRUCTURE... 3
2 RECENT TRENDS IN HEALTH SECTOR EXPENDITURE... 4
2.1 REVIEW OF PREVIOUS PER STUDIES... 4
2.2 TOTAL PUBLIC HEALTH BUDGET AND EXPENDITURE... 5
2.2.1 HEALTH IN RELATION TO THE TOTAL GOT BUDGET... 5
2.2.2 TOTAL ON-BUDGET HEALTH SPENDING... 6
2.2.3 TRENDS IN OVERALL PUBLIC HEALTH EXPENDITURE... 9
2.3 SUB-SECTORAL TRENDS IN BUDGET AND EXPENDITURE...10
2.3.1 RECURRENT AND DEVELOPMENT SPENDING...10
2.3.2 DOMESTIC AND FOREIGN SPENDING...11
2.3.3 SPENDING BY LEVEL OF THE HEALTH SYSTEM...14
2.3.4 SPENDING BY ACTIVITY TYPE (GOT RECURRENT ONLY) ...16
2.3.5 ON AND OFF-BUDGET SPENDING...18
2.4 BUDGET PERFORMANCE...22
2.4.1 ON-BUDGET SECTORAL TOTAL...22
2.4.2 MOH HEADQUARTERS RECURRENT SPENDING BY SUB-VOTE...23
2.4.3 SUMMARY REGIONAL BUDGET PERFORMANCE...25
2.4.4 BUDGETS AND EXPENDITURES FOR LARGER HOSPITALS...25
2.5 ANALYSIS OF PARTICULAR RECURRENT EXPENDITURE CATEGORIES...26
2.5.1 DRUGS AND SUPPLIES...26
2.5.2 SPENDING ON ANTI-RETROVIRAL DRUGS...28
3 LOCAL GOVERNMENT SPENDING ...30
3.1 LOCAL GOVERNMENT HEALTH SECTOR SPENDING...30
3.1.1 TRENDS IN THE LEVEL OF GOVERNMENT SUBVENTIONS TO LGAS...30
3.1.2 HEALTH SHARE WITHIN THE TOTAL LGA BUDGET...31
3.2 FY04 BUDGET PERFORMANCE AT LGA LEVEL...32
3.2.1 CHANGES IN THE OC ESTIMATES...32
3.2.2 LGA BUDGET PERFORMANCE FY04...33
3.3 FISCAL DECENTRALISATION AND ALLOCATION FORMULAE...34
3.4 RESOURCE ALLOCATION AT THE COUNCIL LEVEL...35
3.4.1 INTRA-COUNCIL ALLOCATION OF GOT BLOCK GRANT BY SUB-VOTE...35
3.4.2 SUB-DISTRICT ANALYSIS USING COUNCIL LEVEL DATA...36
3.5 OTHER ANALYSIS USING COUNCIL DATA...38
4 SECTORAL PERFORMANCE ...40
4.1 HEALTH SECTOR PERFORMANCE IN RELATION TO THE PRS ...40
4.1.1 HEALTH AS A PRIORITY SECTOR...40
4.1.2 PRIMARY HEALTH AS A PRIORITY ITEM...40
4.2 HEALTH SECTOR FINANCING PERFORMANCE INDICATORS...40
5 DISCUSSION, RECOMMENDATIONS AND NEXT STEPS...43
5.1 KEY ISSUES AND RECOMMENDATIONS...43
5.1.1 OVERALL SECTORAL SPENDING...43
5.1.2 SUB-SECTORAL SPENDING: MEETING PRIORITIES...43
5.1.3 BUDGET PERFORMANCE AND ABSORPTION CAPACITY...44
5.1.4 LOCAL GOVERNMENT FINANCING ISSUES...44
5.1.5 COST-SHARING...45
5.1.6 OFF-BUDGET EXTERNAL FUNDING...46
5.1.7 DRUGS AND SUPPLIES...46
5.1.8 THE PER PROCESS...47
5.2 IMMEDIATE NEXT STEPS...47
6 ANNEXES ...48
Annex A Sources of information, key assumptions and other notes... 48
Annex B PER Master table... 57
Annex C Miscellaneous additional tables and figures... 58
Annex D: Additional information and comment on spending on Medical supplies and services (GFS item 2604)... 62
List of figures
Figure 1 Sectoral spending as a proportion of the total GOT budget, FY00 – FY05 ... 6
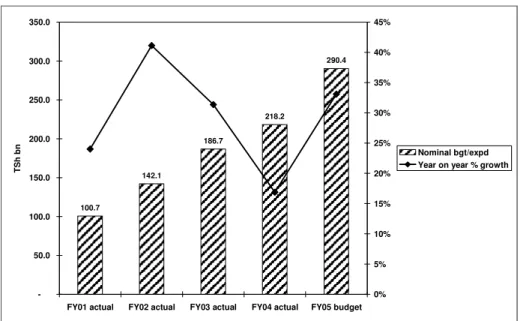
Figure 2 Nominal on-budget health spending and rate of growth, FY01 – FY05... 7
Figure 3 Increase in nominal spending FY04 to FY05, by component (TSh bn) ... 7
Figure 4 Changing component shares within the Health allocation, FY04 and FY05... 8
Figure 5 On-budget share of domestic and foreign funding, FY02 – FY05 ... 12
Figure 6 Role of foreign funds in increased (nominal) sectoral budgets FY02 - FY05 (TSh bn) ... 12
Figure 7 Health budget, percentage breakdown by type of funding, FY02 – FY05 ... 13
Figure 8 Basket funding as a share of recurrent health spending, FY02-FY05 ... 14
Figure 9 Proportion of estimated budget by level, FY02 – FY05 ... 14
Figure 10 Proportion of actual expenditure by level, FY02 – FY04 ... 16
Figure 11 The trend in allocation by category of spending, FY01 – FY04 ... 17
Figure 12 Budgeted and actual on-budget health spending, FY01 – FY04 ... 22
Figure 13 Nominal MOH headquarters spending on drugs and supplies, FY02 – FY05 ... 27
Figure 14 PE: OC allocation at LGA level, FY03 – FY05... 30
Figure 15 LGA health sub-vote allocations as % of total LGA PE and OC, FY05 ... 32
Figure 16 Breakdown of GOT recurrent subvention to LGAs by sub-vote, FY05 ... 35
Figure 17 Per capita income and expenditure, selected councils, 2003... 37
Figure 18 Selected councils’ reported income 2003, by source... 37
Figure 19 Selected councils’ per capita spending, by level, 2003 ... 38
List of tables Table 1 Health sector definitions used in the FY05 PER update ... 2
Table 2 Key findings and actions from health sector PER update for FY04 ... 4
Table 3 Additional measures of spending, MOF on-budget data FY01 – FY05 ... 9
Table 4 Total health expenditure in Tanzania, FY02 – FY05 (TSh billion) ... 9
Table 5 Additional measures of spending, overall MOH PER data FY02 – FY05 ... 10
Table 6 Breakdown between recurrent and development spending, FY00 – FY04... 11
Table 7 Public health spending, by funding type (TSh billion) ... 11
Table 8 Summary of GOT health spending by level/category, FY01 – FY04 (TSh billion) ... 17
Table 9 On- and off-budget shares of health spending, FY02 – FY05 ... 18
Table 10 Reported HSF revenues and expenditures, FY02 – FY04 ... 19
Table 11 CHF data on membership revenues and numbers ... 20
Table 12 Budget performance (expenditure/budget), FY02 – FY04 ... 23
Table 13 MOH recurrent expenditure: budget and capacity performance FY04 ... 23
Table 14 MOH recurrent expenditure: budget and capacity performance FY05 – first half... 24
Table 15 Regional sub-vote budgets and expenditure, FY04 – FY05 (TSh) ... 25
Table 16 Budget performance for larger hospitals, FY04 ... 25
Table 17 Spending by MOH department on drugs and supplies, FY02 - FY05 (TSh m)... 26
Table 18 Drugs and medical supplies as a share of MOH/sector spending, FY02 – FY05 ... 28
Table 19 Allocation of hospital drugs by level, FY04 ... 28
Table 20 Internal MOH budget reallocations in favour of ARVs during FY04... 29
Table 21 GOT health subventions to LGAs, FY03 – FY05 (TSh m, current prices) ... 30
Table 22 Health subventions in relation to total LGA PE+OC, FY05 (TSh m) ... 31
Table 23 Variation in Health share of LGA allocations, FY05 ... 32
Table 24 Regional variation in FY04 OC estimates by source (TSh m) ... 33
Table 25 LGA releases in relation to estimates, FY04... 33
Table 26 LGA PE releases in relation to estimates, FY04 ... 34
Table 27 LGA OC releases in relation to estimates, FY04 ... 34
Table 28 Data on cost-sharing from a sample of council PFIR, 2003... 39
Table 29 Recurrent spending on PRS priority items, FY02 to FY05 (TSh million) ... 40
Table 30 Finance-related health sector performance indicators ... 41
Table 31 Selected finance-related health sector performance indicators, in US dollars... 41
Table 32 Sector budget by level, FY02 – FY05 (TSh bn) ... 58
Table 33 Sector expenditure by level, FY02 – FY04 (TSh bn)... 58
Table 34 MOH recurrent expenditure: budget and capacity performance FY03 ... 58
Table 36 Reallocation to ARVs within Department of Preventive Services, FY04... 60
Table 37 Individual sub-items reallocated to ARVs, FY04 ... 60
Table 38 PE: OC split at LGA level, FY03 – FY05 ... 61
Table 39 LGA Health share as per the Vol III Estimates passed by National Assembly, FY05 ... 61
Table 40 MOH recurrent spending on Item 2604 Medical Supplies and Services, FY03 – FY05 ... 62
Acronyms
AGO Accountant General’s Office
AIDS acquired immuno-deficiency syndrome
ARVs anti-retroviral (drugs)
BER Budget Execution Report
bn billion
CCHP Comprehensive Council Health Plan
CFS Consolidated Fund Services
CHF Community Health Fund
CMO Chief Medical Officer
CPI consumer price index
DC district council
DfID Department for International Development (UK) DPP Directorate of Policy and Planning
FY financial year
GAVI Global Alliance for Vaccines and Immunisations
GBS general budget support
GFATM Global Fund for AIDS, Tuberculosis and Malaria
GOT Government of Tanzania
GPF General Purpose Fund (for LGAs)
HIV human immuno-deficiency virus
HSF Health Service Fund
HSPS Health Sector Programme Support (Denmark) HSSP Health Sector Strategic Plan (July 2003 – June 2006) IFMS Integrated Financial Management System
KCMC Kilimanjaro Christian Medical Centre
LGA Local Government Authority (ies)
m million
MC municipal council
MDA ministries, departments and agencies
MKUKUTA [Mkakati wa Kukuza Uchumi na Kuondoa Umaskini Tanzania]
MOF Ministry of Finance
MOH Ministry of Health
MTEF Medium Term Expenditure Framework
NGO non-governmental organisation
NHIF National Health Insurance Fund
NIMR National Institute for Medical Research
OC other charges
PE personal emoluments
PER Public Expenditure Review
PFIR Physical and Financial Implementation Report
PHC primary health care
PORALG President’s Office – Regional Administration and Local Government
PRS poverty reduction strategy
PRSP poverty reduction strategy paper SBAS Strategic Budget Allocation System TACAIDS Tanzania Commission for AIDS
TC town council
TFNC Tanzania Food and Nutrition Council
TOR terms of reference
TPDF Tanzania People’s Defence Force
TRHS Three Regions Health Study (African Development Bank)
TSh Tanzania shillings
US$ United States dollars
Acknowledgements
The health sector PER update for FY05 was undertaken by a Task Team comprised of officials from the Ministry of Health Department of Policy and Planning, supported by colleagues from other Departments. An external consultant health economist, Ms Sally Lake, was contracted by the Swiss Agency for Development and Cooperation to support the process.
Thanks are due to the various officials of the MOH who contributed data for this exercise, and also to colleagues in the Ministry of Finance and the President’s Office – Regional Administration and Local Government. Mr Muhume, Chief Pharmacist MOH, and Mr Tesha of Medical Stores Department provided useful information on drugs and medical supplies, while Mr Sendoro, the Community Health Fund coordinator, and Dr McLaughlin of the World Bank provided information on the CHF. Mr Noel contributed figures from the National Health Insurance Fund. Mr Lapper of the Local Government Reform Programme provided useful clarification on queries relating to block grant funding of councils. Mr Rosche of JSI Deliver updated information on antiretroviral procurement.
Welcome comments and feedback were received from members of the Technical Sub-Committee of the Ministry of Health, and also by participants following presentation at the annual Health Sector Review meeting in April 2005.
Finally, some information drawn on in this report was compiled by the consultant during a separate assignment, the Three Regions Health Study, funded by the African Development Bank, and implemented by Medical Service Corporation International with the MOH.
Executive Summary
Purpose, output and limitations
In contrast to recent years, the health sector Public Expenditure Review update for FY05 is presented largely as an internal sectoral document for reviewing trends in budget and expenditure rather than as a detailed input to the budget process due to its delayed timing and a change in the focus of the overall government poverty reduction strategy with the development of the MKUKUTA (the Kiswahili acronym for the National Strategy for Growth
and Poverty Reduction, the second Poverty Reduction Strategy Paper)1. This highlights
“priority cluster outcomes” rather than priority sectors, and entailed a change in the way that sector inputs to the budget guidelines were prepared and presented, together with a recognition that undertaking full sectoral PER updates would present a significant administrative burden on line ministries in addition to these changes. This document is therefore somewhat less detailed than its predecessors.
The document was produced by a team led from the Ministry of Health Department of Policy and Planning, supported by an external consultant. Major constraints, as in previous years, remain the timely availability of the necessary data, both within the sector and from Ministry of Finance, together with the questionable quality of data provided by local government authorities in the absence of detailed expenditure data collated on their behalf through the Integrated Financial Management System (IFMS). Data on off-budget sources of funding, namely cost-sharing revenues and expenditures and details of off-budget external resources, remain particularly weak.
Initial findings use Ministry of Finance summary data, while subsequent analysis of sub-sectoral spending relies on data compiled specifically for the PER update. Inconsistencies remain but are not believed to affect the major findings.
Sectoral budget and expenditure trends
The health sector is defined as follows: On-budget includes recurrent and development spending at MOH headquarters, allocations by PORALG to Regional Curative and Preventive sub-votes, and to Local Government sub-votes for Curative, Preventive, Health Centres and Dispensaries, together with the central PORALG development budget related to Primary Health Care rehabilitation. In addition, it includes the contribution from the Accountant-General’s Office (AGO) to the National Health Insurance Fund (NHIF) on behalf of public servants. Off-budget includes also the use of cost-sharing revenues at public sector hospitals, and through the Community Health Fund (CHF), and external funding of projects captured within the MOF External Finance database. Comments relate to on-budget funding unless otherwise specified.
Key figures – on-budget Ministry of Finance data:
• Nominal budget outturn for FY04 rose year on year from TSh186.7bn in FY03 to TSh 218.2bn in
FY04, an increase of 16.9%. This represented a real increase of 12.5%
• For FY05, the nominal budget rose to TSh 290.4bn, an increase of 33% on FY04 outturn. This is
represents a real increase of almost 28%
• Final budget outturn for FY04 shows a sector share of 9.7% of overall government spending
(excluding CFS) compared with FY04 PER estimates of 9.2%.
• This is projected to rise to 10.1% for FY05, but still falls short of the FY03 figure of 10.4% • The share of government spending remains low relatively to the Abuja target of 15%
• Per capita spending remains low in relation to costs of delivering on health sector goals and
targets at US$7.42 for FY05, but has seen a substantial increase on FY04 outturn from US$5.71
1
Although the sector remains severely under-funded in relation to the Abuja target of 15% of GOT budget, and in relation to recent estimates of what it would cost to provide a limited package of services to the Tanzanian population, the overall picture of both expenditure in FY04 and the budget for FY05 is more positive than it was in the previous year. Overall MOF data show that the final share of FY04 expenditure (excluding Consolidated Fund Services, CFS) was 9.7% compared to an estimate of 9.2% at the time of the FY04 PER update. It should be stressed, however, that this still represents a fall from the FY03 figure of 10.4%.
In FY05, the picture is redressed somewhat with a budgeted share of 10.1% of total GOT spending (excluding CFS). In nominal terms, this represents an increase (on FY04 outturn) of 33%, while in real terms the increase is almost 28%. In nominal per capita US dollar terms, the allocation to the sector has risen from US$5.71 to US$7.42. This increase is due both to a significant rise in external funding, notably the significant inflow from the World Bank, but also to an increase in domestic recurrent funding (including General Budget support, GBS) of Other Charges.
Key figures – PER data
• The budgeted overall public health sector resource envelope rose in nominal terms from TSh
291.1bn in FY04 to TSh 453.2 bn in FY05, an increase of 56%
• Compared with FY04 estimates of outturn, this represents an increase of 46%
• This converts to a per capita US dollar figure of US11.57, a significant increase on the US$8.12 of
FY04
• In real terms, the increase in the value of the resource envelope represents an increase of 40%
PER data show that the nominal total health sector resource envelope including off-budget sources also grew significantly, by 56% in terms of year-on-year budget, and by 46% compared with FY04 outturn. A 60% increase in MOH recurrent spending and a 29% increase in the recurrent LGA allocation (compared with FY04 outturn) were the major drivers of this rise, both partly due to the increase in the basket funding to the sector. In real terms, the increase was still substantial, at 40% overall and 36% in per capita Tanzania shillings (FY05 budget compared with FY04 outturn). When off-budget sources are taken into consideration, the per capita US dollar allocation to the sector rises to US$11.57 for
FY052.
Analysis of sub-sectoral spending is largely confined to on-budget sources, using PER data, due to lack of data on how off-budget funds are spent.
For FY05, the split between the recurrent and development budgets has remained broadly stable, with recurrent spending accounting for 77% of the total on-budget. In actual expenditure terms, there was a continued slight fall in the share of recurrent spending due to improved budget performance of the development budget.
Linked to the substantial absolute increase in basket and other external funding to the sector, the share of domestic funding (including GBS) in the sector budget has fallen from 23% in FY04 to almost 38% in FY05. This is largely temporary as much of the World Bank funding will move to GBS for FY06 onwards. The external share of actual outturn for FY04 was almost 28%, higher than budgeted due to the within-year reallocation to the development budget and reasonable disbursement thereof.
In comparison with recent years, there has been a noticeable recentralisation of the budget in FY05, with the local government share falling from 33% of the final FY04 budget to 27% of
2
Data concerns regarding off-budget funding are noted in the main report and should be taken into consideration.
the FY05 budget. This is largely due to the significant absolute rises in both central level GOT and basket funding, which mask a corresponding increase in the allocation for drugs and medical supplies for other levels. Another source of this shift is the increase in the budgeted GOT transfer to the NHIF, again ultimately intended to result in spending at LGA and regional (hospital) level. Although the same definitions have been used for consistency and comparison with previous years, the large share of central spending which is channelled to other levels means that this analysis is of limited use, and a more comprehensive attempt to determine the allocation of such funds to beneficiary levels is overdue.
Such an attempt is made in terms of GOT recurrent funding by activity type (administration, hospital and preventive/primary), although minor concerns remain regarding the completeness of this information. The available data indicate a slight reduction in the share of actual expenditure going to Administration between FY03 and FY04, from 44% to 42%, a similar reduction to the Preventive and Primary category (from 16% to 14%), with a corresponding increase in the allocation to hospitals. This may in part be due to the reassignment of funds during the FY for the purchase of anti-retroviral drugs which are delivered at hospital level.
The projected share of off-budget spending for FY05 is 6% higher than it was in FY04 at 31%. Actual off-budget expenditure in FY04 accounted for an estimated 29% of the total. Concerns regarding data quality and completeness and the assumptions used in estimation of both external and cost-sharing reduce the usefulness of this analysis. Notwithstanding, reported data indicate an increase of 51% in the nominal value of Health Service Fund (HSF) revenues, and a rise in the per capita value of such receipts from TSh59 in FY03 to Tsh87 in FY04. Community Health Fund data remain very weak, and various assumptions and extrapolations were required to reach a very tentative national revenue estimate of TSh4.75bn. Off-budget external financing estimates for FY05 were taken from the data submitted to the MOF External Finance Department, and indicate a significant increase from TSh69bn in FY04 to almost TSh 133bn in FY05.
Budget performance
Budget performance of the on-budget sectoral total (PER data) improved in FY04, with expenditure matching net approved budget, partly due to a higher than budgeted release of funding to NHIF, and partly due to improved release of funding through the MOH headquarters development budget during the course of the year.
IFMS data on MOH headquarters budget performance (release as % budget) indicate an improvement in this component of sector spending, with 97% of budgeted funds released by MOF in FY04, compared with 90% in FY03 (GOT and basket) and only 86% of the GOT share of this. In terms of absorption capacity (expenditure as % of release), MOH performance also improved, from 97.9% (GOT and basket) to 99.5% in FY04. Data on the first half year performance for FY05 indicate that over 50% over budgeted funds had been released by the end of December 2004 (50.6% of GOT funds and 62% of basket funds). Absorption of these funds was at 75% overall by end December 2004.
At Regional level, expenditure as a percentage of approved estimates was 98.7% for FY04, with both Curative and Preventive sub-votes performing well. Personal Emoluments (PEs) performed slightly better than Other Charges (OCs).
For the large hospitals, IFMS data indicate a 98% release of funding for FY04, with 100% expenditure of released funds.
MOH HQ spending on drugs and supplies, a key input in the sector, has risen from an actual level of TSh 29.2bn in FY04 to a budgeted figure of TSh 50.2bn for FY05 (which excludes a
further TSh3.5bn for anti-retroviral drugs). The health basket is expected to contribute roughly 24% of this figure. Drugs and medical supplies are expected to account for 42% of MOH OCs in FY05, up from 36.5% in FY04 (actual), while the per capita US dollar figure rises from US$0.76 in FY04 to a projected US$1.37, of which only a small proportion is currently due to anti-retroviral drugs (ARVs). More work is required in this area to ascertain total figures from all sources of funding as the PER analysis concentrates on GOT and basket funding.
Local government spending
Budgeted allocations to councils rose for FY05 to TSh63.6bn, a 37% increase on releases during FY04. In real terms, this represents year-on-year growth of 31% in the LGA allocation. This was largely driven by an increase in the OC allocation, in contrast to the previous year where PEs accounted for the whole of the 14% increase over FY03. The nominal value of the LGA health budget (PE and OC) converts to an approximate US dollar value of $1.62 per capita.
Although data for individual councils was incomplete, summary data indicate that budgeted Health sub-votes account for 17.6% of LGA allocations on average for FY05. This represents a 1% increase on FY04 which is encouraging, but also indicates that the sector has failed to attain its baseline share of 18%. Given a 14.2% reduction from original to net approved estimates for LGA OCs during FY04, it is also likely that the final share of actual expenditure could be quite different, but unfortunately data were not available to compare actual as opposed to budgeted proportions.
Budget performance appeared to be satisfactory at LGA level, with PER data indicating releases of 101% of the final budget. This was driven by releases for PEs exceeding budget by 5.1% (slightly higher for urban than for district councils) which masked an 8% shortfall in the OC release (broadly similar by council type).
Financial years for central and local government were harmonised from the start of FY05. In addition, the geographical allocation formula employed for the health basket was also applied to the block grant (although it remains unclear whether this was for both OC and PE components). These moves are both expected to facilitate future analysis of sectoral funding, and the LGA component thereof, and are welcomed.
Although the quarterly health sector physical and financial implementation reports produced by each council are a potentially valuable source of information on the intra-district allocation of funding and on actual expenditures, for many councils they remain weak in terms of data quality and comprehensiveness. Opportunities for central level comparative analysis of LGA finances are therefore not exploited. Further efforts to improve the quality and consistency of such reports (and analysis thereof) would be worthwhile, particularly in the continued absence of IFMS data at the LGA level.
Sectoral performance
As a priority sector, Health showed a slight gain in its share of overall GOT spending (as noted above) compared with FY04, but has not yet regained the level attained in the earlier years of PRSP 1.
The available data suggest that spending on priority items within the sector has fallen for the second year running as a share of sector spending (GOT on-budget). The figures for FY04 are likely to have been affected by the substantial over-spend on NHIF under Vote 23, while incomplete data on spending on drugs and medical supplies for district health services may
also have contributed to this picture. This should be explored in more detail in the next update.
In terms of sectoral performance indicators, the substantial increases in the overall resource envelope are reflected in positive movement of the central and local government values of indicator 1 which monitor the per capita GOT allocation to health at each level. There has been a slight fall in the budget for the regional level for FY05. Indicator 2 measures the total per capita resource envelope for the sector, and has also seen a 52% increase in the year on year budget in FY05.
However, in terms of the breakdown between levels of the health system, as far as the PER data were able to show, there has been a continued poor showing in terms of the allocation between central and local government shares, despite a stated commitment in the Health Sector Strategic Plan to decentralisation and to improving the performance of district health services in particular.
Recommendations
Early agreement is required both on the terms of reference for any subsequent health sector PER update to feed into internal sectoral review and discussions, but also on the nature of any cross-sectoral PER exercise which might seek to reflect the cluster approach of the MKUKUTA. Timing will need to be arranged in order to prevent duplication of these two potentially parallel processes.
The PER Working Group should be approached to help facilitate the timely and simple transfer of the necessary information for the PER update from MOF, Treasury and PORALG, among others. Ideally the PER Task Team should endeavour to compile this on a quarterly basis in order to reduce the task at year-end. This should be extended also to internal data from the Chief Pharmacist on the allocations for drugs and medical supplies which is already compiled quarterly for departmental purposes, and for the National Health Insurance Fund, along with any other major data providers.
A more detailed assessment of the total value and volume of drugs and essential medical supplies within the sector should be undertaken, to include the development budget, off-budget external funding, and regional and local government spending. This should also include more analysis of the allocation by level of the health system, by key intervention areas, and by geographical area, in order to ensure that this key input is being used to maximum effectiveness.
Work to determine the allocation by final beneficiary level of the health system of the various expenditures made on their behalf by the central level should be undertaken in order to provide both a more comprehensive analysis than has been undertaken in the recent PER updates. This should cover all on-budget sources (ie including basket and other development spending) rather than simply GOT recurrent as has been the practice in recent years.
Additional areas where better information is required include off-budget external funding, both in terms of harmonising information from the MOF External Finance database with that in the official budget estimates, and in terms of obtaining a better picture of actual expenditures, as this is currently subject to a number of questionable assumptions in the PER. Further analysis might be usefully undertaken to ensure that such funding is in accordance with sector/national priorities.
The quality of data on cost-sharing has been raised as a concern for several years, particularly regarding the Community Health Fund. Given the current debate on this issue,
both in Tanzania and on the international policy agenda, and the widely diverging opinions held, a much stronger evidence-base would be most welcome.
Greater efforts should be made to improve the quality, consistency, and central analysis of reports prepared by the LGAs in order to obtain useful information on allocation and sector performance at that level.
1 Introduction
1.1 Background and context
The Public Expenditure Review (PER) in Tanzania has become an established component of the government planning and budgeting process, with one of its key objectives being to ensure that the expenditure patterns of the government match the policy priorities as stipulated in the Poverty Reduction Strategy Paper (PRSP). It incorporates a retrospective analysis of spending in priority sectors, generally undertaken in the second quarter of the financial year as an input to the budget process, and subsequent presentation and discussion of the same at a consultative meeting in the fourth quarter. To the extent possible, all funds, contributed by various sources including external development partners and utilized by the government in order to achieve PRSP targets are indicated under this review. It also gives a detailed picture of how the funds have been utilized in recent past by levels, functions and institutions and determine how the spending relate to stated strategic objectives.
For the financial year FY2004/05 (FY053) the process has been changed somewhat due to the additional administrative burden on government departments of contributing to the second Poverty Reduction Strategy Paper (PRSP), the National Strategy for Growth and
Poverty Reduction4, which has moved away from the concept of priority sectors to focus on a
number of priority outcomes. This represents a concerted effort to link financial and other inputs to priority poverty-reducing outcomes which are the result of the activities in a number of different sectors.
Input to the budget guidelines for FY06 was undertaken prior to and separately from the PER exercise, and due to the introduction of new software, involved substantially greater time in its preparation. In recognition of the additional workload represented by the development of MKUKUTA and the Budget Guidelines submission using the newly developed Strategic Budget Allocation System (SBAS) software, this PER is less detailed than in previous years, focusing on key expenditure trends.
A Task Team and Consultant carried out the study prior to the preparation of the Medium Term Expenditure Framework (MTEF) for 2005/06 to 2007/08 for the Ministry of Health (MOH). Members of the Task Team were:
• Mr Richard Mkumbo, Economist, Directorate of Policy and Planning (DPP), MOH
(Coordinator)
• Ms Mariam Ally, Economist, DPP, MOH
• Ms Neema Jamu, Economist, MOH
• Mr Kenny Lawson, Economist, DPP, MOH
• Mrs Masunga, Deputy Chief Accountant, MOH
• Mr Richard Shankango, Accounts Section, MOH
• Ms Sally Lake, Consultant
Two definitions of the sector are used throughout this document, as summarised in Table 1 below.
3
Throughout this document, the notation FYXX is used to refer to the financial year ending on 30 June 19XX or 20XX, eg FY02 refers to the period 1 July 2001 to 30 June 2002.
4
The document is henceforward referred to as MKUKUTA, the Kiswahili acronym for “Mkakati wa Kukuza Uchumi na Kuondoa Umaskini Tanzania.”
Table 1 Health sector definitions used in the FY05 PER update
Health sector definition
On-budget Recurrent and development, local and foreign budget and expenditure figures as reflected in official GOT estimates for:
• Vote 52 – Ministry of Health headquarters
• Vote 56 – PORALG (Project 5421 in development budget) • Vote 23 – NHIF subvention through Accountant General’s Office • Regions – Sub-votes 3001 Curative and 3002 Preventive
• LGAs – Sub-votes 5010 Health services, 5011 Preventive, 5012
Health centres and 5013 Clinics/dispensaries
Total As for on-budget, plus:
• Reported expenditures (or where no expenditure possible,
revenues) from cost-sharing within public health institutions (Health Service Fund, Community Health Fund and associated user fees, Drug Revolving Fund)
• External funding captured in MOF database but not within official
budget estimates
It should be noted that this excludes two areas: health-related spending in other Ministries, Departments and Agencies; and some of the spending which now appears under TACAIDS yet which can be seen as health-related expenditure. On the former, time constraints prevented collection and analysis of this data, while the latter is assumed covered under the cross-sectoral Public Expenditure Review update for HIV/AIDS. As last year, these definitions have been used in order to reflect the official government definitions of health as a priority sector, and it is envisaged that this will change in the future with the new approach under MKUKUTA.
1.2 Terms of Reference
No sector-specific Terms of Reference (TORs) were produced for the health sector PER update for FY05. Work undertaken was based on previous years outputs, together with the generic TORs provided by the PER Macro Group, and comments from individual development partners.
1.3 Process
As was the case the previous year, the process of updating the Health sector PER for FY05 was undertaken entirely in Dar es Salaam, through desk review, and data collection from relevant ministry departments and other agencies.
As has typically been the case, the process of obtaining much of the data was long and drawn out, with substantial gaps remaining at the end of December 2004. This was the case both in relation to information from within the MOH itself, and also to data from outside the MOH, eg on actual disbursements to local government authorities.
Recommendations to strengthen the process for the FY05 update were generally not acted upon. In light of the uncertainty regarding the process in future years, given the “cluster approach” within MKUKUTA, recommendations are reiterated in Section 5 as a means of maintaining updated information on health sector budgets and expenditures for internal sectoral purposes, and to feed into any future multi-sectoral PER.
1.4 Structure and contents of the report
1.4.1 Changes from PER update for FY04
Unlike previous years, this report has been prepared in isolation from the Budget Guideline submission, and is therefore not expected to feed greatly into budget preparation. It is indeed questionable whether this has actually been achieved in previous years. The sections on Future Costs and Revenues are therefore excluded, having been largely addressed in the Budget Guideline submission, and given the uncertainty regarding the nature and purpose of sectoral PER updates for FY05. The desire to more closely link the PER and budget/MTEF preparation processes in the future of course remains high on the agenda for the Ministry of Finance and other line ministries.
The aim of the health sector PER update for FY05 is to summarise key findings of a retrospective analysis of the sectoral budget and expenditure, and to propose areas for follow-up during the coming financial year. Where appropriate, implications of these findings for the coming budget preparation cycle will be highlighted.
1.4.2 Report structure
Section 2 begins with a review of the recommendations and follow-up on main findings of the PER update for FY04. It then continues with a review of the major trends in health budget and expenditure, using two main sources of data. Section 2.2 is based on Ministry of Finance aggregate sectoral data, and presents both absolute levels of spending, and examines the share of overall GOT budget assigned to Health. Sections 2.3 onwards use data collated specifically for the PER update from the disaggregated sources, ie individual council releases, MOH appropriation accounts etc. Section 2.3 itself examines sub-sectoral trends, based on the PER data, while Section 2.4 reviews budget performance over the past year. Section 2.5 updates analysis on the area of drugs and medical supplies specifically, and also adds a brief section on anti-retroviral drugs which are increasing in importance within the sectoral budget and expenditure.
Section 3 looks at the issue of local government budgets and expenditure in some more detail, covering the overall level and share of spending at the service delivery level, together with a summary of budget performance. The section also presents some data from councils’ own sources, highlighting variations in reported income and expenditure, and the need to strengthen such reports in order to maximise opportunities for improving financial information and performance.
Section 4 summarises sectoral performance, both as a priority sector and of the priority items within the sector, as well as presenting updated values of the financial indicators for the sectoral Performance Profile.
Section 5 summarises key findings from the preceding sections, and makes some recommendations for future action and emphasis.
Sources, notes and assumptions for each of the graphs and tables within this document are available at Annex A.
2 Recent trends in health sector expenditure
2.1 Review of previous PER studies
In order for the PER to serve its intended purpose, its conclusions and recommendations need to be agreed and acted upon in order to strengthen the future level and allocation of sectoral resources. This is the fifth consecutive PER exercise, and it is useful therefore to begin by reviewing the key findings and recommendations of the previous update in order to set the context for the analysis presented below. Main findings and recommendations of the FY04 health sector update, together with actions taken by the sector to address them where necessary, are therefore summarised in Table 2 below.
Table 2 Key findings and actions from health sector PER update for FY04
Finding/recommendation Action taken
Decline in the health sector share of overall GOT budget •
Lobbying by Development Partners at the Health Sector Review, and at the Development Partners Group Heads of Agency meeting, and by the MOH to Ministry of Finance contributed to a supplementary budget which resulted in a net increase to the sector ceiling both in nominal terms and in the sectoral share5. Failure to activate the agreed
high-level Joint Health Finance Committee during FY03/04
• This committee was activated in October 2004, and has met 3
times to date. Members include the Commissioner for Budget and the desk officer for Health from the Ministry of Finance, a representative from PORALG, the Director of Policy and Planning and other MOH officials, together with development partner representation. Deliberations have covered the development of TORs for the group, MKUKUTA in terms of the resource allocation framework, and the sector input to the Budget Guidelines for FY06.
More disaggregated work to be undertaken to determine complete breakdown between level of health system (central, local)
• Not done
Analysis of spending in at least two programmatic areas, at central and LGA levels, to be included in FY05 PER
• Not done due to non-inclusion in discussion of TORs and lack of
time during PER update exercise, together with delay in decision as to whether there should be a Health sector update as per PER Macro Group discussions.
MOH to take forward issue of falling Health share in LGA spending
• This is a broader issue than Health alone, and has not been
addressed. The additional work which the sector has undertaken in terms of strengthening district capacity merits further lobbying regarding this indicator.
Tracking study of local government spending (GOT, basket and other) to update the 2001 pro-poor tracking study
• Not done for the health sector, although one is planned for
spending on HIV/AIDS. Due in part to same reasons as above, ie desire for lighter exercise, and delay in decision re Health sector PER update.
No analysis undertaken of information on Health Service Fund – different sources of fee revenue and types of
expenditures
• Not done. Reiterated in this PER update. The planned Health
Financing Workshop to be held in May 2005 is expected to raise issues relating to cost-sharing with a view to reflecting on current mechanisms in place in the country, and the strengthening of health financing strategy in the future.
5
Nominal estimates included in the PER update for FY04 were TSh 197.2bn compared with Actual expenditure of TSh 218.2bn, an increase of almost over 10%. The original share of the FY04 budget was 7.6% (including CFS) and 9.0% (excluding CFS), while the final shares were 8.5% (including CFS) and 9.7% (excluding CFS).
Lack on information on the
CHF to be addressed •
No real improvement. Reiterated in this PER update. As above, it is expected that this will receive attention in the forthcoming Health Financing Workshop.
More detailed tracking study on the whole area of spending on drugs and supplies, at all levels, on and off budget
• Not done, in part for reasons as above. Reiterated in this PER
update due to importance for the sector in terms of service quality, accountability, and user satisfaction.
Need to firm up data on off-budget external funding •
Not done. Reiterated in this PER update. Improvement in timing of PER
necessary to enable it to perform its function of feeding into budget preparation
• Not possible this year due to confusion regarding whether an
update would be done at all. Some concern remains regarding MOH internalisation of the PER, despite agreement on its place as an input to the April Joint Health Review, with continued MOH failure to initiate data collection and other preparatory activities from July each year resulting in an unnecessarily rushed exercise. This should be discussed further for FY06 when the whole nature of the PER update will presumably change due to the cluster focus of the MKUKUTA.
Data constraints due to lack of follow-up during FY by MOH staff, and to unnecessary bureaucratic requirements of MOF/Treasury staff in releasing routine data should be addressed
• Not done. Same delays were experienced this year. In addition,
although there was greater readiness to supply electronic data, this contained inconsistencies and data gaps, and was not always an improvement on the hard copies. Routine in-year monitoring of releases and expenditures is recommended, together with acceptance by MOF of the public nature of such data. The PER Macro group should perhaps specify the need for the relevant data sections of the MOF to routinely provide the necessary information to line ministries for in-year and timely end of year monitoring of budget performance.
2.2 Total public health budget and expenditure
This section, unlike the data in Sections 2.3 onwards, uses official published GOT data to review sectoral performance in relation to the overall budget. As in previous years, different central level official sources reveal inconsistencies, and it has not been possible to unpack all the data to cross-check each component. The decision was therefore made to use the published figures from the October 2004 Budget Review produced by the Ministry of
Finance6 as these provided sufficient detail for the main analysis.
2.2.1 Health in relation to the total GOT budget
Health was identified as a priority sector within the first Poverty Reduction Strategy (PRS), and as such was expected to benefit from increases in both the absolute level of government funding, and in its share of the budget. Figure 1 below plots total on-budget spending on health as a percentage of total government spending over the past five years, together with the budgeted amount for the current financial year (FY). Figures are shown both inclusive
and exclusive of spending on the Consolidated Fund Services (CFS)7.
6
MOF (2004). Budget review: recent developments in budget execution and formulation. Dar es Salaam: October 2004
7
CFS largely comprises debt and interest payments (both domestic and foreign) which have first claim on national resources. The GOT budget excluding CFS is therefore used to define the ‘discretionary budget’ within which government has more scope to articulate its spending priorities.
Figure 1 Sectoral spending as a proportion of the total GOT budget, FY00 – FY05 8.7% 8.5% 8.9% 8.7% 8.0% 6.8% 10.1% 9.7% 10.4% 11.0% 10.6% 8.8% 0.0% 2.0% 4.0% 6.0% 8.0% 10.0% 12.0%
FY00 actual FY01 actual FY02 actual FY03 actual FY04 actual FY05 budget
Health as % total GOT (incl CFS) Health as % total GOT (excl CFS)
Source: MOF (2004), Table 2, p4
Figure 1 shows that there has been a slight increase in the Health sector share of the budget for FY05 compared with the outturn of the previous financial year (which was itself much improved during the course of the FY due to a supplementary budget and reallocations within the foreign development budget). The projected sectoral share of the total GOT budget excluding CFS for FY05 is 10.1%, representing a 0.4% increase on the outturn for FY04. This is encouraging, although it should be noted that it still falls short of the share achieved in the early years of the PRS, which according to this data had reached a high of 11% in FY02. It also falls short of the 15% Abuja commitment (although some relevant expenditure may be
covered under the priority sector of HIV/AIDS rather than Health)8.
When CFS is included, the share shows a slightly smaller increase, of only 0.2%, due to the
large rise in the value of CFS within the FY05 budget9.
2.2.2 Total on-budget health spending In nominal terms
As noted in Section 2.2.1 above, following the publication of the PRS the allocations to the sector initially increased in terms of share of total government spending before falling from FY02 to FY04, and lately rising again. While the nominal value of Health sector spending has increased consistently, the rate of growth has fluctuated in recent years, as shown in Figure 2 below.
8
Time did not permit an update of the analysis in the FY04 PER report which attempted to separate out spending on HIV/AIDS from the broader health sector total. This could be done subsequently if felt useful.
9
Figure 2 Nominal on-budget health spending and rate of growth, FY01 – FY05 100.7 142.1 186.7 218.2 290.4 -50.0 100.0 150.0 200.0 250.0 300.0 350.0
FY01 actual FY02 actual FY03 actual FY04 actual FY05 budget
T S h b n 0% 5% 10% 15% 20% 25% 30% 35% 40% 45% Nominal bgt/expd Year on year % growth
Figure 2 shows a steady increase in the nominal value of the health sector budget, rising 33% in FY05 from the FY04 outturn. As mentioned before, this outturn was substantially better than indicated in the initial FY04 budget figures, which had shown only 5% growth and were at a level of TSh197.2bn (see Figure 4 in PER update for FY04). The reallocation to the Health sector was in part due to lobbying from the MOH and development partners following the publication of the PER, and shows the potential use of such a review for ensuring that stated government priorities are borne out in budget formulation and execution. This increase appears to a large extent to have been driven by an increase in external spending in the sector. Although not entirely consistent, more disaggregated data also provided by the MOF indicates the following breakdown for FY04 and FY05, as shown in Figure 3.
Figure 3 Increase in nominal spending FY04 to FY05, by component (TSh bn)
50.36 55.94 83.06 98.04 27.32 7.14 59.39 101.95 18.54 6.54 -50.00 100.00 150.00 200.00 250.00 300.00 350.00 FY04 FY05 T S h b n Devt: Foreign Devt: Local Rec: Parastatal Wages Rec: OC
Rec: PE
Note: FY04 assumed to be actual expenditure, given that the figure is close to that in the MOF Budget Review. FY05 is budget. It should be noted that health basket funds are included here within the Foreign Development component.
Figure 3 shows that of the overall nominal increase from TSh217.9bn to TSh 290.4bn (ie TSh 72.49 bn), TSh 42.56bn, or 59% of this was due to an increase in the foreign development component of the FY05 budget. When shown in percentage terms, as in Figure 4 below, this increase is shown more clearly, with the share of this component increasing from 27.3% to 35.1%.
Figure 4 Changing component shares within the Health allocation, FY04 and FY05
23.1% 19.3% 38.1% 33.8% 8.5% 9.4% 3.0% 2.5% 27.3% 35.1% 0% 10% 20% 30% 40% 50% 60% 70% 80% 90% 100% FY04 FY05 Devt: Foreign Devt: Local Rec: Parastatal wages Rec: OC
Rec: PE
This is largely due to a substantial increase in the value of the health sector basket for FY05, due to the inclusion of funding under the World Bank Health Sector Development Project Phase II APL (an investment instrument that disburses to the sector directly). From FY06, this will in part shift to the Poverty Reduction Support Credit (ie general budget support), resulting in a fall in the Bank’s contribution to the basket of some US$20m. It is expected, as per the agreement with the World Bank, that the MOF allocations to the health sector will increase by at least this amount to compensate for the shift to GBS, and would therefore be reflected in the recurrent OC and PE budgets.
Figures 3 and 4 also show the small absolute value and the fall in the share of the local development budget, illustrating a concern raised in the 2004 PER Joint Evaluation Report
about the relatively low apparent priority given to development within the GOT budget10.
Other measures of health spending
Table 3 below presents a number of other useful measures of health expenditure and budget using the MOF data. Firstly, the equivalent figures in US dollar terms are given, in order to enable some comparison with other countries. Secondly, the per capita figures are presented, in both Tanzanian shilling and US dollar terms. Finally, by deflating by Consumer Price Index (CPI) in recent years, we can obtain a measure of real spending in the health
sector, ie taking account of general inflation in the country11. The allocation has therefore
been re-valued in FY01 prices, and is shown both in absolute and per capita TSh terms.
10
GOT/Development Partners (2004). Review of fiscal developments and budget management issues FY03 – FY04. Joint Evaluation Report presented at the Public Expenditure Review FY04 consultative meeting, Dar es Salaam, 14 May 2004 (p11).
11
The official Tanzanian Consumer Price Index was re-weighted and re-based on 2001 prices during FY04, and the figures for FY04 and FY05 are taken from the inflation rate based on the new CPI. The deflator used in this report was calculated separately for the two periods FY01 – 03 and FY04 – 05, and although there is therefore a break in series, this is not expected to significantly affect the figures.
Table 3 Additional measures of spending, MOF on-budget data FY01 – FY05
FY01 actual FY02 actual FY03 actual FY04 actual FY05 budget
Nominal (TSh bn) 100.7 142.1 186.7 218.2 290.4 in US $ million 120.9 152.1 186.5 202.5 271.2 Per capita TSh 3,109 4,256 5,424 6,150 7,939 Per capita US$ 3.73 4.56 5.42 5.71 7.42 In real terms ( TSh bn, FY01 prices) 100.7 135.6 170.6 192.0 245.3 Per capita TSh 3,109 4,060 4,957 5,412 6,707
CPI deflator 100 104.8 109.4 113.6 118.4
US$ exchange rate 833 934 1,001 1,078 1,071 Population 32,391,792 33,390,850 34,420,722 35,482,358 36,576,738 Note: break in series of CPI/inflation deflator from FY04
The data in Table 3 show a far more positive picture than that in the FY04 PER update, with positive trends in all indicators. Notably, whereas last year the data showed a reduction in the per capita US$ value, this update shows that the budgeted figures at least represent a substantial jump, from US$5.71 to US$7.42 per capita, ie an increase of 30%. The real value of the FY05 budget is also substantially higher than the budget outturn for FY04, by almost 28%.
2.2.3 Trends in overall public health expenditure
The data in the section below is compiled as part of the PER process, rather than taken from central government sources, and as such, differs in a number of respects which are either commented on in the text, or in Annex A on data sources and assumptions.
Table 4 below shows the combined estimates for on and off-budget public health spending in Tanzania over the past four years, and includes both external finance not captured within the official Treasury sources, and cost-sharing at public health facilities. These two sources are both subject to concern regarding the quality and completeness of data, but are presented in order to provide a more comprehensive picture.
Table 4 Total health expenditure in Tanzania, FY02 – FY05 (TSh billion)
2001/2002 2002/2003 2003/04 2004/05
Budget Actual Budget Actual Budget Actual Budget
Recurrent AGO 8.97 5.29 6.92 5.53 6.62 10.56 10.12 MOH 61.60 58.99 82.16 72.32 87.47 87.08 138.99 Region 7.06 6.58 7.86 7.82 12.06 11.90 9.68 Local Govt 46.26 46.28 57.66 57.48 66.14 63.77 82.26 Total rec. 123.89 117.15 154.60 143.14 172.28 173.31 241.04 Development MOH 32.07 21.12 34.07 29.03 42.28 41.44 56.69 PORALG 0.34 0.34 0.68 Regions 2.35 1.28 4.99 2.48 3.19 2.70 9.38 Local Govt 1.70 1.45 1.75 1.70 2.31 2.32 5.02 Total devt 36.12 23.86 40.80 33.21 48.12 46.79 71.77 Total on budget 160.01 141.01 195.40 176.36 220.40 220.10 312.81 Off budget expenditure
Cost sharing 1.24 1.67 1.67 7.48 7.48
Other foreign funds 66.14 79.37 49.25 59.11 68.99 82.79 132.86
Total off budget 66.14 80.61 49.25 60.77 70.66 90.27 140.33 Grand total 226.16 221.62 244.66 237.13 291.06 310.37 453.15 Source: MOH PER data FY05
Notes: AGO spending on NHIF. PORALG spending on PHC rehabilitation administration costs (actual rehabilitation included under Local Govt). Basket funding included as recurrent or development as appropriate.
Table 4 shows a substantial jump in the total health sector resource envelope for FY05 rising by 56% both in terms of year on year budget and 46% when compared with the actual
outturn for FY04. When the on-budget component of this is considered, the increase is still considerable, at 42% compared both with the FY04 budget and in relation to FY04 outturn. Major drivers of this increase are seen both in the recurrent and development components, with a significant increase in MOH recurrent spending which is the largest single element both within the on-budget and total figures, at 44% and 31% respectively. This rose by 60% compared to the FY04 outturn due in large part to the substantial increase in the health basket funding for the FY, and to an increased GOT allocation in part to cover ARVs and other HIV/AIDS spending within the sector. Significant real increase is also seen in the allocation to LGAs which account for the second largest element within the on-budget component, and which are projected to increase by 29% on the FY04 actual.
Within the development budget, MOH accounts for the largest share, at 18% of the on-budget and 12.5% of the total envelope, and is also expected to increase by 37% on last year’s outturn. PORALG shows a percentage increase of almost 100%, but from a very low base, with the continuation of funding for administrative costs of the rehabilitation of PHC facilities. Inclusion of the budget for the actual rehabilitation work at the LGA level has contributed to the 118% increase in the development budget at this level.
The largest element of the off-budget component is external funding at 29% of the total resource envelope. Although, as noted above, there are concerns regarding the quality of this data, the 93% increase in budgeted funds is presumably relatively reliable as it is based on development partner submissions to the MOF through MOH. Comparison with actuals is less worthwhile given known data problems.
Table 5 shows various other measures of the overall sector resource envelope for the past four years, using the same deflators as in Table 3 above.
Table 5 Additional measures of spending, overall MOH PER data FY02 – FY05
FY02 actual FY03 actual FY04 actual FY05 budget
Nominal (TSh bn) 221.6 237.1 310.4 453.1 in US $ million 237.3 236.9 288.0 423.2 Per capita TSh 6,637 6,889 8,747 12,389 Per capita US$ 7.11 6.88 8.12 11.57 In real terms ( TSh bn, FY01 prices) 211.4 216.7 273.1 382.8 Per capita TSh 6,331 6,296 7,698 10,466 CPI deflator 104.8 109.4 113.6 118.4
US$ exchange rate 934 1,001 1,078 1,071
Population 33,390,850 34,420,722 35,482,358 36,576,738
Unsurprisingly, this confirms the substantial rise in the envelope for FY05, with the 46% increase in the nominal value still representing a healthy 40% increase in the real value, ie from TSh 273.1bn to TSh 382.8bn. In nominal per capita US$ terms, the increase is again significant, up by 43% from US$8.12 to US$ 11.57, while in real TSh per capita terms, the increase is 36%.
2.3 Sub-sectoral trends in budget and expenditure
This section examines in more detail some of the sub-sectoral trends in health spending over recent years, again using the data collated for the PER.
2.3.1 Recurrent and development spending
Table 6 shows the on-budget split between recurrent and development spending in recent years. Lack of information on where off-budget funds are spent precludes their inclusion in
the analysis although it is likely that many cost-sharing revenues boost recurrent spending, while much external funding would be considered development spending. However, the table concentrates on the official GOT estimates and accounts.
Table 6 Breakdown between recurrent and development spending, FY00 – FY04
Budget Actual
FY02 FY03 FY04 FY05 FY02 FY03 FY04
Recurrent 77% 79% 78% 77% 83% 81% 79%
Development 23% 21% 22% 23% 17% 19% 21%
Table 6 shows that the allocation between the recurrent and development components of the budget has remained largely stable over the past four years, with recurrent accounting for between 77% and 79%. Actual recurrent expenditure for FY04 continued the downward trend seen in the previous two FYs, falling from 83% in FY03 to 79% in FY04, and as such was closer to the budgeted figures than in earlier years. This may be due to improved planning and disbursement of development funds, particularly foreign project funding (see also Section 2.4.1 on budget performance).
2.3.2 Domestic and foreign spending
The split between domestic and foreign spending is of interest due to concerns regarding the predictability and sustainability of external assistance over the longer term, and also in terms of dependency and national sovereignty. With the move by an increasing number of development partners to GBS, whether through grant or loan funding, this distinction becomes less clear with an increasing share of the domestic budget actually reliant on such budget support. The distinction in Table 7 below therefore reflects only earmarked foreign sectoral support, ie through the health basket (captured in both the recurrent and development budgets as appropriate) and on-budget development project funding as reflected in official GOT estimates and account. For the off-budget component, cost-sharing revenues/expenditures are considered as domestic funding.
Table 7 Public health spending, by funding type (TSh billion)
2001/2002 2002/2003 2003/04 2004/05
Budget Actual Budget Actual Budget Actual Budget Recurrent Domestic funds 100.60 95.58 121.34 110.87 153.11 154.13 187.82 Foreign funds 23.29 21.57 33.26 32.27 19.18 19.18 53.22 Total rec. 123.89 117.15 154.60 143.14 172.28 173.31 241.04 Development Domestic funds 5.34 5.04 6.12 5.43 6.45 6.45 7.23 Foreign funds 30.79 18.82 34.68 27.78 41.67 40.34 64.54 Total devt 36.12 23.86 40.80 33.21 48.12 46.79 71.77 Total on budget 160.01 141.01 195.40 176.36 220.40 220.10 312.81 Off budget expenditure
Domestic funds 1.24 1.67 7.48 7.48
Foreign funds 66.14 79.37 49.25 59.11 68.99 82.79 132.86
Total off budget 66.14 80.61 49.25 60.77 68.99 90.27 140.33 Grand total 226.16 221.62 244.66 237.13 289.39 310.37 453.15
Source: MOH PER data
Table 7 indicates that as in previous years, domestic funding (including GBS) drives the recurrent budget, while foreign funding is the major source of development spending. It is worth noting, although subject to many caveats (see Section 2.3.5 for details of estimation method), that the potential contribution of cost-sharing could exceed that of domestic development funding for the first time in FY05, which both reflects the low level of
priority given to domestic funding for development, and the gradual increase in contribution of cost-sharing to the sectoral resource envelope.
Figure 5 shows the split between foreign and domestic funding (including GBS) for the on-budget component of the health sector resource envelope in recent years.
Figure 5 On-budget share of domestic and foreign funding, FY02 – FY05
66.2% 65.2% 72.4% 62.4% 71.4% 65.9% 73.0% 33.8% 34.8% 27.6% 37.6% 28.6% 34.1% 27.0% 0% 10% 20% 30% 40% 50% 60% 70% 80% 90% 100%
FY02 FY03 FY04 FY05 FY02 FY03 FY04
Budget Actual
Foreign Domestic
Figure 5 shows a return in FY05 to the trend towards a rising share of foreign funding within the total on-budget resource envelope, following the temporarily reversal in FY04 (due to the move by DfID to GBS), with a 10% year on year budget increase in the foreign share. However, this may also be seen as temporary due to the definitional capture of World Bank funding in FY05. The picture in terms of actual expenditure mirrors that of budget.
Figures 6 and 7 below show in more detail the role of foreign funds in the increasing sectoral budget in recent years (in nominal terms), Figure 6 presenting the absolute level of spending by type/source, and Figure 7 showing the percentage shares.
Figure 6 Role of foreign funds in increased (nominal) sectoral budgets FY02 - FY05 (TSh bn) 105.94 127.46 159.56 195.04 29.15 37.11 26.05 70.93 24.93 30.83 34.80 46.83 -50.00 100.00 150.00 200.00 250.00 300.00 350.00
FY02 FY03 FY04 FY05
T S h b n Other foreign Basket GOT