DAGViz: A DAG Visualization Tool for Analyzing
Task-Parallel Program Traces
An Huynh
University of Tokyo Tokyo, Japan[email protected]
Douglas Thain
University of Notre Dame Notre Dame, IN, United States
[email protected]
Miquel Pericàs
Chalmers University of Technology Göteborg, Sweden[email protected]
Kenjiro Taura
University of Tokyo Tokyo, Japan[email protected]
ABSTRACT
In task-based parallel programming, programmers can ex-pose logical parallelism of their programs by creating fine-grained tasks at arbitrary places in their code. All other bur-dens in the parallel execution of these tasks such as thread management, task scheduling, and load balancing are han-dled automatically by runtime systems. This kind of paral-lel programming model has been conceived as a promising paradigm that brings intricate parallel programming tech-niques to a larger audience of programmers because of its high programmability. There have been many languages (e.g., OpenMP, Cilk Plus) and libraries (e.g, Intel TBB, Qthreads, MassiveThreads) supporting task parallelism. How-ever, the nondeterministic nature of task parallel execution which hides runtime scheduling mechanisms from program-mers has made it difficult for programprogram-mers to understand the cause of suboptimal performance of their programs. As an effort to tackle this problem, and also to clarify differ-ences between task parallel runtime systems, we have de-veloped a toolset that captures and visualizes the trace of an execution of a task parallel program in the form of a directed acyclic graph (DAG). A computation DAG of a task parallel program’s run is extracted automatically by our lightweight portable wrapper around all five systems which incurs no intervention into the target systems’ code. The DAG is stored in a file and then visualized to analyze per-formance. We leverage the hierarchical structure of the DAG to enhance the DAG file format and DAG visualization, and make them manageable even with a huge DAG of arbitrar-ily large numbers of nodes. This DAG visualization provides a task-centric view of the program, which is different from other popular visualizations such as thread-centric timeline
Permission to make digital or hard copies of all or part of this work for personal or classroom use is granted without fee provided that copies are not made or distributed for profit or commercial advantage and that copies bear this notice and the full citation on the first page. To copy otherwise, to republish, to post on servers or to redistribute to lists, requires prior specific permission and/or a fee.
Copyright 20XX ACM X-XXXXX-XX-X/XX/XX ...$15.00.
visualization and code-centric hotspots analysis. Besides, DAGViz also provides an additional timeline visualization which is constructed by individual nodes of the DAG, and is useful in coordinating user attention to low-parallelism areas on the DAG. We demonstrate usefulness of our DAG visual-izations in some case studies. We expect to build other kinds of effective visualizations based on this computation DAG in future work, and make DAGViz an effective tool support-ing the process of analyzsupport-ing task parallel performance and developing scheduling algorithms for task parallel runtime schedulers.
Keywords
task parallel; performance analysis; profiler; tracer; DAG visualization
1.
INTRODUCTION
Due to fundamental physical constraints such as power consumption and heat dissipation, the development of com-puter hardware has changed from increasing clock speed of a single-core CPU to integrating increasingly more cores in a multi-core CPU [2]. Recently emerging architectures, such as Intel’s Many Integrated Core (MIC) which com-bines many smaller lower-performance cores on the same chip area, may potentially lead to a highly parallel era of shared-memory computer hardware. This highly parallel hardware will make it harder for programmers to program parallel software using common parallel programming mod-els such as SPMD (e.g., MPI) and native threading libraries (e.g., POSIX Threads) which involve programmers in deal-ing with low-level details of thread management, task schedul-ing, load balancschedul-ing, etc.
Task parallel programming models release programmers from such low-level concerns by shifting these burdens to the runtime systems. In task parallel programming, pro-grammers just need to expose logical parallelism in their programs by creating fine-grained tasks, each of which is a work unit that can be executed in parallel with the rest, at arbitrary places in their code (including recursion). These tasks are scheduled to execute in parallel dynamically by the runtime system. As a result, programmers can concentrate
better on the algorithmic aspect of the programming. How-ever, this automation and nondeterminism of task parallel models also removes a great deal of performance out of the programmers’ control. The same task parallel program ex-ecuted by different runtime systems could possibly present significantly different performance. And programmers often lack clues to understand why their programs perform badly. Common analysis methods such as hotspots analysis and timeline visualization are not sufficient for task parallel pro-grams. Hotspots analysis which shows functions that con-sume the most CPU time is useful in analyzing sequential ex-ecution but fails to pinpoint concurrency bottlenecks in par-allel execution. Timeline visualization (a.k.a. Gantt chart) which displays thread activities in the course of the execu-tion is thread-centric and not sufficient for task parallel pro-grams which have dynamic scheduling characteristics and nondeterminism in where tasks are executed. Comparing runs of the same task parallel program is more consistent when we compare them based on their common logical task structure. For that reason, our approach is to measure and extract the computation directed acyclic graph (computa-tion DAG) from a task parallel execu(computa-tion, which records rel-evant runtime behaviors based on the program’s logical task structure (DAG), and visualize it for the performance anal-ysis purpose. In our toolset, the measurement part (DAG Recorder) extracts the DAG during the execution and stores it in a file, while the visualization part (DAGViz) visualizes the DAG and provides visual supports for analyzing perfor-mance.
We define a generic task parallel computation model that DAG Recorder can extract a DAG from. This model basi-cally includes only two task parallel primitives of task cre-ation and task synchronizcre-ation. We build a simple macro wrapper that translates these generic primitives to their equivalents in five separate systems that are currently sup-ported: OpenMP [12], Cilk Plus [7], Intel TBB [13], Qthreads [20], and MassiveThreads [10] [9]. The details of this generic model will be discussed in Section 2. Programmers write task parallelism using our generic model and their code can get translated automatically to these five systems. We ex-tract the DAG by instrumenting this wrapper to invoke DAG Recorder’s measure code at appropriate positions. These instrumentations are done automatically in the wrapper, re-quiring neither more work from users nor any intervention into supported parallel runtimes. Hence, although our pro-filing method requires users to rewrite their code using our generic primitives and re-compile it with our wrapper and DAG-recording libraries, the rewriting work is kept to a min-imum that is just replacing primitives and what the users gain is that their code can run with five (and more) different systems that our wrapper library supports, and their code can also be profiled/traced seamlessly by our tools.
In the DAG, nodes represent sequential computations and edges represent dependencies between nodes. Nodes are grouped hierarchically such that a collective node contains in it a subgraph of other collective nodes and leaf nodes which contain no subgraph. Thus, the initially only collective node representing the whole application can get expanded step by step into subgraphs of increasing depths and finally be-come the full graph of only leaf nodes. Higher-level collec-tive nodes hold aggregate performance information of their inner subgraphs while leaf nodes hold the performance infor-mation of their corresponding sequential code segments. We
leverage this hierarchical structure of DAG in its storage file format and visualization techniques to make our tools man-ageable even with a huge DAG of arbitrarily large numbers of nodes (Section 3). By loading and displaying DAG with on-demand levels of details, we can avoid loading the whole big DAG file into memory at once, but need to load only a fraction of DAG file corresponding to the visible part of the DAG on screen.
With DAG visualization we are able to make all nodes of a DAG visual and interactive on the screen. While impor-tant, this by itself is not enough since a DAG with up to thousands of nodes is already too large for users to compre-hend. Therefore, supportive statistical analyses and other kinds of general visualizations are needed to direct users to trouble areas in a huge DAG. Our tool currently provides an additional timeline visualization which is constructed by individual nodes of the DAG, and is useful in coordinating user attention to low-parallelism areas on the DAG (Section 4). We demonstrate usefulness of these visualizations in two case studies of Sort and SparseLU programs (Section 5). We are working on other kinds of useful visualizations based on computation DAG, among other things, with the prospect of making our toolset an effective platform supporting the pro-cess of analyzing task parallel performance and developing scheduling algorithms for task parallel runtime schedulers.
2.
COMPUTATION MODEL
In this section, we describe the generic task parallel model that our toolset can extract a computation DAG from, and how other models get translated into our generic one. In our generic model, a program starts as a single task performing its main function. A task can execute ordinary user com-putation, which does not change the program’s parallelism, and additionally other task parallel primitives, which can change the program’s parallelism. These primitives are fol-lowing three semantics:
CreateTask: The current task creates a new child task.
WaitTasks : The current task waits for all tasks in cur-rentsection, explained below, to finish. This primitive also terminates the current section.
MakeSection : This primitive is used to mark the cre-ation of a section inside a task or another section. A section is defined as a synchronization scope which is ended by a
WaitTasksprimitive and all tasks created inside it get syn-chronized all together by thatWaitTasks. The purpose of section notion is to support a task that waits for a subset of its children. Our generic model supports sections that are either nested or disjoint, but must not intersect.
Task parallel primitives of OpenMP and Cilk Plus models can be translated to our model straightforwardly. Thetask andtaskwaitpragmas in OpenMP are replaced byCreateTask andWaitTasksrespectively. Thecilk spawn andcilk sync in Cilk Plus are also replaced byCreateTaskandWaitTasks
respectively. In addition, however, a task pragma and a spawn operation perform an additionalMakeSection op-eration if the current task has no open section.
Intel TBB model is more flexible than our generic one. The section notion is represented bytask groupclass in Intel TBB. A task is created by callingrunmethod of atask group object, and a call to atask groupobject’swaitmethod would synchronize all tasks created by that object’srun method. One can choose an arbitrary subset of children of a task to synchronize in Intel TBB by creating these children with
the sametask groupobject, whereas our generic model does not allow intersected task subsets, and a new section is opened only when the previous section has been closed. Ex-cept this restriction, Intel TBB code can be translated into our model by replacingtask group.run withCreateTask, task group.wait with WaitTasks, and task group object’s declaration withMakeSection.
Qthreads and MassiveThreads are both lightweight thread libraries that expose a POSIX Threads-like interface: one function call to create a task and one function call to syn-chronize a task of choice. They are as flexible as Intel TBB and translating them to our generic model is imposed with the same restriction.
We have built a lightweight macro wrapper that translates code written with our generic model to these five systems automatically. Hence, by writing code once users can get five separate executables for five systems. Beside these five systems, our toolset can be extended easily to support any other task parallel system that can conform to our generic model.
3.
DAG STRUCTURE
We instrument measure code in the macro wrapper implic-itly (requiring no work from users) so that DAG Recorder can get invoked at appropriate positions to record the DAG. Specifically, we instrument at following six positions: the beginning and the end ofCreateTask, the beginning and the end ofWaitTasks, right before and right after invok-ing the child task inCreateTask. These instrumentations are put as near the program code as possible with the pur-pose of capturing the transitions out of the program code and back into the program code. As a consequence, work of the program (i.e., total execution time on all workers of the program code) is broken down into sequential intervals each of which corresponds to a seamless code segment containing no task parallel primitive in the program code and executes uninterruptedly on one worker (core). Although such a se-quential interval always happens entirely on a single worker, two consecutive ones separated by a task parallel primitive may take place on two different workers. This is because the execution control is always given back to the runtime system at task parallel primitives where a task migration, among other runtime mechanisms, may happen and change the worker that executes the next interval.
An executionintervalis modeled as anodein the exe-cution’s computation DAG. A node (interval) starts either by the first instruction of a task or the instruction imme-diately followingCreateTaskor WaitTasks, and it ends either by the last instruction of a task or an instruction im-mediately beforeCreateTaskorWaitTasks. We classify nodes into three kinds by the ways how they end. A node ends by calling CreateTask primitive is of create kind, ends by callingWaitTasks primitive is ofwait kind, and ends by the last instruction of a task is ofendkind.
An edge in the DAG represents the dependency be-tween two nodes that it connects. In other words, an edge is one reflection of a task parallel primitive in the program’s ex-ecution. There are three kinds of dependencies that an edge can represent: creation,continuation, and synchronization. A node ended by aCreateTask primitive has a creation dependency with the first node of the new task. Two nodes of two contiguous code segments in the program separated by a task parallel primitive have continuation dependency.
E
C
create wait endB
E
C
B
create cont. create wait cont. sync task sectionD()
D()
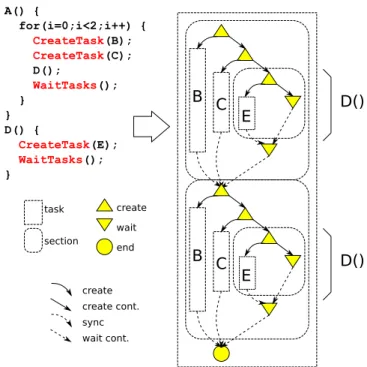
A() { for(i=0;i<2;i++) { CreateTask(B); CreateTask(C); D(); WaitTasks(); } } D() { CreateTask(E); WaitTasks(); }Figure 1: An example task parallel program and its DAG. The whole execution is originally the onlytasknode which is expanded into twosections and oneend. The twosections are further expanded into two similar inner topologies as they are two iterations of the samefor loop.
This continuation dependency can be divided further into create cont. and wait cont. based on the task parallel prim-itive intermediating the two code segments. The last node of a task has synchronization dependency with the node of the code segment following the WaitTasks primitive that synchronizes that task.
The recursive task creation and nested synchronization scope in the program code are reflected on the DAG by col-lective nodes of two kinds: taskandsectionwhich contain in them subgraphs of leaf nodes (create, wait, end) and other nested collective nodes. A node of kind task corre-sponds to a task in the program code, it can contain zero, one or moresectionnodes before ending by anendnode. The sectionnode kind corresponds to the section notion in our generic model. Asectionnode contains one or morecreate nodes along withtasknodes that thesecreatenodes spawn, and zero or more nestedsectionnodes, before ending by a wait node. All those child tasknodes of the sectionare synchronized by its endwaitnode and are connected to the successor node of thesectionon the DAG by synchroniza-tion edges. The section’s endwaitnode is also connected to the successor node but by a wait cont. edge. Figure 1 shows an example task parallel program and an illustration of its corresponding DAG.
At measurement points, beside code position (file name, line number) DAG Recorder also records time and current worker (core) so that we can know when and where a node starts and ends. Each nodevin the DAG is augmented with information such as start time (v.start), end time (v.end), the worker (v.worker) on which the node was executed, the start and end locations of the corresponding code segment. In case of collective nodes, DAG Recorder additionally stores aggregate information about their inner subgraphs. Two
important items of aggregate information are the total work, total work(u) =∑
v∈u
(v.end−v.start)
and the critical path length of the subgraph. For any sub-graph that was executed wholly on a single worker (i.e., there is no work stealing or task migration inside it), DAG Recorder can abolish the subgraph, retain only the collective node (without its inner topology) and its aggregate infor-mation. This automatic collapsing technique is optionally conducted on-the-fly during the measurement, and signifi-cantly useful in making DAG Recorder scalable because the size of the computation DAG now does not scale with the number of task creations anymore but with the number of task migrations (i.e., work stealing).
4.
DAG VISUALIZATION
Different from code-centric hotspots analysis and thread-centric timeline visualization, DAG visualization provides a task-centric view of the execution which is the logical task structure of the program. This logical task structure is more familiar from the programmer’s perspective, and consistent regardless of runtime schedulers, hence it is fit for the need to compare executions based on different runtimes to clarify the subtle differences between them and between scheduling policies for the purpose of developing scheduling algorithms. DAG Recorder flattens the computation DAG to a file as a sequence of nodes when the execution ends. In the sequence, a create node holds an offset pointing to the child task node that it spawns. A taskor a section node will hold an offset pointing to the subsequence of nodes of its inner subgraph. DAGViz memory-maps the file, which lazily loads only the accessed parts of the file into memory rather than the whole file at once. The visualization is also organized hierarchically with on-demand expansion/contraction. This hierarchical approach helps reducing stress on the memory even with huge DAG(s). DAGViz is built with GUI based onGTK+ widget library [16], and canvas rendering based onCairo vector graphics library [15].
4.1
Hierarchical Layout Algorithm
DAGViz traverses the DAG recursively from its roottask node to a user-adjusted on-demand depth limit. At each traversal step, DAGViz proceeds next to these three direc-tions in turn: the inner subgraph of current node (inward), the leftward subgraph following the creation edge (if the current node is acreate), and the rightward subgraph fol-lowing the continuation edge. In order to assign absolute (x, y) coordinates to every node, DAGViz needs to make two passes over the graph. At the first pass, it calculates in a bottom-up fashion the bounding boxes of three sub-graphs (inner, leftward, and rightward) around every node. At the second pass, DAGViz assigns absolute coordinates to all nodes in a top-down fashion. At each traversal step from the root node down to leaf nodes, it assigns coordinates to the current node first before aligning three subgraphs (and all nodes inside) around it to their absolute coordiates based on their calculated bounding boxes. The roottasknode is first assigned with (0,0) coordinates.
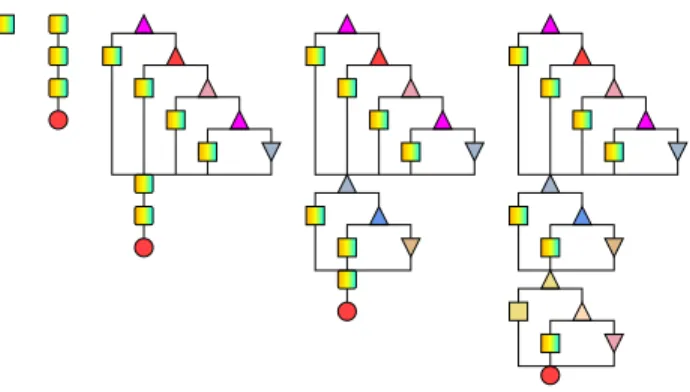
Figure 2 shows visualizations of the DAG extracted from an execution of Sort program. Node color represents the worker that has executed the node. The mixed color (of orange, yellow, and cyan) indicates that the node’s subgraph
Figure 2: Sort’s DAG(s) at depth 0 (first), 1 (second) and 2 (later 3). The DAG initially has only one node (the left most), from left to right it shows the DAG’s hierarchi-cal expansion. The original node gets expanded into three sections and oneend, then the firstsectiongets expanded, and the second and the third ones.
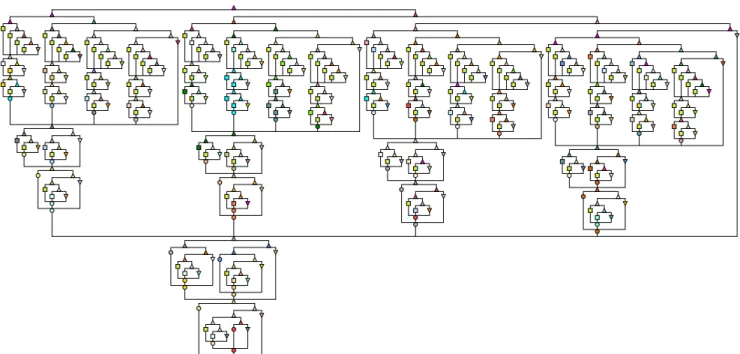
was executed collectively by multiple workers rather than a single one. Figure 3 shows the same DAG that has been expanded to depth 6 while the full DAG has max depth of 66 and contains dozens of thousands of nodes.
On DAGViz’s GUI, users can interact freely with the DAG by panning it around to any part and zooming in or out at any part to enlarge or reduce that part of the graph infinitely (this is achieved largely by vector graphics feature ofCairo). Moreover, the DAG is not a static picture on screen but it can be expanded at once to any depth level of choice, or users can choose to expand it partly into any direction by click-ing on any node to make it expanded. The expansion and contraction are enhanced with animation by gradual tran-sitions between a collective node and its inner subgraph’s topology so that these graph transformations look beautiful and importantly natural to the user perception.
4.2
Timeline with Parallelism Profile
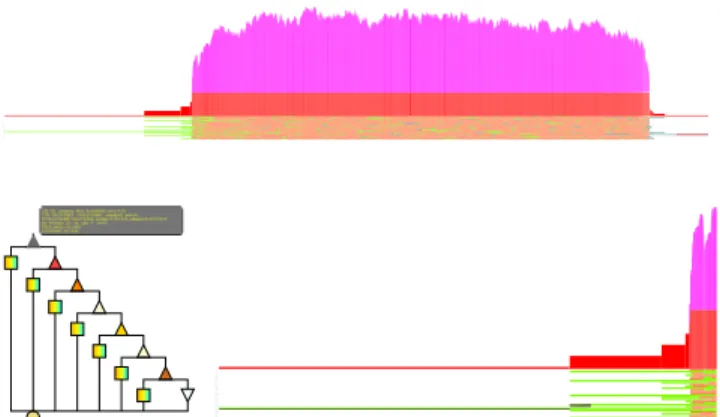
The layout algorithm of the DAG can be modified a lit-tle to produce a timeline view of the execution. In timeline view the x-axis is the time flow and y-axis consists of a num-ber of rows each of which corresponds to one worker thread. The rows contain boxes representing work that workers were doing at specific points in time during the program’s execu-tion. Each node of the DAG becomes a box in the timeline, so its y coordinate is fixed based on its worker number. The node’s x coordinate is calculated based on its start time, and its length is based on its work (=v.end−v.start). Be-sides, DAGViz also draws a parallelism profile along with and placed right above the timeline. In Figure 4, the lower part consisting of 32 rows is the timeline, the upper part (from red area upward) is the parallelism profile of the exe-cution which is the time series of actual and available par-allelisms of the execution:
Time series of actual parallelism(red part): is the num-ber of tasks actually running at every point in time. Actual parallelism at timet, denoted byPactual(t), can be obtained by:
Pactual(t) =∑
v∈V
running(v, t)
Figure 3: Sort’s DAG expanded to depth 6 with less than 500 nodes but overwhelming already. While at max depth of 66 it contains up to dozens of thousands of nodes.
running
end create contcreate wait cont
Worker 0Worker 1Worker 2Worker 3Worker 4Worker 5Worker 6Worker 7Worker 8Worker 9Worker 10Worker 11Worker 12Worker 13Worker 14Worker 15Worker 16Worker 17Worker 18Worker 19Worker 20Worker 21Worker 22Worker 23Worker 24Worker 25Worker 26Worker 27Worker 28Worker 29Worker 30Worker 31
Figure 4: Sort’s timeline is the lower part consisting of 32 rows. Sort’s parallelism profile is the upper part consisting of a red area (actual parallelism) and stacked-up areas of other colors (different kinds of available parallelisms).
vis running at timetand 0 otherwise. Formally,
running(v, t) = {
1 ifv.start≤t≤v.end 0 otherwise
Time series of available parallelism (upper parts of other colors): is the number of tasks ready to run but not ac-tually running at every point in time. Available parallelism at timet,Pavail(t), can be obtained by:
Pavail(t) =∑
v∈V
ready(v, t)
where ready(v, t) is 1 if all ofv’s predecessors have been fin-ished at timetbutvhas not been started; and 0 otherwise.
0 0.5 1 1.5 2 2.5
alignmentfft fib floorplanhealth nqueenssort sparselustrassenuts
time (sec)
w/o DAG Recorder w/ DAG Recorder
Figure 5: DAG Recorder’s overhead in running programs in BOTS with MassiveThreads on 32 cores
Formally,
ready(v, t) =
1 ifu.end< t < v.startfor all u→v
0 otherwise
5.
CASE STUDIES
We have measured DAG(s) of all ten programs in the Barcelona OpenMP Task Suite (BOTS) [4] with five task parallel runtime systems DAG Recorder currently supports: OpenMP, Cilk Plus, Intel TBB, Qthreads and MassiveThreads. The overhead of DAG Recorder with MassiveThreads li-brary is shown in Figure 5. Except for particular cases of Health and UTS programs which create too many fine-grained tasks, DAG Recorder is feasible for all other pro-grams with overhead within 10% of the original program’s runtimes.
0 0.2 0.4 0.6 0.8 1
alignmentfft fib floorplanhealth nqueenssort sparselustrassenuts
utilization
utilization with 32 cores cilkplus
mth ompqth tbb
Figure 6: Utilizations of BOTS run by 5 systems on 32 cores
We show a summary of the utilizations (= speedup/cores) on 32 cores of the benchmarks with five systems in Figure 6. Each dot represents the utilization of an execution of a pro-gram by a system; the higher it is, the better. Among many cases of our interest, we look into two of them here. First, Sort’s speedup is poor in all systems, which suggests that the program’s code is the cause of performance bottleneck. The other case is SparseLU, as it is a peculiar case in which Cilk Plus’s scalability is poorer than other systems, while Cilk Plus performs well in most other benchmarks.
5.1
Sort
Sort program sorts a random permutation of n 32-bit numbers with a parallel variation of mergesort [4]. The input array is divided into smaller parts which are sorted recur-sively before being merged, also recurrecur-sively, to become the sorted result array. In the algorithm, the recursive parallel merge is turned to simple sequential memory copy when-ever the smaller array in the two arrays of the merge is empty. This condition (the smaller array is empty) does not always guarantee that the larger array is sufficiently small; but contrarily, the larger array might be very large, making the sequential memory copy operation costly. This trivial condition itself causes the lack of available parallelism ac-companied with many long-running tasks at the stage near the end of the execution in Figure 4. By replacing this se-quential memory copy with a version of parallel memory copy, the lack of parallelism in merging phase was fixed.
Similar to Sort, Strassen is another example where per-formance suffers from the lack of parallelism. The timeline of Strassen program in Figure 7 shows that the program’s parallelism is very low near the start. By zooming in and relating the long running box with DAG structure, we iden-tified the code segment which enforced this low parallelism situation.
5.2
SparseLU
SparseLU program computes an LU matrix factorization over sparse matrices [4]. DAG visualization of SparseLU (Figure 8) and its source code both show that it has a se-rial loop creating very many tasks, none of which recursively creates further tasks. Therefore, the program’s parallelism increments one only after each iteration of the loop. The comparison of DAG(s) from Cilk Plus and Intel TBB in Fig-ure 9 expresses a noticeable difference between two systems. All nodes along the spine in Intel TBB’s DAG (left one) are executed together by the same worker (of orange color),
running end
create create cont
wait cont
Worker 0Worker 1Worker 2Worker 3Worker 4Worker 5Worker 6Worker 7Worker 8Worker 9Worker 10Worker 11Worker 12Worker 13Worker 14Worker 15Worker 16Worker 17Worker 18Worker 19Worker 20Worker 21Worker 22Worker 23Worker 24Worker 25Worker 26Worker 27Worker 28Worker 29Worker 30Worker 31
Worker 0Worker 1Worker 2Worker 3Worker 4Worker 5Worker 6Worker 7Worker 8Worker 9Worker 10Worker 11Worker 12Worker 13Worker 14Worker 15Worker 16Worker 17Worker 18Worker 19Worker 20Worker 21Worker 22Worker 23Worker 24Worker 25Worker 26Worker 27Worker 28Worker 29Worker 30Worker 31
Figure 7: Strassen DAG’s top node was actually a too-long-running interval demonstrated by the timeline view.
Figure 8: (Head part of) SparseLU’s DAG by Cilk Plus
whereas in Cilk Plus’s DAG (right one) these spinal nodes are executed separately by different workers (of different col-ors). This is because in Intel TBB when a worker creates a new task it pushes the new task into its work queue and continues executing the current one (help-first), whereas in Cilk Plus the worker would pause the current task to switch to executing the new task (work-first). Therefore, every par-allelism increment requires a work stealing operation in Cilk Plus’s execution, hence it is understandable that systems with help-first policy (OpenMP, Intel TBB, Qthreads) would execute SparseLU better than systems with work-first policy (Cilk Plus, MassiveThreads).
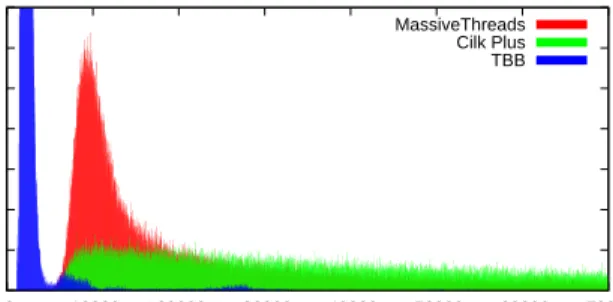
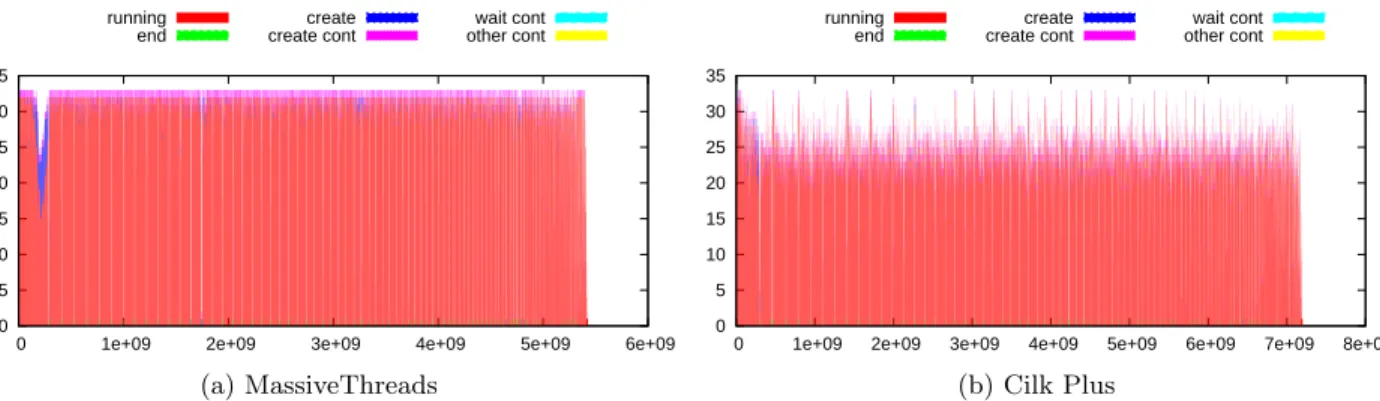
However, MassiveThreads still has significantly better uti-lization than Cilk Plus. We can observe it from Figure 10 which shows parallelism profiles of MassiveThreads and Cilk Plus on 32 cores. It is noticeable that Cilk Plus exposes a low parallelism (around 25, as opposed to nearly 32 of Mas-siveThreads). The reason why MassiveThreads performs better than Cilk Plus can be explained by Cilk Plus’s ex-pensive work stealing operation. Figure 11 compares the distribution of time gaps between two consecutive nodes on
Figure 9: (Head parts of) SparseLU’s DAG(s) by Intel TBB (left) and Cilk Plus (right)
0 50 100 150 200 250 300 350 0 10000 20000 30000 40000 50000 60000 70000 count clocks MassiveThreads Cilk Plus TBB
Figure 11: Distribution of work stealing time in SparseLU
the spine. Cilk Plus takes much longer to advance a compu-tation along it, implying that it takes longer to steal a task. Additionally, in our previous microbenchmark we have con-firmed that work stealing operation in MassiveThreads is more than an order of magnitude faster than in Cilk Plus [19].
6.
RELATED WORK
Tallent et al. [18] categorized parallel execution time of a multithreaded program into three categories: work, par-allel idleness, and parallel overhead. They claim that two metrics of parallel idleness and parallel overhead can help to pinpoints areas in a program’s code where concurrency should be increased (to reduce idleness), or decreased (to reduce overhead). Olivier et al. [11] have taken a step fur-ther by identifying that the inflation of work is in some cases more critical than parallel idleness or parallel overhead in task parallelism. They systemize the contributions of three factors ofwork inflation,idleness andoverhead in the per-formance loss of applications in BOTS, and demonstrated that work inflation accounted for a dominant part. Our toolset can help pinpointing the idleness factor and addition-ally attribute it back to the program’s logical task structure. It is potentially promising to analyze work inflation factor by comparing DAG(s) of multiple executions, because these DAG(s) are consistent in structure.
HPCToolkit [18] and Intel VTune Amplifier [6] both use sampling method and does not need to instrument the exe-cutable. These tools focus on hotspots analysis and timeline-based analysis.
Vampir [8] visualizes traces of an MPI program. Its main visualization is a timeline view with edges pointing from boxes to boxes to represent communication among processes.
It simultaneously shows a statistical view that displays ag-gregate information of a chosen time interval in the timeline. Jumpshot [22] is a more general timeline visualizer. It vi-sualizes data from text files of its own format. Jumpshot is not very flexible. It can only display up to 10 different categories which have 10 different colors. Jedule [5] is a tool to visualize schedules of parallel applications in time-line style. Olivier et al. [11] has used Jedule to visualize a timeline view for analyzing the locality of a scheduling pol-icy. Aftermath [3] is a graphical tool that visualizes traces of an OpenStream [14] parallel program in timeline style. OpenStream is a dataflow, stream programming extension of OpenMP. Although Aftermath is applied in a narrow con-text of OpenStream (a subset of OpenMP), it provides ex-tensive functionalities for filtering displayed data, zooming into details and various interaction features with users.
Wheeler and Thain [21] in their work of ThreadScope have demonstrated that visualizing a graph of dependent execu-tion blocks and memory objects can enable identificaexecu-tion of synchronization and structural problems. They convert traces of multithreaded programs to dot-attributed graphs which are rendered by GraphViz [1]. GraphViz is scalable (i.e., sufficiently fast for making animation possible) up to only hundreds of nodes, and quite slow with larger graphs because its algorithm [17] needs to care much about the aesthetic aspects of the graph such as node layering, edge crossing minimization. On the other hand, we leverage in-trinsic characteristics of the computation DAG such as lay-ered nodes (directed acyclic aspect), non-crossing edges to simplify the layout algorithm. DAGViz visualizes the DAG interactively with on-demand hierarchical expansion & con-traction rather than a static whole-graph picture provided by GraphViz.
7.
CONCLUSIONS AND FUTURE WORK
We have built DAG Recorder and DAGViz which are a toolset that extracts and visualizes the computation DAG from an execution of a task parallel program and provides in-teractive functionalities for users to explore the DAG. Through case studies, DAG visualization has proved its usefulness in helping users to understand the structure of task parallel programs and explore the issue of lacking parallelism.
Capturing all relevant events then visualizing them is a comprehensive strategy to analyze thoroughly the cause of performance bottlenecks. In the particular case of task par-allelism, all the nondeterministics and dynamics which are the cause of performance problems happen inside task par-allel primitives, so breaking down the entire execution into sequential segments separated by the primitives is a promis-ing approach.
In future work, we intend such directions as combining the sampling-based measurement with current instrumentations to get better observation of long running intervals, adding other metrics beside time such as hardware performance counters to get more measures to reason about the perfor-mance, extending current tracing technique to distributed-memory systems, etc.
8.
REFERENCES
[1] A. Bilgin. Graphviz - graph visualization software, 1988.
0 5 10 15 20 25 30 35
0 1e+09 2e+09 3e+09 4e+09 5e+09 6e+09
running end create create cont wait cont other cont (a) MassiveThreads 0 5 10 15 20 25 30 35
0 1e+09 2e+09 3e+09 4e+09 5e+09 6e+09 7e+09 8e+09
running end create create cont wait cont other cont (b) Cilk Plus
Figure 10: SparseLU’s parallelism profiles by MassiveThreads and Cilk Plus. While MassiveThreads consistently reaches 32 parallelism, Cilk Plus mostly floats around 25.
[2] A. Danowitz, K. Kelley, J. Mao, J. P. Stevenson, and M. Horowitz. Cpu db: Recording microprocessor history. Commun. ACM, 55(4):55–63, Apr. 2012. [3] A. Drebes, A. Pop, K. Heydemann, A. Cohen, and
N. Drach-Temam. Aftermath: A graphical tool for performance analysis and debugging of fine-grained task-parallel programs and run-time systems. In Proceedings of 7th Workshop on Programmability Issues for Heterogeneous Multicores, MULTIPROG ’14, 2014.
[4] A. Duran, X. Teruel, R. Ferrer, X. Martorell, and E. Ayguade. Barcelona OpenMP Tasks Suite: A Set of Benchmarks Targeting the Exploitation of Task Parallelism in OpenMP. In 2009 International Conference on Parallel Processing, pages 124–131. IEEE, Sept. 2009.
[5] S. Hunold, R. Hoffmann, and F. Suter. Jedule: A tool for visualizing schedules of parallel applications. In Parallel Processing Workshops (ICPPW), 2010 39th International Conference on, pages 169–178, Sept 2010.
[6] Intel. Intel vtune amplifier.http://software.intel. com/en-us/intel-vtune-amplifier-xe, 2015. [Online; last accessed July 5, 2015].
[7] C. E. Leiserson. The Cilk++ concurrency platform. In Proceedings of the 46th Annual Design Automation Conference DAC ’09, page 522, New York, New York, USA, July 2009. ACM Press.
[8] W. E. Nagel, A. Arnold, M. Weber, H.-C. Hoppe, and K. Solchenbach. Vampir: Visualization and analysis of mpi resources. Supercomputer, 12:69–80, 1996. [9] J. Nakashima, S. Nakatani, and K. Taura. Design and
implementation of a customizable work stealing scheduler. In Proceedings of the 3rd International Workshop on Runtime and Operating Systems for Supercomputers - ROSS ’13, page 1, New York, New York, USA, June 2013. ACM Press.
[10] J. Nakashima and K. Taura. MassiveThreads: A Thread Library for High Productivity Languages. In Festschrift of Symposium on Concurrent Objects and Beyond: From Theory to High-Performance
Computing (to appear as a volume of Lecture Notes in Computer Science), 2012.
[11] S. L. Olivier, B. R. de Supinski, M. Schulz, and J. F.
Prins. Characterizing and mitigating work time inflation in task parallel programs. SC ’12, pages 65:1–65:12, Los Alamitos, CA, USA, 2012. IEEE Computer Society Press.
[12] OpenMP Architecture Review Board. OpenMP Application Program Interface. Technical Report July, OpenMP Architecture Review Board, 2011.
[13] C. Pheatt. Intel(r) threading building blocks. J. Comput. Sci. Coll., 23(4):298–298, Apr. 2008. [14] A. Pop and A. Cohen. Openstream: Expressiveness
and data-flow compilation of openmp streaming programs. ACM Trans. Archit. Code Optim., 9(4):53:1–53:25, Jan. 2013.
[15] C. G. Project. Cairo.http://cairographics.org/, 2015. [Online; last accessed July 5, 2015].
[16] T. G. Project. Gtk+ 3.http://www.gtk.org/, 2015. [Online; last accessed July 5, 2015].
[17] K. Sugiyama, S. Tagawa, and M. Toda. Methods for visual understanding of hierarchical system structures. Systems, Man and Cybernetics, IEEE Transactions on, 11(2):109–125, 1981.
[18] N. R. Tallent and J. M. Mellor-Crummey. Effective performance measurement and analysis of
multithreaded applications. In Proceedings of the 14th ACM SIGPLAN Symposium on Principles and Practice of Parallel Programming, PPoPP ’09, pages 229–240, New York, NY, USA, 2009. ACM.
[19] K. Taura and J. Nakashima. A Comparative Study of Six Task Parallel Programming Systems (in Japanese). In IPSJ SIG Technical Report HPC, volume 140(16), pages 1–10. IPSJ, 2013.
[20] K. B. Wheeler, R. C. Murphy, and D. Thain. Qthreads: An API for programming with millions of lightweight threads. In 2008 IEEE International Symposium on Parallel and Distributed Processing, pages 1–8. IEEE, Apr. 2008.
[21] K. B. Wheeler and D. Thain. Visualizing massively multithreaded applications with ThreadScope. Concurrency and Computation: Practice and Experience, 22(1):45–67, Jan. 2010.
[22] O. Zaki, E. Lusk, and D. Swider. Toward scalable performance visualization with jumpshot. High Performance Computing Applications, 13:277–288, 1999.