Algorithms
CORNEL BARNA, MARK SHTERN, MICHAEL SMIT, VASSILIOS TZERPOS, MARIN LITOIU, York University
Denial of Service (DoS) attacks overwhelm online services, preventing legitimate users from accessing a service, often with impact on revenue or consumer trust. Approaches exist to filter network-level attacks, but application-level attacks are harder to detect at the firewall. Filtering at this level can be computationally expensive and difficult to scale, while still producing false positives that block legitimate users.
This paper presents a model-based adaptive architecture and algorithm for detecting DoS attacks at the web application level and mitigating them. Using a performance model to predict the impact of arriving requests, a decision engine adaptively generates rules for filtering traffic and sending suspicious traffic for further review, where the end user is given the opportunity to demonstrate they are a legitimate user. If no legitimate user responds to the challenge, the request is dropped. Experiments performed on a scalable implementation demonstrate effective mitigation of attacks launched using a real-world DoS attack tool.
1. INTRODUCTION
DoS1attacks have increased in both volume and sophistication [Dobbins et al. 2010]. Attack targets include not only businesses and media outlets but also service providers such as DNS, Web portals, etc. A sophisticated DoS attack can be mounted by attackers without advanced technical skills. There are many advanced attacking toolkits freely available on the Internet [Kargl and Maier 2001], including LOIC (low-orbit ion can-non) [Roman et al. 2011]. It has been used to launch attacks on government sites, the RIAA and MPAA (recording and movie industry associations), and more through coor-dinated efforts such as Operation Payback [Roman et al. 2011] and Operation MegaU-pload. DoS attacks are motivated by a variety of reasons (financial, political, ideolog-ical [Zuckerman et al. 2010]), but regardless of motivation have similar impact: lost revenue, increased expenses, lost customers, and reduced consumer trust.
This paper relates and builds on previous work [Barna et al. 2012], proposing a model-based adaptive architecture and algorithm focused on detecting DoS attacks at the web application level and mitigating them appropriately. A Dynamic Firewall com-ponent is added to the standard web application stack; all requests are routed through this firewall. Arriving HTTP[S] requests first encounter a reverse proxy, which pro-cesses requests based on a set of rules. A decision engine uses a performance model of the application, statistical anomaly detection, and monitoring data from the applica-tion to adaptively create, update, and remove rules based on the presence or absence of an attack. Based on the rules, requests are labelled as suspicious or regular. Regular
1A distributed denial of service (DDOS) attack is a subtype of DoS attacks; the more general term is used
throughout this paper.
This work is supported by funding from NSERC, IBM Centers for Advanced Studies Toronto, and Amazon. We are grateful to Bradley Simmons for his insight and suggestions.
Permission to make digital or hard copies of part or all of this work for personal or classroom use is granted without fee provided that copies are not made or distributed for profit or commercial advantage and that copies show this notice on the first page or initial screen of a display along with the full citation. Copyrights for components of this work owned by others than ACM must be honored. Abstracting with credit is per-mitted. To copy otherwise, to republish, to post on servers, to redistribute to lists, or to use any component of this work in other works requires prior specific permission and/or a fee. Permissions may be requested
from Publications Dept., ACM, Inc., 2 Penn Plaza, Suite 701, New York, NY 10121-0701 USA, fax+1 (212)
869-0481, or [email protected]. c
2013 ACM 1556-4665/2013/02-ART $10.00
traffic proceeds to the web application as usual, while suspicious traffic is forwarded to an Analyzer component which challenges the end user to verify they are legitimate (such as a CAPTCHA test as in [Morein et al. 2003]).
We extend previous work [Barna et al. 2012] by (a) introducing a hybrid approach to detecting the beginning of a DoS attack combining a model-based adaptive algorithm and statistical anomaly detection. We present (b) an experiment demonstrating the strength of this hybrid approach compared to the previous approach, which relied only on statistical anomaly detection. This extended approach is less sensitive to tuning, and is also capable of detecting a type of complex DoS attack that our previous ap-proach could not detect correctly. We added (c) additional experiments comparing more complex statistical anomaly detection approaches, empirically demonstrating that a carefully tuned statistical model could be as effective as our approach in constrained situations, but was sensitive to tuning and could not protect against an unknown at-tack. Our adaptive model-based approach is based on mathematical queuing theory and creates an abstract view of the application (rather than relying on an externally-defined baseline) and was able to detect unknown attacks.
This approach improves on the state-of-the-art in several key dimensions. The adap-tive architecture is a novel approach to detecting and mitigating DoS attacks. In particular, using a combination of application performance modeling with statistical anomaly detection to establish a set of filtering rules is novel. Iteratively fine-tuning those rules using application- and system-level performance metrics synchronized with the performance model, is also novel; the use of performance models allows us to leverage existing work on constructing performance models. Detecting DoS attacks using a performance model enables the prediction and prevention of application over-loading in simulation, rather than waiting for the overload to occur and responding. Prediction also allows for more precisely timed removal of filters, limiting the impact on legitimate traffic. Defining a DoS attack asany traffic that exceeds the application’s ability to handle itis a straightforward definition that allows us to leverage capacity planning work to address this problem. Moreover, filtering traffic using application-level knowledge at the granularity of individual use case scenarios is more granular than typical mitigation approaches. This also reduces the impact on legitimate traffic. To validate this approach, we implemented the Dynamic Firewall and monitored the traffic to a multi-tier J2EE web application. We monitored the request arrival rate (both suspicious and regular), the response time, and the CPU utilization in regular conditions and attack conditions. The attack conditions were both emulated by a work-load generator and created realistically using LOIC. We found that under both attack conditions, our approach adapted to block the DoS traffic, restoring response times to expected values within seconds.
To demonstrate the importance of the performance model, we conducted a series of experiments where the rules were generated using various statistical anomaly de-tection approaches without a performance model. We show the advantage of predictive modelling, the sensitivity of the statistical anomaly approach to the chosen metrics and the construction of the model of “normal” behavior, and that the performance model in-creases our ability to detect a broader variety of DoS attacks.
The remainder of this paper is organized as follows. Section 2 reviews relevant work. Section 3 introduces our adaptive architecture and algorithm. Experiments that show-case the usefulness of this approach compared to anomaly detection are presented in Section 4, and the results are discussed in Section 5. Section 6 concludes the paper. 2. RELATED WORK
We begin with an introduction to DoS attacks and describe some established methods for DoS mitigation. The approach presented in this paper constructs a performance
model; while a full review is out of scope for this paper, Section 2.2 briefly introduces some established achievements in performance modeling.
2.1. DoS attacks and existing mitigation approaches
A DoS attacker will send many repeated requests that require resources to generate replies. These requests may be low-level TCP requests or higher-level application re-quests (like GET rere-quests for web pages). The attacker discards the replies, meaning it takes fewer resources to send requests than it does to send responses (this problem is compounded when the target uses SSL; a recently released prototype tool demon-strates a dangerous type of SSL DoS attack [The Hacker’s Choice 2012]). Even with this beneficial ratio, the attacker may not be able to achieve denial of service with a single machine. Distributed Denial of Service attacks harness the power of many dis-tributed attackers to attack a single target; this paper includes DDoS attacks in the term DoS.
The most common DoS attack is a network type of attack. The usual defence is to deploy firewalls and intrusion detection and prevention systems. Firewall rules that implement ingress and egress filtering prevent spoofing attacks that originate on the local network and also prevent incoming traffic from impacting the local network. This impairs the ability of local computers to participate in DoS attacks [Kargl and Maier 2001]. Firewalls can also stop TCP-related DoS attacks such as SYN-Floods by imple-mentation of SYN cookies.
DoS attacks which overload computer resources are known to be challenging to de-fend. Some experts argue the only possible solution for this problem is to improve secu-rity for all Internet hosts and prevent attackers from running DoS attacks [Kargl and Maier 2001]. An example of these source-end defence schemes is D-WARD [Mirkovi´c 2002]. Sachdeva et al. [Sachdeva et al. 2011] identify a number of problems with source-end defence, principal among them doubt that such mechanisms will be widely implemented.
Researchers who agree with the challenge of defence at the source suggest defence at the victim site. For example, Kargl suggests using available DoS protection tools augmented with load monitoring tools to prevent clients (or attackers) from consum-ing too much bandwidth [Kargl and Maier 2001]. Other examples include QoS reg-ulation [Garg and Narasimha Reddy 2002] and cryptographic approaches [Juels and Brainard 1999]. Sachdeva et al. [Sachdeva et al. 2011] also identified challenges when defending from the victim network, including the computational expense of filtering traffic, the possibility of the defence tools themselves being vulnerable to DDoS, and incorrectly dropping legitimate traffic. While a variety of other approaches have been suggested (e.g., [Nguyen et al. 2011; Khattab et al. 2003; Long et al. 2004; Pandey and Pandu Rangan 2011; Wu and Y. 2007]), the current state of the art does not fully mitigate DoS attacks [Jain et al. 2011; Modi et al. 2013].
2.2. Performance Models
The use of performance models for detecting DoS attacks, as proposed by this paper, is a novel approach. We propose to use a performance model to analyze the incoming traffic and detecting traffic that moves the system toward its saturation point versus traffic that can be handled without overloading the system.
Any hardware-software system can be modeled by two layers of queuing networks [Rolia and Sevcik 1995; Menasc´e 2002]: one that describes the software resources and the other one for the hardware resources. This way, the system becomes a network of resources. Each class of service has ademandfor each resource, which is the time that resource is needed to complete a single user request.
In multiuser, transactional systems, abottleneckis a resource (software or hardware) that has the potential to saturate if enough users access the system. In general, the resource with the highest demand is the bottleneck. However, when there are many classes of requests with different demands at each resource, the situation becomes more complex. A change in the workload mix(how users are split among the types of service available) may change the bottleneck, or there may be multiple simultane-ous bottlenecks. When a bottleneck saturates, the overall performance of the system degrades quickly, and the system may appear unresponsive.
Early work was done to analyze a system from a performance point of view in [Za-horjan et al. 1981; Eager and Sevcik 1983; Lazowska et al. 1984; Reiser and Lavenberg 1980]. In [Balbo and Serazzi 1997; Litoiu et al. 2000] the authors investigated the in-fluence of workload mixes on the performance of the system, how bottlenecks change with the workload mix and when they become saturated. A method to uncover the worst workload mix and the minimum population required to saturate a system is presented in [Barna et al. 2011].
Some of the parameters for the model cannot always be measured and other methods are required to find the correct values. Also, the monitored data can contain noise that needs to be removed. In previous papers [Litoiu et al. 2005; Woodside et al. 2005; Zheng et al. 2005] the authors investigated how filters, like Kalman filters [Kalman 1960], can be effectively used with a predictive queuing network model (QNM) so that the model’s outputs always match those of the real system. Performance parameters like the service time, think times, and the number of users can be accurately tracked and fed into a QNM.
Capacity planning of distributed and client-server software systems, particularly for web applications, is a common application area; a popular approach is using queuing models to model web applications at operational equilibrium [Menasc´e and Almeida 1998; 2000; Gunther 2006] which has led to the automatic construction of measurement-based performance models [Thakkar et al. 2008; Gomaa and Menasc´e 2001] or capacity calculators [Thakkar 2009]. Others have tried to model the effect of application and server tuning parameters on performance using statistical inference, hypothesis testing, and ranking (e.g. [Imre et al. 2007; Sopitkamol and Menasc´e 2005]). Another approach automates the detection of potential performance regressions by ap-plying statistics on regression testing repositories (such as Jiang in [Jiang et al. 2009] and related earlier work). This has led to an approach for identifying subsystems that show performance deviations in load tests [Malik et al. 2010].
Tools have been developed to model and analyze a system from a performance point of view [Franks et al. 2012; APERA 2009; OPERA 2013]. In [Franks et al. 2012], the authors present a tool designed to modelsoftwaresystems using layered queuing net-works. The resources are grouped in layers and the requests move from layer to layer to get service. Once the model is solved, the output contains throughputs and utiliza-tions for the software resources, distribuutiliza-tions for the service time, queuing delays, etc. 2.3. The Optimization Performance Evaluation and Resource Allocator (OPERA)
One example of a queuing network model is OPERA [Litoiu 2007], the model used in our approach, which uses layered queuing to build a model of both the hardware and software resources of an application and then reasons about the performance of that application in different environments. Given a description of a system (an appli-cation and how it is deployed), and a candidate workload to various components of that system, OPERA can predict theutilizationof resources (like CPU and disk),response timeof requests to each component, andthroughput. This section provides a high-level overview of the approach and its capabilities; a formal specification of the model and algorithms is in [Litoiu 2007].
The system is described in terms of topology (nodesthat have resources and perform work, the organization and groupings of the nodes, and thenetworkthat connects the nodes) and the users’ interactions with it (servicesare offered by the system and ac-cessed by users, requests move among various services, services are grouped inclasses of service). The topology is defined in PXL, an XML-based domain specific language2.
From this description, OPERA will build two queuing networks – one for the hard-ware layer (that includes hardhard-ware resources) and one for the softhard-ware layer (that includes software resources, software resources grouped intocontainers, and threads). Resources are queuing centers; when a new request arrives to a resource that is not available (the CPU is busy, or the container has all threads in use, etc.), the request is put in a queue and will wait for the resource to become available. The queues are handled on first come, first served basis.
Each resource, either hardware or software, has ademand associated with it. The demand is the time (measured in milliseconds or seconds) necessary for that resource to handle a single request. Since requests in each class of service require varying amounts of work from resources, the demands must specified for each class of requests and for each resource (e.g. expected CPU time, expected IO time).
For hardware resources the demands can be either measured (using profiling tools) or estimated (using Kalman filters). For a software resource, the demand is the re-sponse time from the hardware layer. OPERA will solve the model for the hardware layer, extract the response times and input them into the software model as demands, and then solve the model for the software layer.
The output from OPERA includes estimates for response time, throughput, and re-source utilization. These estimates can be compared to measured values and, in case they do not match, a Kalman filter adjusts the model demands (see Section 3.2.3) to ensure the model’s output is synchronized with that of the real system.
3. ADAPTIVE DOS MITIGATION
This section describes our novel approach to detecting and mitigating attacks on HTTP web applications3. We consider the term web application to mean all resources re-quired to run the user-facing components, most commonly HTTP servers, application servers, and database servers.
To protect an application, we deploy an application-aware Dynamic Firewall to pro-cess all incoming requests based on an adaptively managed set of rules. All requests are determined to be either regular traffic and forwarded to the application, or suspi-cious traffic that is forwarded to an Analyzer component which performs a challenge-response test (e.g. a CAPTCHA [Morein et al. 2003]) to determine whether or not the suspicious traffic is from a legitimate user and should therefore be sent to the applica-tion. Requests are analyzed with high granularity; requests are grouped into classes of requests that represent a usagescenario(for example, “browsing an online catalog”, or “checking out”). A class of requests is considered suspicious if it would (or does) cause the web application to be overloaded.
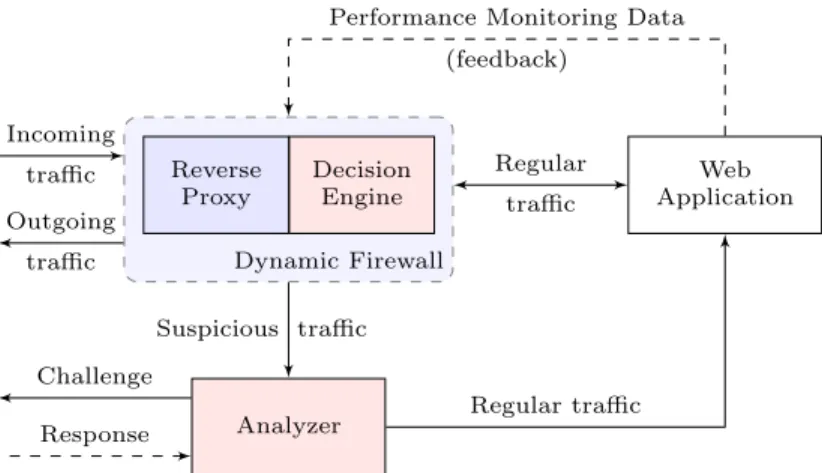
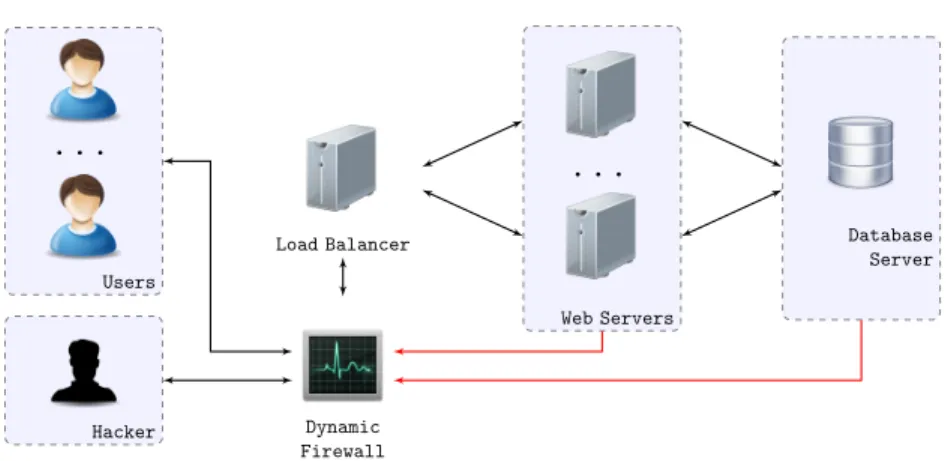
Figure 1 shows the complete architecture. The Dynamic Firewall is responsible for deciding if the requests to a particular scenario would overload the web application and creating rules to identify and handle these requests (Decision Engine), and for process-ing incomprocess-ing traffic in accordance with these rules (Reverse Proxy). The Reverse Proxy is a simple context-aware http request router, which redirects legitimate requests to
2A detailed specification for the PXL file can be found in [Litoiu and Barna 2012; OPERA 2013]. The tool is
available online athttp://www.ceraslabs.com/technologies/opera.
3To simplify the presentation, our discussion will refer only to HTTP, but the general approach is also
Dynamic Firewall Analyzer Reverse Proxy Decision Engine Web Application Regular traffic Regular traffic Suspicious traffic
Performance Monitoring Data (feedback) Incoming traffic Outgoing traffic Challenge Response
Fig. 1: DoS detection and mitigation architecture.
the Web Application and suspicious requests to the Analyzer. Proxy routing is rule-based; the same philosophy as a regular firewall, except that the rules are modified autonomically at runtime by the Decision Engine. The Decision Engine implements an adaptive system, using a two-pronged approach (both a performance model for pre-diction and statistical Anomaly Detection (AD)) to make decisions, as described in Section 3.2. The Analyzer tests the legitimacy of suspicious traffic caught by the rules, using a test to differentiate between human and automated agents (e.g., a CAPTCHA) (Section 3.3). First, Section 3.1 provides an overview of how incoming requests are processed.
3.1. Request Processing Overview
Adaptive mitigation of DoS attacks requires an understanding of the baseline behav-ior of the system under normal, no-attack situations. The Dynamic Firewall creates this understanding by monitoring the application under normal load (either once de-ployed or based on development test cases in controlled conditions). Using the gath-ered measurements, a web application performance profile (WAPP) is calculated based on aggregated metrics about response time, request arrival rate, CPU utilization, etc. The contents and format of this profile are established per-application based on which measurements best capture the normal behavior of the system. The WAPP profile can be constructed automatically, with the permissible ranges of values hand-tuned by an administrator to establish the possible ranges of the performance metrics.
Given this understanding of the base performance of the web application, adaptive DoS attack mitigation requires the correct processing of application requests in three distinct contexts: stable, under attack, and post-attack.
Stable:The Decision Engine monitors application and OS performance metrics, con-stantly synchronizing the performance model with the current state of the system. It also analyzes the state of the web application; if it is statistically similar to the base-line constructed previously, the traffic is considered regular. Note that a previously-detected DoS attack may still be proceeding, but the rules created when the attack was detected are preventing that traffic from reaching the web application. The Deci-sion Engine monitors existing rules; each iteration of the adaptation loop tests what would happen if individual rules were removed; if stability would be maintained, the rule can be removed.
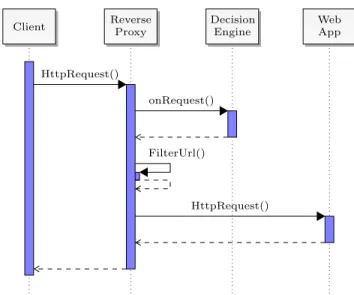
Client ReverseProxy DecisionEngine WebApp
HttpRequest()
onRequest()
FilterUrl()
HttpRequest()
Fig. 2: Sequence diagram for handling regular traffic.
Figure 2 shows a sequence diagram for requests arriving while the web application is experiencing regular traffic. When a request is received, the reverse proxy passes it to the Decision Engine which configures filtering rules (the rules are similar to a standard firewall). The rules relevant to the request are processed by the reverse proxy, which forwards the request to the web application or to the Analyzer based on the rules.
Under Attack:When the Decision Engine identifies a class of application requests or an application component is under attack, it triggers the creation of new protection rules for the Reverse Proxy. To generate the new protection rules, the traffic collected by the Decision Engine is simulated in the performance model to predict its outcome on the web application. All traffic that is predicted to cause performance degradation is marked as suspicious and corresponding protection rules are added to the proxy (in our proof-of-concept implementation a rule is a regular expression that matches the requested URL, but of course a more robust representation is required in practice.).
Suspicious requests are redirected to the Analyzer for further assessment; typical DoS attack tools are not concerned with the response from the server, and so will not follow redirect requests. This means that the majority of DoS attack traffic will be stopped at the Reverse Proxy.
Post Attack: The Decision Engine detects that the DoS attack is over when all in-coming traffic could be handled by the web application, and responds by removing the rules currently diverting traffic to the Analyzer.
3.2. Decision Engine
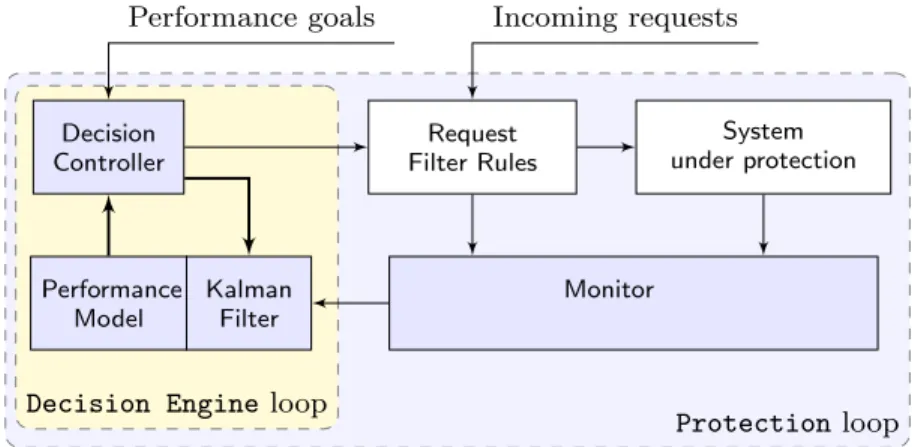
DoS attacks often succeed when they overload bottlenecked resources, so the decision engine must detect traffic that has the potential to saturate the system. The Decision Engine implements an adaptive loop to manage the detection and mitigation decision-making, including monitoring the performance metrics from the application and the servers, identifying attack traffic based on statistical anomaly detection and a pre-dictive performance model, using the performance model to predict behavior under given traffic conditions and making decisions accordingly, and creating rules to filter requests as they arrive. Figure 3 provides a conceptual overview of the adaptive loop in the decision engine and its place in the overall adaptive system.
Decision Engineloop Protectionloop Decision Controller Request Filter Rules System under protection Monitor Performance Model Kalman Filter
Performance goals Incoming requests
Fig. 3: Overview of the key components of the Decision Engine.
The performance goals are target performance metrics, such as utilization values, response time, or throughput for a class of request, etc. Those values are derived from the WAPP.
The system is continuously monitored by aperformance monitor. Data includesCPU utilization, CPU time, disk utilization, disk time, waiting time (which includes time waiting in critical sections, thread pools, connection pools), andthroughput. The moni-tor also collects information on the workload (e.g.arrival ratefor each class of service) and the system. The collected data is filtered through an estimator for error correc-tion and noise removal. Estimators, such as Kalman filters [Kalman 1960], have been proven effective in estimating demand [Ghanbari et al. 2011].
The performance data is passed to the performance model, which consists of two queuing network layers. The main function of the model is to predict performance indicators if currently filtered traffic were allowed in addition to currently arriving requests. This decision is made at the scenario level (recall a scenario is a class of application requests). For modeling we are using OPERA [OPERA 2013], which is an updated version of the solver APERA [APERA 2009] developed by one of the authors.
Thedecision controllerconstructs the rules used by the Reverse Proxy. At each iter-ation it predicts whether incoming requests would overload the protected web appli-cation. Based on the current state of the web application and theperformance goals, a new class of requests may be filtered or allowed (filtered traffic is redirected to the Analyzer). In each iteration, the controller tries to minimize the number of classes of filtered requests. The controller relies on the performance monitor for information about the monitored environment and on the performance model for predictions.
The controller creates a filtering rule for requests to a scenario when it detects one of the following conditions:
(1) The web application will be unable to support incoming traffic based on an estima-tion from the performance model; or
(2) The nature or volume of the requests deviates significantly from the WAPP, and system performance indicators are deviating from predefined thresholds (statisti-cal anomaly detection).
This process allows rapid reaction to prevent system overloading. Our DoS detection process utilizes both a performance model (1) and statistical anomaly detection (2) to create rules, and then iteratively fine-tunes them using the performance model.
The performance-model driven aspect is very efficient as long as the performance model is synchronized with the web application. Synchronization is lost when the the-oretical model deviates from the actual application, which occurs due to the general representation of the application as a LQN rather than a heavily tuned simulation: precision is exchanged for general applicability. The detection and repair of lost syn-chronization is discussed in 3.2.3. In contrast, the statistical anomaly detection does not require synchronization with the web application, but its detection capabilities are significantly dependent on the selected measures (e.g. CPU utilization, memory allo-cation) and the constructed WAPP. Due to these limitations, the AD may not be able to detect traffic that would overload the web application. Filtering based on the com-bination of the performance model and the statistical anomaly detection improves our ability to prevent the system from overloading.
The algorithms for creating and removing rules, and the algorithm for tuning the model and ensuring synchronization, are described in the following subsections.
3.2.1. Filtering Rule Construction Algorithm.As mentioned, the controller tries to detect
DDoS attacks using the performance model; when the model is not synchronized, and statistical anomalies are detected, the AD also creates filtering rules. The approach used for AD is based on [Oshima et al. 2010]; the filter construction algorithm when using the performance model is shown in Algorithm 1.
It first verifies that the model is synchronized with the system, by checking the estimated values of the metrics for the workload L(u) against the measured values (line 6). If they are not close, the model is adjusted using Kalman filters. The Kalman filter will estimate new values for the model parameters (service demands) such as the model-predicted performance metrics (CPU utilizations, throughput, response times) match those measured [Litoiu et al. 2005; Woodside et al. 2005; Zheng et al. 2005].
The main loop (line 12) checks the effect of filtering each scenario on the performance of the system (using the model), and selects the scenario that provides the highest in-crease in performance (line 16). When all have been investigated, the selected scenario is added to the listCof classes of service to be filtered (line 21). The loop ends when there are no more unfiltered scenarios or when the estimated performance metrics are within acceptable values.
Once a set of classes that should be filtered has been identified, the corresponding rules are added to the Dynamic Firewall. In our experiments, each class can be iden-tified by a regular expression matching the requested URL. Adding a rule to filter the requests belonging to a class translates into adding the regular expression to the firewall. For each request, the firewall will check the URL against the rules, and, if a match is found, the request is marked as suspicious. However, more complex firewall rules can be added.
3.2.2. Filtering Rule Removal Algorithm.The second role of the controller is to fine-tune
filters or remove them when an attack appears to be over. The filter removing algo-rithm is shown in Algoalgo-rithm 2.
Again, the algorithm verifies the model is synchronized with the system (line 6), using the specified workload, and tunes it using a Kalman filter if it is not (line 7).
The main loop (line 11) tries to remove filters. For each filtered scenario, it estimates the performance of the system if the scenario were unfiltered. The scenario with the smallest impact on performance is selected (line 16) as a candidate for removal. After all scenarios have been evaluated, the algorithm checks if the estimated performance metrics when the filter is removed are within acceptable values (line 21). If the test succeeds, the scenario is added to the listCof scenarios to be unfiltered. The traffic for this scenario is taken into consideration for the next iteration of the main loop. The
ALGORITHM 1: Filter Construction Algorithm – algorithm that finds a set of scenarios C which if filtered would bring the performance metrics to an acceptable level.
input :L(u)– the vector that contains the current load on each non-filtered scenario;
input :P Mm– the vector of measured performance metrics;
input :err– the accepted error for the model estimations;
input :C(u)– the set of all unfiltered scenarios (classes of traffic);
output:C– a set of unfiltered scenarios,C⊆C(u), that should be filtered.
1 C← ∅;
2 ifC(u)=∅then
3 returnC;
4 end
5 Use OPERA to compute the estimated performance metrics,P Me, for the loadL(u);
6 if 1− P Me P Mm > errthen
7 Tune the model for loadL(u);
8 ComputeP Mewith the updated model;
9 end
10 L←L(u); 11 pme←P Me;
12 while C(u)6=∅and(pmearenotacceptable)do
13 Ctmp←null;
14 foreach scenarioC∈C(u)do
15 Use OPERA to compute the estimated performance metricspmCe for loadL− {L
(u) C }; 16 if pmCe < pmethen 17 Ctmp←C; 18 pme←pmCe; 19 end 20 end 21 C←C∪ {Ctmp}; 22 C(u)←C(u)− {Ctmp}; 23 L←L− {L(Cu)}; 24 end 25 returnC;
main loop exits when no scenario is found to be a viable candidate for removal (line 27) or when all scenarios are unfiltered.
3.2.3. Tuning the model.When the predicted values from OPERA and those measured
by the performance monitor are sufficiently dissimilar (a tuneable parameter), the model is considereddesynchronizedfrom the monitored system and new demands for resources are necessary. To find new demands we use Kalman Filters, which are known to be effective [Litoiu et al. 2005; Woodside et al. 2005; Zheng et al. 2005].
The algorithm, shown in Algorithm 3, is an iterative one. Each iteration executes the algorithm presented in [Woodside et al. 2005] to estimate the demands (function
KalmanFilterEstimate). We briefly summarize the algorithm here; [Woodside et al. 2005] contains a comprehensive formal description of Kalman Filters and an analysis of their performance.
Initialization of the Kalman Filter (line 1) for the computations that will follow be-gins with setting the internal matrices to their initial values. The sensitivity matrixH
ALGORITHM 2: Filter Removal Algorithm – algorithm to identify existing scenario filtersC that can be unfiltered without overloading the system.
input :L(u)– the vector that contains the current load on each unfiltered scenario;
input :L(b)– the vector that contains the current load on each filtered scenario;
input :P Mm– the vector of measured performance metrics;
input :err– the accepted error for the model estimations;
input :C(b)– the set of all filtered scenarios;
output:C– a set of filtered scenarios,C⊆C(b), that are safe to unfilter.
1 C← ∅;
2 ifC(b)=∅then
3 returnC;
4 end
5 Use OPERA to compute the estimated performance metrics,P Me, for the loadL(u);
6 if 1− P Me P Mm > errthen
7 Tune the model for loadL(u);
8 ComputeP Mewith the updated model;
9 end 10 L←L(u); 11 while C(b)6=∅do 12 Ctmp←null; 13 pme←null; 14 foreach scenarioC∈C(b)do
15 Use OPERA to compute the estimated performance metricspmCe for loadL∪ {L
(b) C }; 16 if (pme=null)or(pmCe < pme)then 17 Ctmp←C; 18 pme←pmCe; 19 end 20 end
21 if (pme6=null)and(pmeare acceptable)then
22 C←C∪ {Ctmp}; 23 C(b)←C(b)− {Ctmp}; 24 L←L∪ {L(Cb)}; 25 L(b)←L(b)− {L(Cb)}; 26 else 27 returnC; 28 end 29 end 30 returnC;
If we consider that the model, M, is a function of demands and workloads that pro-duces a vector of performance metrics, then
H =∂M
∂D
When this algorithm finishes, a vector with new values for demands is found and these values will be used by the model until a new synchronization is required.
ALGORITHM 3:Model Tuning Algorithm – algorithm that estimates new demands, when the model goes out of sync with the monitored system.
input :M– the performance model used to estimate performance metrics;
input :P Mm– the vector of measured performance metrics;
input :L– the vector that contains the current workload that generatedP Mm;
input :Din– the vector that contains the current demands for resources;
input :err– the accepted error for the model estimations;
input :max– the maximum number of iterations;
output:D– a vector with demands such that the estimated and measured performance
metrics are close to each other.
1 Initialize the Kalman Filter; 2 D←Din;
3 Use modelM to compute the estimated performance metrics,P Me, forLandD;
4 Initialize the Kalman Filter sensitivity matrixHwith zeroes;
5 while 1− P Me P Mm
> errandmax not reacheddo
6 Update Kalman Filter sensitivity matrix,H, for modelMwhen using demandsDand
workloadL;
7 D←KalmanF ilterEstimate(H, D, P Me, P Mm);
8 Use modelM to compute the new estimated performance metrics,P Me, for workloadLand new demandsD;
9 end
10 returnD;
3.3. Analyzer
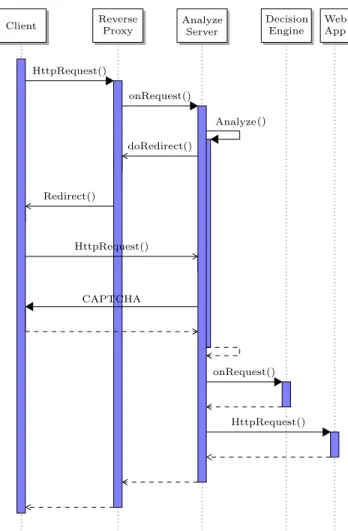
Suspicious traffic is redirected to the Analyzer, which is responsible for making the final decision. Our approach is inspired by the process presented by [Morein et al. 2003]: it presents a CAPTCHA test that must be passed before the request is identi-fied as legitimate. The test is required for each request, to prevent the attacker from passing the CAPTCHA test and then triggering an automatic attack. A pre-filter drops all requests believed to have malicious intent; requests are considered malicious when a request from the same source has failed or not answered the CAPTCHA within a pre-defined time period. The sequence diagram for the Analyzer when the request is not malicious is shown in Figure 4.
Once an end-user has successfully solved the CAPTCHA, they are temporarily whitelisted for a configurable length of a time at a configurable rate of requests. This limits user frustration at solving CAPTCHAs while preventing an attacker from solv-ing a ssolv-ingle CAPTCHA and then launchsolv-ing an automated attack.
The redirection process is a straightforward HTTP redirect (status code 302), which for page load requests will be handled transparently by the user’s client (web browser). Asychronous requests that use HTTP as a transport layer (e.g. AJAX) can be handled differently. For example, when returning the page with the CAPTCHA query, a special header can be included, then client-side scripting used to detect the presence of this header and prompt the user to enter the CAPTCHA answer.
4. EXPERIMENTS
In this section, we present experiments showing the successful mitigation of DoS at-tacks (Section 4.2) and demonstrating the benefits of using a performance model in DoS mitigation (Section 4.3). We begin with the experimental setup.
Client ReverseProxy DecisionEngine WebApp HttpRequest() onRequest() Analize() doRedirect() Redirect() HttpRequest() CAPTCHA onRequest() HttpRequest() Analyze Server Analyze Server
Fig. 4: Sequence diagram for traffic redirected to the Analyzer. 4.1. Experiment Environment
In all experiments we have used abookstoreapplication that we have developed using J2EE technology. Thebookstoreapplication emulates an e-commerce web application with the following usage scenarios:
•marketing– browse reviews and articles;
•product selection– search the store catalog and compare product features;
•buy– add items to the shopping cart;
•pay– proceed to checkout the shopping cart;
•inventory– inventory management such as buy/return items from/to the supplier; and
•auto bundles– upselling / discounting system.
Each scenario performs a different mix of select, insert, and delete SQL commands. We deployedbookstoreto three Windows XP machines: one database server (MySQL) and two application servers (Tomcat). A fourth machine hosted a workload balancer (Apache 2) to distribute the incoming web requests to the application servers. Figure
. . .
Users Hacker Load Balancer. . .
Web Servers Database Server Dynamic FirewallFig. 5: The cluster used for experiments.
5 shows our deployment architecture. Once deployed, we gathered data under regular conditions to establish the WAPP. The profile for this application was based on CPU utilization of the web host and database host (expected to be between 0 and 70%), and on the response time of the application (established per scenario; for some scenarios 5 second response time is normal, while others are expected to be as low as 1 second).
Between the users and the web application, we deployed a DoS mitigation implemen-tation. The primary focus of the experiments is our Dynamic Firewall implementation, but we deploy three other implementations for comparison purposes:
•Dynamic Firewall– as described in this paper, using a two-layer queuing network performance model combined with a Kalman filter to establish filtering rules (with a statistical anomaly detection approach running in parallel), and iteratively fine-tuning these rules based on the same performance model.
•Dynamic Firewall (Original) – like the Dynamic Firewall, but with the rules initially created by statistical anomaly detection only (from [Barna et al. 2012]).
•AD-CPU– using statistical Anomaly Detection to establish a set of filtering rules then iteratively fine-tuning the rules based on CPU utilization measurements.
•AD-CPUAR– using statistical Anomaly Detection as above, then fine-tuning based on a combination of both CPU utilization and Arrival Rate measures.
To validate our approach, we conducted a series of experiments where we used a popular DoS attack tool (LOIC) to launch denial-of-service attacks on our sample web application4. We employed the four DoS mitigation implementations and monitored the response of each implementation to the incoming requests for the six web applica-tion scenarios. The evaluaapplica-tion is focused on the key contribuapplica-tion of this work, namely the decision-making on arriving traffic; therefore, while traffic is redirected to an An-alyzer component, that component is not explicitly included in these experiments.
To assess the efficacy of our approach, we monitor the request arrival rate and CPU utilization metrics. The desired behavior is that traffic to the attacked scenarios en-tirely redirected to the Analyzer for the duration of the attack, and a reduced im-pact on CPU Utilization for both the database and web servers. For each experiment, there are time periods of regular traffic and time periods with an ongoing DoS attack (noted in the figures with varied backgrounds). We tracked response time (green, solid line on right y-axis), arrival rate of requests that are unfiltered (blue, dashed line on
Attack on multiple scenarios Attack on a single scenario Regular traffic Legend
Arrival Rate (unblocked) Arrival Rate (blocked) Response Time
Arrival Rate (unblocked) Arrival Rate (blocked) Response Time
Arrival Rate (unblocked) Arrival Rate (blocked) Response Time
0 10 20 30 40 50 60 70 80 90 100 0 100 200 300 400 500 CPU Utilization (%) Time DB Web
(a) CPU Utilization
0.00 0.50 1.00 1.50 2.00 2.50 3.00 3.50 4.00 0 100 200 300 400 500 0 500 1000 1500 2000 2500 3000 3500 4000 4500 5000 Req./s Milliseconds Time (b) buy 0.00 0.50 1.00 1.50 2.00 2.50 3.00 0 100 200 300 400 500 0 500 1000 1500 2000 2500 3000 3500 4000 4500 5000 Req./s Milliseconds Time (c) pay 0 10 20 30 40 50 60 0 100 200 300 400 500 0 500 1000 1500 2000 2500 3000 3500 Req./s Milliseconds Time (d) marketing 0 5 10 15 20 25 30 0 100 200 300 400 500 0 2000 4000 6000 8000 10000 12000 14000 Req./s Milliseconds Time
(e) product selection
0.00 0.05 0.10 0.15 0.20 0.25 0.30 0.35 0 100 200 300 400 500 0 1000 2000 3000 4000 5000 6000 7000 Req./s Milliseconds Time (f) inventory 0.00 0.05 0.10 0.15 0.20 0.25 0.30 0 100 200 300 400 500 0 500 1000 1500 2000 2500 3000 3500 4000 4500 5000 Req./s Milliseconds Time (g) auto bundles
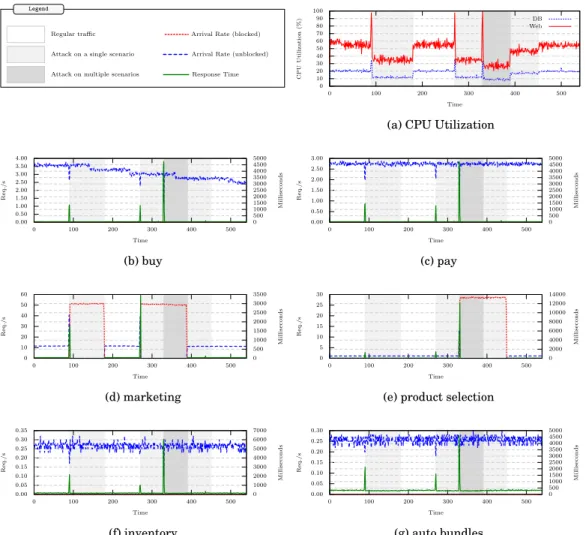
Fig. 6: Experiment with emulated DoS attack, using the performance model. left y-axis), and arrival rate of requests that are redirected to the Analyzer and its CAPTCHA test (red, dotted line on left y-axis).
4.2. Efficacy of Adaptive DoS Attack Mitigation
We first examine the efficacy of our Dynamic Firewall approach in mitigating DoS attacks.
Experiment 1. This experiment demonstrates the efficacy of the complete Dynamic Firewall solution in two contexts. In the first context, a workload generator simu-lated three attacks: one attacking the marketing scenario, then a second attack on themarketingscenario that overlaps with the third attack on theproduct selection
scenario. In the second context, the LOIC was used to launch a similar attack. The expected outcome is that the model-based adaptive algorithm effectively detects and mitigates the attacks targeting the web application, for both the artificial and the “real” attack.
Attack on multiple scenarios Attack on a single scenario Regular traffic Legend
Arrival Rate (unblocked) Arrival Rate (blocked) Response Time
Arrival Rate (unblocked) Arrival Rate (blocked) Response Time
Arrival Rate (unblocked) Arrival Rate (blocked) Response Time
0 10 20 30 40 50 60 70 80 90 100 0 100 200 300 400 500 600 700 CPU Utilization (%) Time DB Web
(a) CPU Utilization
0.00 0.50 1.00 1.50 2.00 2.50 3.00 3.50 4.00 0 100 200 300 400 500 600 700 0 500 1000 1500 2000 2500 3000 3500 Req./s Milliseconds Time (b) buy 0.00 0.50 1.00 1.50 2.00 2.50 3.00 0 100 200 300 400 500 600 700 0 500 1000 1500 2000 2500 3000 3500 Req./s Milliseconds Time (c) pay 0 100 200 300 400 500 600 700 800 900 0 100 200 300 400 500 600 700 0 500 1000 1500 2000 2500 3000 3500 4000 4500 5000 Req./s Milliseconds Time (d) marketing 0 100 200 300 400 500 600 700 800 900 1000 0 100 200 300 400 500 600 700 0 1000 2000 3000 4000 5000 6000 7000 8000 Req./s Milliseconds Time
(e) product selection
0.00 0.05 0.10 0.15 0.20 0.25 0.30 0.35 0 100 200 300 400 500 600 700 0 500 1000 1500 2000 2500 3000 3500 Req./s Milliseconds Time (f) inventory 0.00 0.05 0.10 0.15 0.20 0.25 0.30 0 100 200 300 400 500 600 700 0 500 1000 1500 2000 2500 3000 3500 4000 Req./s Milliseconds Time (g) auto bundles
Fig. 7: Experiment with LOIC, using the performance model.
Results:The results of Experiment 1 for the first context are shown in Figure 6 (with the three metrics for each of the scenarios in Figures 6b-g). The results show that traffic to the attacked scenarios is detected and redirected for further analysis. There is a momentary jump in incoming traffic requests before the attack is detected, then a consistently large number of filtered requests. When the attack ends, the mitigation rules are removed and normal traffic resumes. For all of the scenarios, response time jumps quickly in the seconds before the attack is detected and mitigated. Response time quickly returns to normal once the mitigation action is implemented. Figure 6a shows the CPU utilization on the application servers and the database. There are three spikes which correspond to the DoS attacks. Normal load was restored after the malicious traffic was filtered; based on the performance model, the filter removing algorithm first removed the filter for the marketing scenario and then for product selection.
The results for the second context, the LOIC attack, are similar (Figure 7): the mit-igations successfully limited the impact of the DoS attack on the web application. We note in passing that minimal differences were seen between the LOIC tool and the emulation using a workload generator.
Attack on multiple scenarios Attack on a single scenario Regular traffic Legend
Arrival Rate (unblocked) Arrival Rate (blocked) Response Time
Arrival Rate (unblocked) Arrival Rate (blocked) Response Time
Arrival Rate (unblocked) Arrival Rate (blocked) Response Time
0 20 40 60 80 100 0 20 40 60 80 100 120 140 160 180 200 CPU Utilization (%) Time DB Web
(a) CPU Utilization
0 1 2 3 4 5 0 20 40 60 80 100 120 140 160 180 200 0 1000 2000 3000 4000 5000 6000 7000 Req./s Milliseconds Time (b) buy 0 0.5 1 1.5 2 2.5 3 3.5 4 0 20 40 60 80 100 120 140 160 180 200 0 1000 2000 3000 4000 5000 6000 Req./s Milliseconds Time (c) pay 0 10 20 30 40 50 60 70 80 90 100 0 20 40 60 80 100 120 140 160 180 200 0 1000 2000 3000 4000 5000 6000 7000 Req./s Milliseconds Time (d) marketing 0 0.2 0.4 0.6 0.8 1 1.2 1.4 1.6 0 20 40 60 80 100 120 140 160 180 200 0 1000 2000 3000 4000 5000 6000 7000 8000 9000 Req./s Milliseconds Time
(e) product selection
0 0.2 0.4 0.6 0.8 1 0 20 40 60 80 100 120 140 160 180 200 0 1000 2000 3000 4000 5000 6000 7000 8000 9000 Req./s Milliseconds Time (f) inventory 0 0.1 0.2 0.3 0.4 0.5 0 20 40 60 80 100 120 140 160 180 200 0 1000 2000 3000 4000 5000 6000 7000 8000 Req./s Milliseconds Time (g) auto bundles
Fig. 8: Experiment with emulated DoS attack, without the performance model (using AD-CPU).
4.3. Importance of the Performance Model
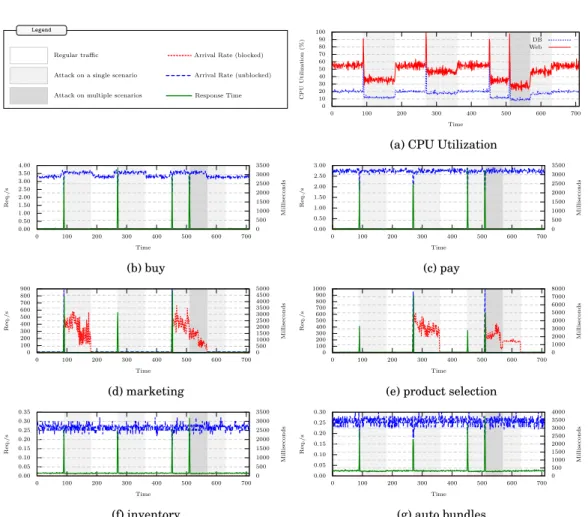
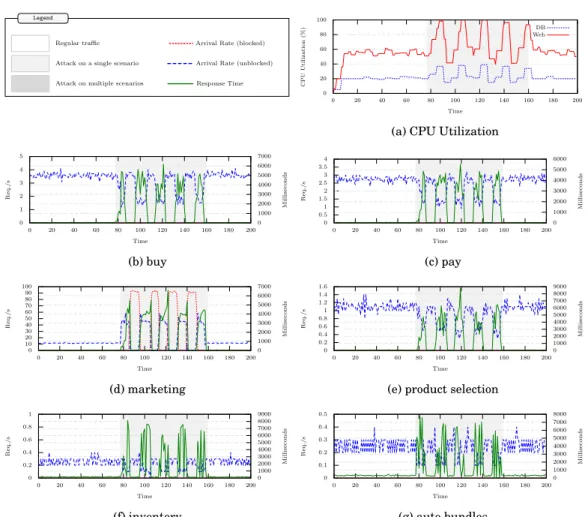
There are several elements to our effective DoS mitigation approach, the most impor-tant being the performance model. To demonstrate its importance to the overall solu-tion, we conducted a series of experiments with and without the performance model to examine the benefits over approaches that employ statistics about the behavior of the web application. In general, approaches that rely on behavior statistics are a) often difficult to generalize to address different variations of DoS attacks, and b) utilize his-torical information, which leaves them vulnerable when new behavior is encountered. In Experiment 2, we show how the mitigation fails when a statistical model that considers CPU Utilization (AD-CPU) is used to create filters. In Experiment 3, we show that manual tuning effort with the statistical model used in Experiment 2 (adding an additional metric, arrival rate, to create AD-CPUAR) can improve its performance, to the point where it successfully mitigates attacks of the style used in Experiments 1-3. Experiment 4 shows how an attack of a more advanced style is not detected by either of the statistical anomaly detection approaches, while the performance model successfully mitigates the attack without additional tuning.
Attack on multiple scenarios Attack on a single scenario Regular traffic Legend
Arrival Rate (unblocked) Arrival Rate (blocked) Response Time
Arrival Rate (unblocked) Arrival Rate (blocked) Response Time
Arrival Rate (unblocked) Arrival Rate (blocked) Response Time
0 10 20 30 40 50 60 70 80 90 100 0 100 200 300 400 500 CPU Utilization (%) Time DB Web
(a) CPU Utilization
0.00 0.50 1.00 1.50 2.00 2.50 3.00 3.50 4.00 0 100 200 300 400 500 0 2000 4000 6000 8000 10000 12000 14000 Req./s Milliseconds Time (b) buy 0.00 0.50 1.00 1.50 2.00 2.50 3.00 0 100 200 300 400 500 0 2000 4000 6000 8000 10000 12000 14000 16000 Req./s Milliseconds Time (c) pay 0 10 20 30 40 50 60 70 80 90 100 0 100 200 300 400 500 0 1000 2000 3000 4000 5000 6000 Req./s Milliseconds Time (d) marketing 0 10 20 30 40 50 60 0 100 200 300 400 500 0 2000 4000 6000 8000 10000 12000 14000 16000 Req./s Milliseconds Time
(e) product selection
0.00 0.05 0.10 0.15 0.20 0.25 0.30 0.35 0 100 200 300 400 500 0 2000 4000 6000 8000 10000 12000 14000 16000 Req./s Milliseconds Time (f) inventory 0.00 0.05 0.10 0.15 0.20 0.25 0.30 0 100 200 300 400 500 0 2000 4000 6000 8000 10000 12000 14000 Req./s Milliseconds Time (g) auto bundles
Fig. 9: Experiment with emulated DoS attack, showing anomaly detection tuned us-ing CPU utilization and Arrival Rate (AD-CPUAR) performus-ing similarly to when a performance model is used.
Experiment 2. In this experiment, we examine the impact of the performance model on the overall solution by employing the same approach to mitigating DoS attacks, except that the decision to remove rules is made based on statistical anomaly detection using CPU utilization metrics (AD-CPU) instead of the complete performance model. We emulated a single DoS attack on one scenario, marketing. We expect a similar ability to detect the start of an attack, but impaired ability to identify the end of an attack.
Results:Figure 8 shows the results, again showing the three metrics for each usage scenario. The algorithm is shown repeatedly filtering and resuming suspicious traffic. Without the performance model, traffic is detected as returning to normal prematurely because the algorithm cannot predict the influence of currently filtered traffic on the overall system performance. Although only one scenario (marketing) is targeted, all of the scenarios experience substantially degraded performance with response times degraded by an order of magnitude. The CPU utilization plot (Figure 8a) shows that the application servers reached 100% utilization, a sign of being badly overloaded.
Experiment 3. We extended the statistical anomaly approach from Experiment 2 by adding a second metric; because the effectiveness of the statistical approach depends
Attack on multiple scenarios Attack on a single scenario Regular traffic Legend
Arrival Rate (unblocked) Arrival Rate (blocked) Response Time
Arrival Rate (unblocked) Arrival Rate (blocked) Response Time
Arrival Rate (unblocked) Arrival Rate (blocked) Response Time
10 20 30 40 50 60 70 80 90 100 0 100 200 300 400 500 600 700 800 CPU Utilization (%) Time DB Web
(a) CPU Utilization
0.00 0.50 1.00 1.50 2.00 2.50 3.00 3.50 4.00 0 100 200 300 400 500 600 700 800 0 1000 2000 3000 4000 5000 6000 7000 8000 9000 Req./s Milliseconds Time (b) buy 0.00 0.50 1.00 1.50 2.00 2.50 3.00 0 100 200 300 400 500 600 700 800 0 1000 2000 3000 4000 5000 6000 7000 8000 Req./s Milliseconds Time (c) pay 0 5 10 15 20 25 30 0 100 200 300 400 500 600 700 800 0 1000 2000 3000 4000 5000 6000 7000 8000 9000 Req./s Milliseconds Time (d) marketing 0 1 2 3 4 5 6 0 100 200 300 400 500 600 700 800 0 1000 2000 3000 4000 5000 6000 7000 8000 Req./s Milliseconds Time
(e) product selection
0.00 0.20 0.40 0.60 0.80 1.00 1.20 0 100 200 300 400 500 600 700 800 0 1000 2000 3000 4000 5000 6000 7000 8000 Req./s Milliseconds Time (f) inventory 0.00 0.05 0.10 0.15 0.20 0.25 0.30 0 100 200 300 400 500 600 700 800 0 1000 2000 3000 4000 5000 6000 7000 8000 9000 Req./s Milliseconds Time (g) auto bundles
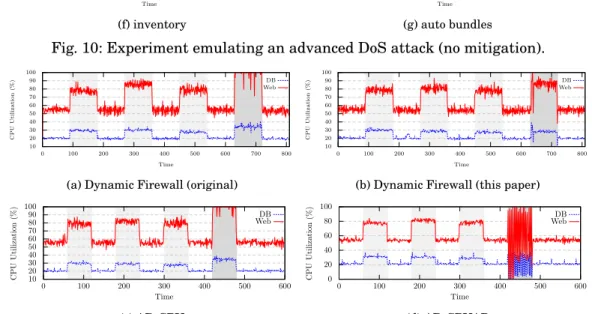
Fig. 10: Experiment emulating an advanced DoS attack (no mitigation).
10 20 30 40 50 60 70 80 90 100 0 100 200 300 400 500 600 700 800 CPU Utilization (%) Time DB Web
(a) Dynamic Firewall (original)
10 20 30 40 50 60 70 80 90 100 0 100 200 300 400 500 600 700 800 CPU Utilization (%) Time DB Web
(b) Dynamic Firewall (this paper)
10 20 30 40 50 60 70 80 90 100 0 100 200 300 400 500 600 CPU Utilization (%) Time DB Web (c) AD-CPU 0 20 40 60 80 100 0 100 200 300 400 500 600 CPU Utilization (%) Time DB Web (d) AD-CPUAR
Fig. 11: CPU Utilization of the web application during an advanced DoS attack for four mitigation approaches.
Attack on multiple scenarios Attack on a single scenario Regular traffic Legend
Arrival Rate (unblocked) Arrival Rate (blocked) Response Time
Arrival Rate (unblocked) Arrival Rate (blocked) Response Time
Arrival Rate (unblocked) Arrival Rate (blocked) Response Time
10 20 30 40 50 60 70 80 90 100 0 100 200 300 400 500 600 700 800 CPU Utilization (%) Time DB Web
(a) CPU Utilization
0.00 0.50 1.00 1.50 2.00 2.50 3.00 3.50 4.00 0 100 200 300 400 500 600 700 800 0 500 1000 1500 2000 2500 3000 3500 4000 4500 Req./s Milliseconds Time (b) buy 0.00 0.50 1.00 1.50 2.00 2.50 3.00 0 100 200 300 400 500 600 700 800 0 500 1000 1500 2000 2500 3000 3500 4000 Req./s Milliseconds Time (c) pay 0 5 10 15 20 25 30 0 100 200 300 400 500 600 700 800 0 500 1000 1500 2000 2500 3000 3500 4000 4500 Req./s Milliseconds Time (d) marketing 0 0 1 2 2 2 3 4 4 4 5 0 100 200 300 400 500 600 700 800 0 200 400 600 800 1000 1200 1400 1600 1800 2000 Req./s Milliseconds Time
(e) product selection
0.00 0.20 0.40 0.60 0.80 1.00 1.20 0 100 200 300 400 500 600 700 800 0 500 1000 1500 2000 2500 Req./s Milliseconds Time (f) inventory 0.00 0.05 0.10 0.15 0.20 0.25 0.30 0 100 200 300 400 500 600 700 800 0 500 1000 1500 2000 2500 3000 3500 4000 Req./s Milliseconds Time (g) auto bundles
Fig. 12: Details of DoS mitigation during an advanced attack, for the Dynamic Firewall using a performance model.
on the selection of metrics, we used our knowledge of the deficiencies identified in the previous experiment and used a combination of CPU utilization and request arrival rate (AD-CPUAR). We used the same three-attack model: one attack on themarketing
scenario, then a second attack on themarketingscenario that overlaps with the third attack on theproduct selectionscenario. The request arrival rate was measured at the reverse proxy beforethe filtering rules were applied, which allows the statistical model to incorporate some information about what would happen if the filtering rules were removed. We expect this incorporation of very basic prediction will be sufficient to address this style of DoS attack, and so expect results similar to Experiment 1. Results:Figure 9 shows the correct behavior, namely the filtering of traffic to the af-fected scenario while the remaining scenarios were unafaf-fected. We have demonstrated the ability to tune a statistical model to correctly respond to this type of DoS attack.
Experiment 4. This experiment demonstrates the non-generality of the behavior-based statistical models, where the same statistical approach may successfully mit-igate several DoS attacks while failing to mitmit-igate others. We tested four ap-proaches: Dynamic Firewall (the approach in this paper), Dynamic Firewall (Original, from [Barna et al. 2012]), AD-CPU, and AD-CPUAR. We consider an advanced DoS at-tack that loads multiple scenarios with traffic that could be handled individually, but
Attack on multiple scenarios Attack on a single scenario Regular traffic Legend
Arrival Rate (unblocked) Arrival Rate (blocked) Response Time
Arrival Rate (unblocked) Arrival Rate (blocked) Response Time
Arrival Rate (unblocked) Arrival Rate (blocked) Response Time
0 20 40 60 80 100 0 100 200 300 400 500 600 CPU Utilization (%) Time DB Web
(a) CPU Utilization
0.00 0.50 1.00 1.50 2.00 2.50 3.00 3.50 4.00 0 100 200 300 400 500 600 0 1000 2000 3000 4000 5000 6000 7000 8000 9000 Req./s Milliseconds Time (b) buy 0.00 0.50 1.00 1.50 2.00 2.50 3.00 0 100 200 300 400 500 600 0 1000 2000 3000 4000 5000 6000 7000 Req./s Milliseconds Time (c) pay 0 5 10 15 20 25 30 0 100 200 300 400 500 600 0 1000 2000 3000 4000 5000 6000 7000 Req./s Milliseconds Time (d) marketing 0 0 1 2 2 2 3 4 4 4 5 0 100 200 300 400 500 600 0 1000 2000 3000 4000 5000 6000 7000 Req./s Milliseconds Time
(e) product selection
0.00 0.20 0.40 0.60 0.80 1.00 1.20 0 100 200 300 400 500 600 0 1000 2000 3000 4000 5000 6000 7000 Req./s Milliseconds Time (f) inventory 0.00 0.05 0.10 0.15 0.20 0.25 0.30 0.35 0 100 200 300 400 500 600 0 1000 2000 3000 4000 5000 6000 7000 Req./s Milliseconds Time (g) auto bundles
Fig. 13: Details of DoS mitigation during an advanced attack, when no performance model is used (AD-CPUAR).
not collectively: no individual scenario is overloaded. To simulate this case, we coordi-nated three traffic generators. In the pre-attack phase, the traffic was increased to the
marketingscenario, then returned to normal levels. Then, we increased traffic to the
product selectionscenario. After returning traffic to normal, traffic to theinventory
scenario was increased and returned to normal. Finally, an attack was launched on all three scenarios simultaneously.
Results:The behavior of the application with no DoS mitigation deployed is shown in Figure 10 as a baseline. The three spikes from the pre-attack phase are visible, but the web application did not significantly deviate from the WAPP and was able to process the load. When the attack launched, the traffic levels peaked simultaneously, and the application server could no longer handle the load: we see all scenarios impacted by the overload, with high response times and high CPU utilization.
To compare an overview of the results for each of the four approaches, consider the CPU utilization graphs in Figure 11. Only Dynamic Firewall shows CPU Utiliza-tion within acceptable ranges; the details of the Dynamic Firewall experiment run are shown in Figure 12. Using the performance model, it was able to detect scenarios that would cause application overload and redirects their traffic through the Analyzer. Two of the scenarios were filtered (marketing and product selection), which was
esti-mated to be sufficient to meet desired performance levels. We then see that the system adapted the redirection rules during the attack; during the iterative fine-tuning, it was estimated that a scenario’s traffic could be unfiltered without impacting performance beyond acceptable levels, and the product selection traffic was unfiltered. This exper-iment demonstrates how the defense mechanism protects the web application while reducing user inconvenience.
The only other approach to take any action at all in response to the attack is shown in Figure 13, where we see all scenarios (even those not under attack) being repeatedly filtered and unfiltered. We discuss possible explanations in the Discussion section. 5. DISCUSSION
Experiment 1 demonstrated our ability to mitigate DoS attacks, both those emulated by a workload generator and those using the LOIC.
An interesting observation from our results is that under normal conditions, arrival rate decreases as the response time increases (see Figure 6b), while under attack con-ditions the arrival rate and response time increase together (see Figure 6d). Higher response time yields more ”think time” from the user, because the time in between two requests includes the waiting time for the reply. This is a natural behaviour when the requests are sent by human operators. However an attacker will typically send requests regardless of the response from the web server.
One of the main advantages of our approach is that while some scenarios are redi-rected through the Analyzer, the rest are functioning normally, with a response time on the order of tens of milliseconds. Another observation is that the restoration is done smoothly, without oscillations or churn, which indicates the filters were not removed prematurely.
In the Dynamic Firewall, the performance model works in tandem with statistical anomaly detection. Experiments 2 and 3 examined what would happen if statistical anomaly detection (a common approach to DoS attack detection) was asked to function without the performance model. We demonstrated two types of statistical anomaly detection (AD-CPU and AD-CPUAR), one where rules were fine-tuned based on CPU utilization (i.e. it was safe to stop filtering traffic once CPU utilization was low enough) and another based on CPU Utilization and Arrival Rate (i.e. once CPU utilization was low enough and arrival rate had decreased, it was safe to stop filtering some traffic). The latter approach was effective at mitigating one type of DoS attack due to an im-proved ability to detect the end of an attack, but im-proved ineffective otherwise. These experiments also demonstrated the importance of selecting the correct metrics for sta-tistical anomaly detection, and correctly tuning the thresholds and metrics.
Experiment 4 tested all four approaches, showing that only the approach described in this paper was capable of detecting and mitigating this type of DoS attack. However, the behavior of all four approaches merits further examination. The Dynamic Firewall (Original) and AD-CPU methods did not detect the DoS attack. Since both methods detect DoS attacks based on threshold models for each scenario, neither could detect a DoS attack on a combination of scenarios. This shows the disadvantages of using sta-tistical anomaly detection to establish filtering rules, as models are sensitive to tuning and parameterization, and may successfully detect some DoS attacks but not others. The basic issue is that statistical anomaly detection is based on an established baseline of application behavior, which is captured by an application under certain conditions. Generalization of statistical models of behavior for complex web applications is still an open question.
The Dynamic Firewall successfully detects the more advanced DoS attack (Fig-ure 12) due to the generality of the performance model. The performance model allows us to estimate application reaction to specific input, which enables the prediction of
application performance degradation before the degradation actually occurs. This pre-dictive element is what is required to detect DoS attacks and mitigate without negative impacts.
The AD-CPUAR approach successfully detected that application is undergoing a DoS attack (Figure 13), but only after application performance was already degraded. It was unable to identify the malicious traffic accurately, and therefore was constantly changing the filtering rules, filtering and unfiltering scenarios whether they were un-der attack or not. This explains the rapid cycling of CPU utilization between 0 and 100%, as traffic is filtered and unfiltered repeatedly. This is a common issue with ap-proaches that are not capable of prediction; the statistical anomaly detection relies on only historical and current information. By making use of historical, current, and esti-mated future information, the performance-model driven approach is able to respond smoothly.
All experiments demonstrate the clear advantages of using the performance model for detecting the beginning and end of DoS attacks, and the potential for using an adaptive algorithm for optimizing rules on the fly.
Threats to Validity
The experiments conducted used realistic web applications and an actual DoS attack tool. However, with only several experiments using the complete approach there is room for additional validation.
The accuracy of the performance model is an important factor in the accuracy of this mitigation approach.
A false positive is when traffic is detected as an attack incorrectly. Because our ap-proach does not block traffic outright but instead forwards to a CAPTCHA test, that traffic is not lost. However, the test may be annoying to users. There were no false positives in our experiments.
A false negative is when malicious traffic is not detected. In our approach, attacks are only detected when the performance of the application suffers; any malicious traffic that does not have a negative impact will not be detected, but is by definition not a true DoS attack. As our approach filters types of traffic until the application’s performance is acceptable, false negatives will not impact the application.
Rather than blocking traffic outright, our approach relies on the use of a test only human users will pass (e.g a CAPTCHA). For our focus of user-facing web applications, this is sufficient to avoid dropping legitimate traffic outright. An extension to this work would consider similar tests to differentiate legitimate automated traffic from malicious automated traffic, for example pre-shared keys or other trust negotiation mechanisms.
This approach is intended to address a popular type of DoS attack, a “fast” application-aware attack where the traffic levels increase sharply. This may not be the best approach to mitigate “slow” application-aware attacks where the traffic in-creases gradually over time; we have not evaluated the performance for this type of attack. As mentioned, we assume existing techniques are in place to defend against attacks not at the application level.
When we compare the effectiveness of our approach to an identical approach that excludes the performance model, we use a threshold model that considers selected per-formance metrics when making decisions. The selection of metrics used — in our case, CPU utilization or combination of arrival rate, but potentially also including response time, arrival rate, throughput, etc. — will impact the behavior of the system. However, regardless of the metrics chosen, they describe only the current state. Because they are not capable of prediction, there is an inherent disadvantage to using only threshold models when compared to our combined threshold and performance model approach.
Though threshold models may perform as well as our combined approach on certain cases, these models would not work as well across a variety of cases and scenarios.
A DoS attack on one scenario does have an impact on the performance metrics of the other scenarios, before the attack is mitigated. Because the performance of a scenario is a factor in creating filtering rules, this may result in incorrectly filtered traffic to sce-narios not under attack. This traffic will have to go to the Analyzer and the legitimate users will need to pass a CAPTCHA test.
6. CONCLUSIONS
We have demonstrated an adaptive architecture, an algorithm, and an implementation that effectively detects and mitigates application-aware DoS attacks. The approach, using a performance model and predicting the impact of traffic to create filters to shape that impact until it is at a level the web application can handle, was able to restore normal response times to a web application that was experiencing a DoS attack. It did so efficiently at a use case scenario level of granularity that reduced the impact on legitimate traffic.
References
APERA. 2009. Application Performance Evaluation and Resource Allocator (APERA). http://www.
alphaworks.ibm.com/tech/apera.
BALBO, G.AND SERAZZI, G. 1997. Asymptotic analysis of multiclass closed queueing networks: multiple
bottlenecks.Performance Evaluation 30,3, 115–152.
BARNA, C., LITOIU, M.,ANDGHANBARI, H. 2011. Autonomic load-testing framework. InAutonomic
Com-puting, 2011. International Conference on. ICAC ’11. ACM, New York, NY, USA, 91–100.
BARNA, C., SHTERN, M., SMIT, M., TZERPOS, V.,ANDLITOIU, M. 2012. Model-based adaptive dos attack
mitigation. InSoftware Engineering for Adaptive and Self-Managing Systems (SEAMS), 2012 ICSE
Workshop on. SEAMS 2012. ACM, New York, NY, USA, 119–128.
DOBBINS, R., MORALES, C., ANSTEE, D., ARRUDA, J., BIENKOWSKI, T., HOLLYMAN, M., LABOVITZ, C., NAZARIO, J., SEO, E.,ANDSHAH, R. 2010. Worldwide Infrastructure Security Report. Tech. rep., Arbor Networks.
EAGER, D. L.ANDSEVCIK, K. C. 1983. Performance bound hierarchies for queueing networks.ACM Trans.
Comput. Syst. 1,2, 99–115.
FRANKS, G., MALY, P., WOODSIDE, M., PETRIU, D. C., HUBBARD, A.,ANDMROZ, M. 2012. Layered
Queue-ing Network Solver (LQNS).http://www.sce.carleton.ca/rads/lqns/.
GARG, A. AND NARASIMHA REDDY, A. L. 2002. Mitigation of DoS attacks through QoS regulation. In
Quality of Service, 2002.10thIEEE International Workshop on. IEEE Computer Society, Washington,
DC, USA, 45–53.
GHANBARI, H., BARNA, C., LITOIU, M., WOODSIDE, M., ZHENG, T., WONG, J.,ANDISZLAI, G. 2011.
Track-ing adaptive performance models usTrack-ing dynamic clusterTrack-ing of user classes. In2ndACM International
Conference on Performance Engineering (ICPE 2011). ACM, New York, NY, USA.
GOMAA, H.ANDMENASCE´, D. A. 2001. Performance engineering of component-based distributed software
systems. InPerformance Engineering, State of the Art and Current Trends. Springer-Verlag, London,
UK, 40–55.
GUNTHER, N. J. 2006.Guerrilla Capacity Planning: A Tactical Approach to Planning for Highly Scalable Applications and Services. Springer-Verlag New York, Inc., Secaucus, NJ, USA.
IMRE, G., LEVENDOVSZKY, T.,ANDCHARAF, H. 2007. Modeling the effect of application server settings on
the performance of j2ee web applications. InTEAA’06: Proceedings of the 2nd international conference
on Trends in enterprise application architecture. Springer-Verlag, Berlin, Heidelberg, 202–216.
JAIN, P., JAIN, J.,ANDGUPTA, Z. 2011. Mitigation of Denial of Service (DoS) Attack.International Journal
of Computational Engineering and Management (IJCEM) 11, 38–44.
JIANG, Z. M., HASSAN, A. E., HAMANN, G.,ANDFLORA, P. 2009. Automated performance analysis of load
tests. InSoftware Maintenance, 2009 (ICSM 2009). IEEE International Conference on. IEEE Computer
Society, Washington, DC, USA, 125–134.
JUELS, A.ANDBRAINARD, J. G. 1999. Client Puzzles: A Cryptographic Countermeasure Against
Connec-tion DepleConnec-tion Attacks. InNetwork and Distributed System Security Symposium (NDSS)(2005-02-07).