CuadernosdeEconomía(2017)40,14---30
www.elsevier.es/cesjef
Cuadernos
de
economía
ARTICLE
Dollarization
and
the
relationship
between
EMBI
and
fundamentals
in
Latin
American
Countries
夽
María
Lorena
Mari
del
Cristo
a,
Marta
Gómez-Puig
b,∗aDepartmentofEconomics,UniversitatdeBarcelona,Av.Diagonal696,08034Barcelona,Spain
bDepartmentofEconomicsandRiskcenter,UniversitatdeBarcelona,Av.Diagonal696,08034Barcelona,Spain
Received6October2016;accepted10October2016
Availableonline10January2017
JEL CLASSIFICATION C32; E44; F30 KEYWORDS Dollarization; Emergingmarkets; LatinAmerican countries; CointegratedVAR; EmergingMarkets BondIndex;
Exchangerateregime
Abstract Thispaperpresentsempiricalevidenceontheinterrelationshipthatexistsbetween theevolutionoftheEmergingMarketsBondsIndex(EMBI)andsomemacroeconomicvariables insevenLatinAmericancountries;twoofthem(EcuadorandPanama),fulldollarized.Wemake useofaCointegratedVectorframeworktoanalyzetheshortruneffectsfrom2001to2009.The resultssuggestthatEMBIismorestableindollarizedcountriesandthatitsevolutioninfluences economicactivityinnon-dollarizedeconomies;suggestingthatinvestors’confidencemightbe higherindollarizedcountrieswhererealandfinancialeconomicevolutionarelessvulnerable toexternalshocksthaninnon-dollarizedones.
© 2016 Asociaci´onCuadernos de Econom´ıa. Publishedby Elsevier Espa˜na, S.L.U. All rights reserved.
夽 FinancialsupportfromSpanishMinistryofEconomyand CompetitivenessthroughgrantECO2016-76203and throughPlanEstatalde
InvestigaciónCientíficayTécnicaydeInnovaciónisgratefullyacknowledged.TheauthorswouldliketothankKatarinaJuseliusfortheir usefulandinterestingcommentsandsuggestions.
∗Correspondingauthor.
E-mailaddress:marta.gomezpuig@ub.edu(M.Gómez-Puig). http://dx.doi.org/10.1016/j.cesjef.2016.10.002
CÓDIGOSJEL C32; E44; F30 PALABRASCLAVE Dolarización; Mercados emergentes; Países latinoamericanos; VARcointegrado; IndicadordeBonos deMercados Emergentes; Régimendetipos decambio.
DolarizaciónyrelaciónentreEMBIyfundamentosenlospaíseslatinoamericanos
Resumen Estedocumentoaportalaevidenciaempíricadelainterrelaciónexistenteentrela evolucióndelIndicadordeBonosdeMercadosEmergentesyciertasvariablesmacroeconómicas en7paíseslatinoamericanos,deentreloscuales2deellos (EcuadoryPanamá),están ple-namentedolarizados.Utilizamoselmarcodelvectorcointegradopara analizarlosefectosa cortoplazodesde2001a2009.LosresultadosindicanqueelIndicadordeBonosdeMercados Emergentesesmásestableenlospaísesdolarizados,yquesuevoluciónejerceunainfluencia sobrelaactividadeconómicadelaseconomíasnodolarizadas,locualapuntaaquelaconfianza delosinversorespudierasersuperiorenlospaísesdolarizados,dondelaevolucióneconómica realyfinancieraesmenosvulnerablealosshocksexternosqueenlospaísesnodolarizados. © 2016Asociaci´onCuadernos deEconom´ıa. Publicado porElsevier Espa˜na,S.L.U. Todoslos derechosreservados.
1.
Introduction
Theglobal financialandeconomiccrisis of2008---2009 had a muchsmaller impacton emergingLatin American mar-kets than on their US and European counterparts. While LatinAmericancountrieshavecontinuedtogrowanddonot present major macroeconomic imbalances, the advanced economiesstilldonotpresentsolidrecovery(Figs.1and2
jointlywithTables1and2,showtheevolutionofGDPgrowth andofthegovernment-debt-to-GDPratiointhetwogroups of countries). The marginal exposure of banks in emerg-ingmarketstoUSsubprimeassets andtheir governments’ expansivemonetary andfiscalpoliciestostimulate aggre-gatedemandmightexplainthesedifferences(seeAizenman etal.,2013).However,someauthorshaveanalyzedwhether exchangerateregimeshaveplayedapart.1
Thispaperhastwomainobjectives.Thefirstisto empir-icallyinvestigate theroleof fundamentalsinthe reduced vulnerability to shocks observed in the bond markets of seven Latin American countries, and how this reduced vulnerability has in turn affected macroeconomic funda-mentals. The second is to determine whether there are any differencesbetween countriesthat canbe attributed totheirexchangerateregime.Specifically,weaimto com-parecountrieswithandwithoutafully-dollarizedeconomy. Tothisend,weempiricallyassesstherelationshipbetween keyeconomicfactorssuchastheexternaldebt-to-exports ratioandinflation,andtheEmergingMarketsBondsIndex (EMBI)2duringthesampleperiod2001---2009.Inthesecond
1Theresultsarenotconclusive,though.WhilstKrugman(2013) showshow Eurozonemembers have had moretrouble managing theirdebtsthancountriesoutsideit,Rose(2013)suggeststhatthe exchangerateregimedoesnotmatter.
2The JP Morgan Emerging Markets Bonds Index Global tracks totalreturnsfortradedexternaldebtinstrumentsinemerging mar-kets.TheEMBIGlobalincludesUSdollar-denominatedBradybonds, loans,and Eurobonds withan outstandingfacevalueofat least $500million.Dailyhistoricalindexlevelshavebeenreportedsince December31,1993.SeeMorgan(1999)formoredetails.
2001 2002 2003 2004 2005 2006 2007 2008 2009 2010 2011 2012 20 40 60 80 100 120 140 Panama Brazil Colombia Mexico Argentina Chile Ecuador
Figure1 Total CentralGovernment Debt-to-GDP ratio (%).
(LatinAmericancountries’evolution.)
2001 2002 2003 2004 2005 2006 2007 2008 2009 2010 2011 2012 20 40 60 80 100 120 140 Belgium Greece Italy United States France Ireland Portugal
Figure2 Total CentralGovernment Debt-to-GDP ratio (%).
16 M.L.MaridelCristo,M.Gómez-Puig
Table1 AnnualGDPrateofgrowth.
Year Argentina Brazil Colombia Chile Mexico Ecuador Panama
2001 −4.45 1.31 1.71 3.35 −0.03 3.97 0.00 2002 −10.84 2.65 2.48 2.19 0.77 4.11 2.40 2003 8.76 1.15 3.91 3.92 1.39 2.82 4.68 2004 9.03 5.71 5.34 6.03 4.21 8.24 7.46 2005 9.18 3.15 4.71 5.60 3.07 5.32 6.94 2006 8.51 3.95 6.68 4.58 4.97 4.33 8.44 2007 8.65 6.09 6.90 4.53 3.22 2.07 12.57 2008 6.71 5.17 3.59 3.67 1.37 6.33 10.10 2009 0.86 −0.33 1.61 −0.99 −4.74 0.63 3.86 2010 9.16 7.53 3.97 5.73 5.20 3.59 7.44 2011 8.86 2.73 6.67 5.89 3.83 7.75 10.82 2012 1.88 1.02 4.20 5.50 3.94 5.11 10.93
Table2 AnnualGDPrateofgrowth.
Year Belgium France Greece Ireland Italy Portugal UnitedStates
2001 0.80 1.83 4.19 4.98 1.86 1.97 0.94 2002 1.35 0.92 3.43 5.41 0.45 0.76 1.77 2003 0.80 0.89 5.94 3.72 −0.04 −0.91 2.79 2004 3.27 2.54 4.36 4.19 1.73 1.56 3.79 2005 1.75 1.82 2.28 6.08 0.93 0.77 3.35 2006 2.66 2.46 5.50 5.50 2.19 1.44 2.66 2007 2.88 2.28 3.53 4.97 1.68 2.36 1.78 2008 0.98 −0.08 −0.21 −2.16 −1.15 −0.01 −0.29 2009 −2.80 −3.14 −3.13 −6.38 −5.49 −2.90 −2.80 2010 2.32 1.72 −4.94 −1.06 1.72 1.93 2.50 2011 1.76 2.02 −7.10 2.16 0.47 −1.25 1.84 2012 −0.13 0.01 −6.37 0.15 −2.53 −3.22 2.77
stageofthestudy,weaimtoestablishwhetherthereare rel-evantdifferencesinthetwogroupsofcountries(dollarized andnon-dollarizedeconomies).
Areviewoftheempiricalliteratureshowsthatourfirst questionhas usuallybeen approached throughananalysis of the main determinants of country risk premium.3 For instance,Edwards(1986)usesdataonyieldsof167bonds floatedby13LeastDevelopedCountries(LDC)between1976 and1980toanalyzethefactors thatdeterminethe coun-tryriskpremium. Hepresentsevidencethatbondspreads depend positivelyon the countries’level of indebtedness andnegativelyonthelevelofinvestmenttheyundertake.
NoguésandGrandes (2001),focusing onmonthlydata for Argentinabetween1994and1998andestimatingits econo-metric model by OLS, conclude that endogenous factors suchastheexternaldebt-to-exportsratio,thefiscaldeficit, growth expectations, contagion effects or political noise arethedeterminantsofArgentina’scountryrisk. Gónzalez-Rozadaand LevyYeyati (2008),however,estimating panel error-correctionmodelsofemergingspreads onhigh-yield corporate bonds in developed markets and international
3Countryriskreferstothelikelihoodthatasovereignstate (bor-rower)may be unable and/or unwilling to meet its obligations towardsforeignlendersand/orinvestors(Krayenbuehl,1985).
rates(USTreasurybills)andusinghighfrequency(monthly, weekly anddaily) datafrom33 emergingeconomies, find thatglobal(exogenous)factorsexplainover50percentof thelongrunvolatilityofemergingmarketspreads.
Tosumup,thecountryriskpremiumhasgenerallybeen proxiedintheliteraturebysovereignspreads.Specifically, thespreadofJPMorgan’sEMBIGlobalindexoverUS Trea-suriesbillsinLatinAmericacountriesisthemostimportant referenceforprospectiveinvestorsinthisarea.
Theresearchsofaronthedeterminantsofcountryrisk canbeclassifiedinthreegroups.4First,certainauthorshave found a significant correlation between macroeconomic-politicalvariablesandtheriskpremium(HotiandMcAller, 2004;Baldaccietal.,2008;Aizenmanetal.,2013).Authors inthesecondgrouphaveemphasizedtheeffectof exoge-nousfactors(globalfactors,contagioneffects,capitalflows or ‘‘investor’s sentiment’’) on risk premium(Eichengreen and Mody, 1998; Kamin and VonKleist, 1999; Schuknecht et al., 2009, 2010). Finally, authors in the third group
4Theliteratureoncountryriskisessentiallyfourdecadesold.The twopioneeringarticleswerepublishedbyFrankandCline(1971) andFederandJust(1977).Sincethen,authorshaveattemptedto establish thedeterminants and theeconometriccriteriato esti-mate,evaluate,andforecastcountryriskindifferenteconomies.
relate country risk and the exchange rate regime. They consider that investors want to know two major compo-nentsofcountryriskpremium:thecurrencypremium,which canbe measured astheyield spreadbetween non-dollar-denominatedandUSdollar-denominatedsovereigndebtof thesameborrowingcountry,andthecreditpremium, mea-suredastheyieldspreadbetweenthedollar-denominated sovereign debt of the emerging country and US Treasury bills.Thereisacertainconsensusinsidethethirdgroupof authorsthatdollarizationandhardpegswouldsubstantially reduce the country risk of emerging countries(Domowitz etal.,1998;Rubinstein,1999;Schmukler,2002).
Theaimofthispaperistocontributetothisbranchofthe literaturebyexaminingtheimpactofmacroeconomic fun-damentalsonriskpremiumandviceversa,sincemovements ingovernmentbondyieldsmayhavesignificant macroeco-nomicconsequences,(seeCaceresetal.,2010).
The literature onthe determinants of EMBI in specific LatinAmericancountriesis stillscarce.Fracasso (2007),a goodreferenceforBrazil(heshows thatforeigninvestors’ appetite for risk impacts substantially on EMBI spreads)5;
NoguésandGrandes(2001)forArgentina,whohighlightthat devaluation risk elimination may not have a statistically significant impact on country risk (other macroeconomic variables such as the external debt-to-exports ratio and growthexpectationspresentahigherimpact);Vargasetal. (2012),forColombia,whopresentevidencethat improve-mentoffiscalvariablesreducesthesovereignriskpremium;
López Herreraet al.(2013) for Mexico,whofindlong-run relationships between domestic macroeconomic variables andtheMexicanEMBI;LindaoJuradoandErazoBlum(2009)
forEcuadorwhoconcludethatdebtandtheinflationarethe mostimportantfactorsforexplainingitscountryrisk;Délano andSelaive(2005),whoexamineChilean’sEMBIbehaviour andconcludethatapproximately25%ofthevariabilityofthe sovereignspreadisduetoglobalfactors,andfinallytheIMF (2010) whichemphasizes that achievinginvestment grade lowersPanamaniandebtspreadsbyover140basispoints.
The restofthepaperisorganizedasfollows.Section2
discussesthetheoreticalframeworkwhileSection3outlines the data and the econometric model usedin the empiri-calanalysis.Section 4reports the main empiricalresults, comparingdollarizedandnon-dollarizedcountries.Finally, Section5presentsthemainconclusions.
2.
Country
risk
and
EMBI
determinants
2.1. Theequilibriumconditionforarisk-neutral
lender
Following Edwards (1986), in an emerging or developing countrythatcannotaffecttheworldinterestrate,thecost ofexternal fundsisformed bytwoconcepts: (1)the risk-freeworldinterestrate(i*)and(2)acountryriskpremium (s) related tothe probabilityof default perceived by the lender(p).Inthecaseofaone-periodloan,whereincaseof
5Infinancialjargon,theinvestors’degreeofriskaversionis usu-allycalled‘‘investorappetiteforrisk’’.
defaultthelenderlosesboththeprincipalandtheinterest, theequilibriumconditionforarisk-neutrallenderis: (1−p)[1+i∗+s]=(1+i∗) (1)
Fromhere,thecountryriskpremiumis: s= p 1−p k (2) wherek=1+i*.
Since the probability of default depends positively on thedebt-to-GDPratio,astheseminalarticlebyEatonand Gersowitz(1981)demonstrated,thecountrythenfacesan upwards-slopingsupplycurveforforeignfunds.Asthe prob-abilityofdefaultapproachesone,thecountryriskpremium approachesinfinityandacreditceilingwillbereached.The countryinquestion willhavedifficulties gainingaccessto theworld’screditmarket.Ifthevariablesthatcomprisethe probabilityofdefaultperceivedbylenderswereknown,the countriesmightbeabletoimprovetheminordertoreduce ittozero.
AccordingtoEdwards(1986),phasthefollowinglogistic function:
p= exp
ˇiXi
1+expˇiXi (3)
whereXiarethedeterminantsofthesovereignriskpremium
andˇiarethecorrespondingcoefficients.Combining(2)and
(3),taking logarithmsandaddingarandomdisturbanceε, theequationtobeestimatedis:
logs=logk+ˇiXi+ε (4)
The signsof this equationchange slightly ifthe model isdescribed interms of returns.Transforming Eq.(1),we obtain:
(1−p)[1+r∗−s]=(1+r∗) (5) wherer*istherisk-freeworldreturnandsrepresents,this time,thereductionintermsofreturnonthebond invest-ment,andk*=1+r*.OurEq.(4)thenonlychangesthesigns: logs=logk∗+ˇiXi+ε (6) Moving terms, we obtain the emerging country return dependingonthesamedeterminantsofcountryrisk: logs−logk∗+ˇiXi+ε (7)
2.2. Determinantsofeachcountryreturnindex
Boththeoreticaland empirical studies have highlighted a largenumberofvariablesthatmayaffecttheevolutionof governmentdebt returns in emerging countries.6 We can splitthesevariablesintothreegroups:economic-financial, socio-political,andglobalfactors.
Table3detailssomeofthevariablesusedinthe empir-icalliterature by a wide range of authors to explain the
6SeeHotiandMcAller(2004)andMaltritzandMolchanov(2013), whichpresentasummaryoftheexplanatoryvariablesand econo-metricmodelsusedinpreviouslypublishedempiricalarticles.
18 M.L.MaridelCristo,M.Gómez-Puig
Table3 Variablesusedintheliteratureonsovereignreturns’analysisinemergingcountries.
Variable Description/authors
Economicandfinancialvariables
Debt-to-GDPratio Themostimportantvariable,sinceinmosttheoreticalmodelsofforeign borrowingitisincludedasanimportanttriggeringfactortoborrowerstodefault (EatonandGersowitz,1981;Edwards,1986,1986).Ithasalsobeenincludedin
empiricalstudies(Aizenmanetal.,2013;EichengreenandMody,1998).
InternationalreservestoGNPorGDP Measuresthesolvencyheldbyacountry.(SeeEdwards,1986;Aizenmanetal.,
2013;RowlandandTorres,2004,tonameafew).
Investment-to-GNP/GDPratio;GDP
percapitagrowth;Industrial
production.
Thesevariablescapturethecountry’sprospectsforfuturegrowth.Thereare
othervariablesusedintheliterature,though,suchasthegrowthratemeasured
bythedifferencebetweenthelogsofGDPintimetandt−1.(SeeNoguésand
Grandes,2001;Edwards,1986orAizenmanetal.,2013)
Currentaccount-to-GNP/GDPratio Solvencyvariables.(SeeEdwards,1986;NoguésandGrandes,2001;orAizenman
etal.,2013).
Externaldebtservice-to-exports
ratio;Externaldebt-to-GDPratio;
Externaldebt-to-exports.
Thesevariablescapturetheintertemporalliquiditysituationofacountry.
(Edwards,1986;NoguésandGrandes,2001;Aizenmanetal.,2013;Rowlandand Torres,2004).
Imports-to-GNPratio;Trade
openness(ExportsplusImports)%
ofGDP;Termsoftrade
Thesevariablesgaugetheimportanceoftrade.(SeeEdwards,1986;Aizenman
etal.,2013;orBaldaccietal.,2008)
Indexofrealeffectiveexchangerate SeeEdwards(1986)orGónzalez-RozadaandLevyYeyati(2008).
Fiscalbalance-to-GDPratio. Thisvariablemeasuresthecountry’sfiscalsustainability.(SeeNoguésand
Grandes,2001;Gónzalez-RozadaandLevyYeyati,2008;orBaldaccietal.,2008).
Inflationrate SeeBaldaccietal.(2008)orAizenmanetal.(2013).
Socialandpoliticalvariables
Politicalnoise NoguésandGrandes(2001)focusedonArgentinaandtestedthepoliticalnoise
associatedwiththeresignationoftheMinisterCavallothroughadummyvariable
thattookthevalue1intheperiodofuncertaintythatledtohisresignation.
Globalfactors
Externalfinancialshocks NoguésandGrandes(2001)capturethemusingtherateofthe30-yearUS
Treasurybonds,whilstGónzalez-RozadaandLevyYeyati(2008)usethe10-year
USTreasuryrate.
Contagioneffects Theycanbecapturedeitherbydummiesorbyvariablessuchasothercountries’
returns.Forinstance,NoguésandGrandes(2001)includedtheJPMorganPrice
indexofMexicanbondstomeasureitsrelationshipwiththecountryriskof
Argentina.Theyexpectedthatthehistoricalsimilarities(intermsofeconomic
policyandresponsetoexternalshocks)betweenMexicoandArgentinawould
resultinasimilarbehaviouroftheirgovernments’returns,beyond
fundamental-basedreasons.
Marketsentiment DiazWeigelandGemmill(2006)analyzeasampleofemergingcountriesusing
variablessuchasUSandregionalstockreturnsoroilpricesasproxiesofglobal
factorsandmarketsentiment.
determinants of government debt returns in emerging countries,whilstTable4describesthevariablesusedinour model.
3.
Data
and
empirical
approach
3.1. Dataandvariables
Table4providesthedescriptionofthevariablesalongwith thedatasources.Weincludedfourendogenousvariablesin oureconometric model. The EMBI(with its monthly aver-age calculated from daily data, in order to eliminate its heteroscedasticity and because the rest of variables are
available atthis frequency),along withvariablesthatare onlyreportedmonthly,suchastheEconomicActivityIndex (eai).Thisvariablewasusedtomeasurethegrowth perspec-tiveinthecaseofArgentina,ColombiaandEcuador,while thegrowthperspectivewasproxiedbytheIndustrialActivity Index(iai)inMexico,theIndustrialIndex(ii)inBrazil,the IndustrialProductionIndex(ipi)inChileand,finally,the rev-enuesfromtaxestocrosstheCanalinthecaseofPanama.7
7TheEconomicActivityIndexforArgentina,Ecuadorand Colom-biaispresentedasthemonthlyproxyofGDPbytheirrespective NationalStatisticInstitutes.InthecaseofMexicoweusethe Indus-trialActivityIndexinsteadoftheGlobalEconomicActivityIndex
Table4 Variablesusedinourcomparativestudy.
Variable Observations Source
LEMBIcountry Monthlyaveragehasbeencalculated
fromdailyreportedJPMorganEMBI.
Datastream LEAI,LIAI,LII,LIPI,LREV(These
variablesrepresentgrowth expectations.Thevariableused dependsondataavailabilityin eachcountry).
LEAI:Economicactivityindexin Argentina,ColombiaandEcuador. LIAI:Industrialactivityindexin Mexico.
LII:IndustrialIndexinBrazil. LIPI:Industrialproductionindexin Chile.
LREV:Revenuesfromtaxesleviedin thePanamaCanal.
Argentina:StatisticalNationalInstitute (www.indec.mecon.ar)
Brazil:BrazilianStatisticaland
GeographicalInstitute(www.ibge.gov.br)
Colombia:CentralBankofColombia
Republic(www.banrep.gov.co)
Chile:NationalStatisticalInstitute
(www.ine.cl)
Ecuador:CentralBank(www.bce.ec)
Mexico:NationalStatisticaland
GeographicalInstitute(www.Inegi.org.mx)
Panama:NationalContraloria
(www.contraloria.gob.pa)
INF Inflationstatisticsinthecaseof
Ecuador,butintherestofthe
countriesthedifferenceinthe
ConsumerPricesIndexisused
Ecuador:CentralBank
Restofcountries:ECLAC.
LDEBTX Externaldebt-to-exportsratio EconomicCommissionoftheLatin
AmericanandCaribbeancountries(ECLAC).
InPanamaweusedthisvariablebecausealltheothersectors ofitseconomydependonCanalactivities,asdoother mar-ketssuchasthelabourmarket.Theothermonthlyvariables aretheinflationrate(inf),whichwashasbeen calculated fromtheConsumerPriceIndexinallthecountries,except inEcuadorwhereitwasdirectlyrecorded,andtheexternal debt-to-exportsratio(debt x),whichcapturesthecurrent accountsolvencyofemergingcountries.
Theimpactofglobalriskfactorswillbecapturedthrough theinclusionofdummies.
3.2. Econometricapproach:identificationofthe
shortrunstructureintheCointegratedVAR(CVAR)
Consider the Cointegrated VAR model in the so-called reducedformrepresentation:
xt=1xt−1+˛ˇxt−1+˚Dt+εt, εt∼IN(0,˝) (8)
Pre-multiplying(8) withanon-singularp×p matrixA0, weobtaintheso-calledstructuralformrepresentation: A0xt=A1xt−1+˛ˇxt−1+A0˚Dt+vt, vt∼INp(0,˙)
(9) whereA1=A01,a=A0˛,vt=A0εt
Theshortrunequationsconsistofpequationsbetween p current variables, xt,p(k−1)lagged variables (xt−i,
because the latter,not only does not includeall thesectors of theeconomy,butalsoisstillapreliminaryvariablethatisbeing adjustedbyprivate andpublicenterprisesover time.Indeed,in Mexico,theIndustrialIndexhashistoricallybeenusedasaproxyof GDPbecausetheirstrongco-movements(OECD,2012).Braziland ChilemodelsincludetheIndustrialIndexaswell,butthistimethe reasonisdataavailabilityconstraint.
i=1,...,k−1),andrlagged equilibriumerrors,(ˇc)x
t−1. Identificationoftherlongrunrelationshipsrequiresatleast r−1restrictions oneach relationship, while identification ofthesimultaneousshortrunstructureof thep equations requiresatleastp−1restrictionsoneachequation.
Keeping the properly identified cointegrating relation-shipsfixedattheirestimatedvalues,i.e.bytreating(ˇc)x
t−1 aspredetermined stationary regressors, asin the case of xt−i, it is easier to identify the simultaneous short run
structure.Weidentifythelongrunrelationshipsfirst,and thentheshortrunadjustmentparameters.
Theunrestrictedshortrunreducedformmodelis iden-tified exactly by the p−1 zero restrictions on each row of A0=I. Further zero restrictions on 1, ˛ and ˚ are over-identifying.Thus,theprocessofidentificationconsists firstlyin individually testing whether alllagged variables, thelongrunstructure,anddummyvariablesarestatistically significantinthesystem.Thenextstepistoremovethe non-significantvariablesfromthesystem,sothatthegenerally identifiedmodelonlycontains significantcoefficients.The significantcoefficientswillidentifytheshortrunadjustment parametersandthe long runrelationships thataffect the dependentvariablesofoursimultaneousequations system whichisestimatedbymaximumlikelihood.8
4.
Empirical
results
4.1. Econometricsteps
First, we estimated an unrestricted VAR for each coun-try with the following structure: Xt=[EMBI, eai, inf,
debt x].Previously,allthevariablesweretransformedinto
20 M.L.MaridelCristo,M.Gómez-Puig
Table5 Residualanalysis.
(a)Argentina
Testsforautocorrelationandlaglengthdetermination
Model k T Regr Log-Lik SC H-Q LM(k)
VAR(2) 2 102 20 1060.174 −17.160 −18.385 0.582
VAR(1) 1 102 16 1032.474 −17.343 −18.323 0.000
Univariatestatistics
ARCH(2) Normality R-squared
DLEMBI M ARG 3.732[0.155] 5.806[0.055] 0.697
DLEAI 0.252[0.881] 0.204[0.903] 0.945
DINF 12.131[0.002] 4.875[0.087] 0.852
DLDEBTX 1.473[0.479] 17.219[0.000] 0.416
(b)Brazil
Testsforautocorrelationandlaglengthdetermination
Model k T Regr Log-Lik SC H-Q LM(k)
VAR(3) 3 102 13 1052.667 −18.283 −19.079 0.212
VAR(2) 2 102 9 1031.318 −18.590 −19.141 0.031
VAR(1) 1 102 5 1018.918 −19.072 −19.378 0.151
Univariatestatistics
ARCH(3) Normality R-squared
DLEMBIMBRA 6.537[0.088] 7.799[0.020] 0.353
DLII 0.337[0.953] 0.048[0.976] 0.417
DINF 1.399[0.706] 2.892[0.236] 0.516
DLDEBTX 5.180[0.159] 1.851[0.396] 0.336
(c)Colombia
Testsforautocorrelationandlaglengthdetermination
Model k T Regr Log-Lik SC H-Q LM(k)
VAR(2) 2 102 20 946.132 −14.924 −16.149 0.722
VAR(1) 1 102 16 909.039 −14.922 −15.902 0.000
Univariatestatistics
ARCH(2) Normality R-squared
DLEMBICO 2.497[0.287] 5.191[0.075] 0.501
DLDEBTX 1.316[0.518] 2.178[0.337] 0.553
DLIMACO 1.075[0.584] 9.972[0.007] 0.887
DINF 0.783[0.676] 1.328[0.515] 0.661
(d)Chile
Testsforautocorrelationandlaglengthdetermination
Model k T Regr Log-Lik SC H-Q LM(k)
VAR(3) 3 102 24 1133.568 −17.874 −19.344 0.138
VAR(2) 2 102 20 1107.698 −18.092 −19.317 0.004
Table5 (Continued)
Univariatestatistics
ARCH(3) Normality R-squared
DLEMBICH 6.776[0.079] 1.367[0.505] 0.632
DLIPI 1.186[0.756] 0.389[0.823] 0.858
DINF 0.208[0.976] 2.704[0.259] 0.609
DLDEBTX 0.848[0.838] 0.252[0.882] 0.608
(e)Mexico
Testsforautocorrelationandlaglengthdetermination
Model k T Regr Log-Lik SC H-Q LM(k)
VAR(4) 4 102 17 773.042 −12.074 −13.116 0.189
VAR(3) 3 102 13 748.491 −12.318 −13.115 0.002
VAR(2) 2 102 9 714.167 −12.371 −12.922 0.000
VAR(1) 1 102 5 693.836 −12.698 −13.004 0.003
Univariatestatistics
ARCH(4) Normality R-squared
DLEMBIMX 8.903[0.064] 3.879[0.144] 0.654
DIAI 16.944[0.002] 1.125[0.570] 0.547
DINF 11.197[0.024] 2.921[0.232] 0.558
DLDEBTX 7.688[0.104] 3.403[0.182] 0.409
(f)Ecuador
Testsforautocorrelationandlaglengthdetermination
Model k T Regr Log-Lik SC H-Q LM(k)
VAR(2) 2 139 20 1978.853 −25.633 −26.635 0.081
VAR(1) 1 139 16 1931.693 −25.522 −26.324 0.000
Univariatestatistics
ARCH(2) Normality R-squared
DLEMBIMEC 9.820[0.007] 12.068[0.002] 0.741
DLEAI 1.248[0.536] 0.021[0.990] 0.663
DINF 2.059[0.357] 0.065[0.968] 0.775
DLDEBTX 4.122[0.127] 2.100[0.350] 0.469
(g)Panama
Testsforautocorrelationandlaglengthdetermination
Model k T Regr Log-Lik SC H-Q LM(k)
VAR(2) 2 102 20 1039.011 −16.745 −17.970 0.589
VAR(1) 1 102 16 1016.394 −17.027 −18.007 0.029
Univariatestatistics
ARCH(2) Normality R-squared
DLEMBI MPANA 1.942[0.379] 3.805[0.149] 0.614
DLEREVC 0.118[0.943] 1.647[0.439] 0.745
DINF 3.593[0.166] 0.162[0.922] 0.634
22 M.L. Mari del Cristo, M. Gómez-Puig
Table6 Johansentests.
p−r r Eig.value Trace Trace Frac95 P-value P-Value p−r r Eig.value Trace Trace Frac95 P-value P-value
(a)Argentina (b)Brazil
4 0 0.253 57.195 53.353 47.707 0.004 0.013 4 0 0.356 84.746 77.834 63.659 0.000 0.002 3 1 0.124 26.531 25.002 29.804 0.117 0.166 3 1 0.226 39.058 36.872 42.770 0.115 0.178 2 2 0.106 12.589 11.831 15.408 0.131 0.167 2 2 0.112 12.412 11.780 25.731 0.782 0.824 1 3 0.007 0.781 0.714 3.841 0.377 0.398 1 3 0.001 0.114 0.110 12.448 1.000 1.000 (c)Colombia (d)Chile 4 0 0.263 51.127 49.007 47.707 0.022 0.037 4 0 0.271 52.125 49.204 47.707 0.017 0.035 3 1 0.138 19.146 18.491 29.804 0.493 0.540 3 1 0.131 19.239 18.217 29.804 0.487 0.560 2 2 0.029 3.502 3.242 15.408 0.932 0.947 2 2 0.037 4.696 4.139 15.408 0.837 0.886 1 3 0.004 0.454 0.343 3.841 0.500 0.558 1 3 0.007 0.741 0.549 3.841 0.389 0.459
(e)Mexico (f)Ecuador
4 0 0.375 74.024 67.332 47.707 0.000 0.000 4 0 0.289 66.145 61.757 47.707 0.000 0.001 3 1 0.141 25.549 23.741 29.804 0.147 0.219 3 1 0.195 29.970 28.117 29.804 0.048 0.078 2 2 0.089 9.849 8.448 15.408 0.298 0.426 2 2 0.064 6.956 6.563 15.408 0.589 0.634 1 3 0.003 0.303 0.283 3.841 0.582 0.595 1 3 0.000 0.001 0.001 3.841 0.970 0.972 (g)Panama 4 0 0.323 83.576 79.508 47.707 0.000 0.000 3 1 0.235 42.641 40.886 29.804 0.001 0.001 2 2 0.128 14.546 13.868 15.408 0.068 0.086 1 3 0.001 0.104 0.099 3.841 0.747 0.754
and the relationship between EMBI and fundamentals 23
Table7 Exclusiontests.
(a)Argentina (b)Brazil
r DFG 5%CV LEMBI M ARG LEAI INF LDEBT X r DFG 5%CV LEMBI M BRA LII INF LDEBT X
1 1 3.841 0.177[0.674] 0.160[0.689] 46.649[0.000] 0.148[0.701] 1 1 3.841 1.682[0.195] 8.402[0.004] 9.067[0.003] 2.262[0.133] 2 2 5.991 15.169[0.001] 1.422[0.491] 61.128[0.000] 3.340[0.188] 2 2 5.991 4.477[0.107] 21.536[0.000] 23.366[0.000] 5.754[0.056] 3 3 7.815 21.412[0.000] 8.798[0.032] 64.226[0.000] 11.312[0.010] 3 3 7.815 12.327[0.006] 32.972[0.000] 34.786[0.000] 15.161[0.002]
(c)Colombia (d)Chile
r DFG 5%CV LEMBI CO LIMACO INF LDEBT X r DFG 5%CV LEMBI CH LIPI INF LDEBT X
1 1 3.841 6.244[0.012] 11.050[0.001] 2.505[0.113] 3.386[0.066] 1 1 3.841 3.280[0.070] 10.785[0.001] 12.279[0.000] 4.749[0.029] 2 2 5.991 6.793[0.033] 18.160[0.000] 17.016[0.000] 3.791[0.150] 2 2 5.991 5.856[0.053] 16.712[0.000] 18.250[0.000] 8.666[0.013] 3 3 7.815 18.919[0.000] 30.095[0.000] 29.917[0.000] 15.027[0.002] 3 3 7.815 8.233[0.041] 19.840[0.000] 21.572[0.000] 12.050[0.007]
(e)Mexico (f)Ecuador
r DFG 5%CV LEMBIMX IAI INF LDEBTX r DFG 5%CV LEMBIMEC LEAI INF LDEBTX
1 1 3.841 0.002[0.961] 0.015[0.904] 32.296[0.000] 0.726[0.394] 1 1 3.841 1.391[0.238] 0.019[0.891] 32.046[0.000] 0.176[0.675] 2 2 5.991 1.885[0.390] 0.048[0.976] 38.251[0.000] 4.239[0.120] 2 2 5.991 1.429[0.490] 10.899[0.004] 40.450[0.000] 9.598[0.008] 3 3 7.815 9.470[0.024] 8.479[0.037] 47.469[0.000] 13.480[0.004] 3 3 7.815 10.337[0.016] 20.355[0.000] 47.864[0.000] 15.872[0.001]
(g)Panama
r DFG 5%CV LEMBIPANA IREVC INF LDEBTX
1 1 3.841 1.318[0.251] 2.971[0.085] 11.776[0.001] 10.982[0.001]
2 2 5.991 11.760[0.003] 13.278[0.001] 20.549[0.000] 15.019[0.001]
3 3 7.815 25.313[0.000] 25.599[0.000] 34.818[0.000] 29.224[0.001]
24 M.L.MaridelCristo,M.Gómez-Puig
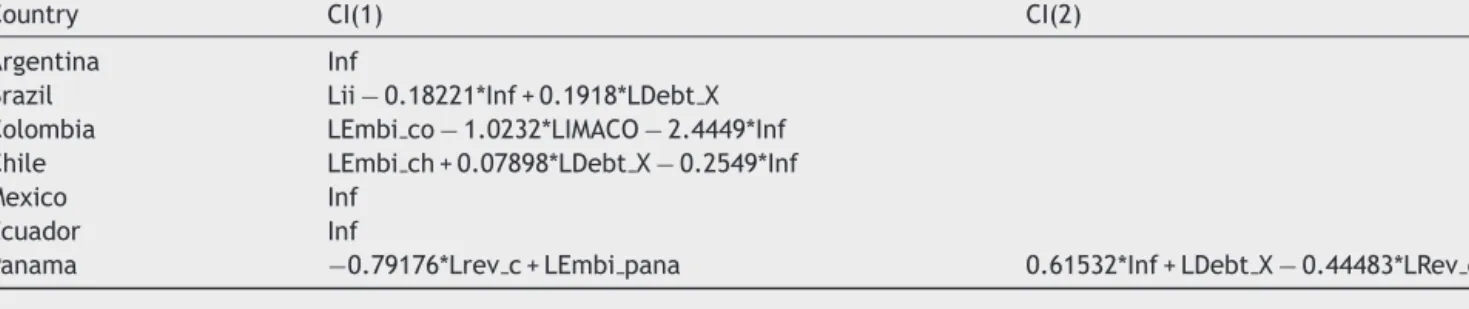
Table8 Longrunrelationships.
Country CI(1) CI(2)
Argentina Inf
Brazil Lii−0.18221*Inf+0.1918*LDebtX
Colombia LEmbico−1.0232*LIMACO−2.4449*Inf
Chile LEmbich+0.07898*LDebtX−0.2549*Inf
Mexico Inf
Ecuador Inf
Panama −0.79176*Lrevc+LEmbipana 0.61532*Inf+LDebtX−0.44483*LRevc
logarithmsexceptinflation;recallfromSection3.1thatthe variablecapturing the growth expectations (eai) changes dependingonthecountryinquestion.Second, wecarried outtheresidualanalysisshownproperlyinTable5
Herewedetailthedummiesincludedforeachcountry: Argentina: The dummy dum0111p(2001:11) takes into accountthe significant fallin the GlobalEMBI due tothe currency crisis sparked by Argentina’s abandoning of the currencyboard, followingpublicdebtdefault.9 Dum0202p and dum0204p variables capture the consequences of devaluation that generated inflation pressures (ECLAC, 2002). The dum0504p was included to normalize debtx residuals since at that date external debt experienced a sharpdecreasewhenArgentinalaunchedadebtexchangein 2005.10Brazil:dum0211pisincludedtonormalizethedebtx residuals. After the 1999 devaluation on the public debt denominatedinUSdollars,Brazil’sdebtincreased substan-tially,reaching50%oftotalpublicdebtattheendof2002.11 Colombia:The objectiveof dum0405pistonormalizethe EMBI residuals; threedummies dum0901p, dum0904pand dum0907p represent the impact of the 2008---2009 global crisisonColombia’seconomicactivity(ECLAC,2009).Chile: dum0405p which normalizes the EMBI residuals and the dum0901pwhichnormalizestheeconomicactivityvariable (ipi)areincorporatedintheanalysis.Mexico:dum0405pis alsoincludedinordertoeliminatetheoutliersoftheEMBI’s residuals. Ecuador: Five permanent dummies need to be included. Whilst dum0906p is related to Ecuador default in 2009,12 dum0811p is introduced to jointly explain the debtx and the EMBI evolution. The rest of dummies are dum0109pand dum0301p which are needed to normalize inflation residuals.13 Panama: The dum0401p normalizes residualsofinflation. Pricesdecreased inthefirstquarter
9InApril1991theConvertibilityPlanwaslaunched,whichpegged thepeso 1-to-1 to theUS dollar.This planwas replacedwitha dualexchangerateregimebasedonanofficialexchangerateof 1.4pesosper dollarfor publicsectorand tradable transactions, whileothertransactionswereconductedatmarketrates.ByJune 2002theexchangeratereached4pesosperdollar(Kaminskyetal., 2009;Mourelle,2010).
10 SeeHornbeck(2013).
11 SeeGiambiagiandRonci(2004).
12 InJune2009theCorreagovernmentdefaultedon$3.2billionof foreignpublicdebt,andthencompletedabuybackof91percent ofthedefaultedbonds(SandovalandWeisbrot,2009).
13 InflationonlyachievedastablelevelinEcuadorafterthefirst quarterof2003. 2000 200120022003200420052006200720082009 2010 2011 2012 2 3 4 5 6
US Treasury bonds rate
Figure3 US Treasury10yearbondrateevolution(Monthly
data2001---2009).
of 2004,butthe trendrevertedafterwardduetotherise inoilpricesandotherimportproducts(ECLAC,2004).
Thedum0810p(alongwithdum0811ponlyfor Ecuador) iscommontoalltheendogenousvariablessinceitisrelated to thestart of the world financial crisis (the US financial institution Lehman Brothers collapsed in September 2008 andaffected theEMBI evolutionof allemergingcountries included in this study). Dummies such as dum0405p and dum0901pmightexplaincontagioneffectsbetweenChile, Colombia andMexico.14 Dum0405pcaptures theincidence of global factors such as a fall in international interest rates, which we can proxy using the US Treasury 10-year yield15 (Fig.3showsthatTreasurybondsyieldswentdown in2004:05).
FollowingEichengreenandMody(1998),weassumethat the relationship between theUS Treasurybond rates and
14 Severalarticleshavepresentedempiricalevidenceofcontagion effects within these countries.For instance, basedon the esti-mation ofa multivariate regression model, Mathuret al. (2002) concludethattherewerespillovercontagioneffectsfromthe Mex-ican market to the Chilean market duringthe 1994 peso crisis. Moreover, Kaminskyand Schmukler (2001)studywhether capital controlsaffectthelinkbetweendomesticandforeignstock mar-ketpricesandinterestrates,andfindthatequitypricesaremore internationallylinkedthaninterestrates.
15 McGuireandSchrijvers(2003)findhighcorrelationsofcommon factorswithS&P500,USTreasuryyieldcurveandoilprices.
and the relationship between EMBI and fundamentals 25
Table9 Econometricresults.
(a)Argentina
Variableequation DLEmbi arg DLeai Dinf DLDebt X
DLEmbi arg 1 0.4745(0.0729)[6.51] 0.055(0.0178)[3.11] 0.0650(0.2797)[0.233] −0.2536(0.084)[−3.02] DLeai 1 0.2267(0.4613)[0.492] −0.0911(0.1127)[−0.809] 1.5977(1.769)[0.903] 0.386(0.5317)[0.727] Dinf 1 −0.00607(0.0142)[−0.426] −0.0024(0.0034)[−0.697] −0.1776(0.054)[−3.35] 0.0097(0.0164)[0.593] DLDebt X 1 0.1185(0.0876)[1.40] 0.0264(0.0207)[1.28] −0.3997(0.3251)[−1.23] −0.1450(0.097)[−1.48] CI(1) 1* 0.00036(0.0111)[0.0329] 0.00144(0.00272)[0.531] −0.3642(0.0427)[−8.53] −0.0088(0.0128)[−0.69] Dum0111p −0.2780(0.0689)[−4.03] −0.0154(0.01683)[−0.917] −0.1857(0.2643)[−0.703] −0.0372(0.079)[−0.469] Dum0202p 0.0959(0.07146)[1.34] 0.0027(0.0174)[0.155] 1.2090(0.2740)[4.41] −0.0299(0.082)[−0.364] Dum0204p −0.0425(0.0707)[−0.602] 0.022(0.01728)[1.30] 3.9607(0.2713)[14.6] 0.0106(0.081)[0.13] Dum0504p −0.1002(0.0694)[−1.44] 0.0100(0.0169)[0.595] −0.5195(0.2663)[−1.95] −0.409(0.080)[−5.12] Dum0810p −0.4681(0.0688)[−6.80] 0.0077(0.01682)[0.459] 0.0541(0.2641)[0.205] 0.073(0.079)[0.92] (b)Brazil
Variableequation DLEmbi br DLii Dinf DLDebt X
DLEmbi br 1 0.2413(0.0968)[2.49] −0.3561(0.1317)[−2.70] −0.3595(0.3619)[−0.993] 0.6114(0.2537)[2.41] DLEmbi br2 −0.0300(0.0993)[−0.303] 0.1743(0.1352)[1.29] −0.4834(0.3714)[−1.30] 0.1667(0.2604)[0.640] DLii 1 0.1173(0.0988)[1.19] −0.0219(0.1345)[−0.163] −1.206(0.3696)[−3.26] −0.7832(0.2591)[−3.02] DLii 2 0.0645(0.0899)[0.718] 0.4152(0.1224)[3.39] −0.3957(0.3363)[−1.18] −0.9867(0.2358)[−4.19] Dinf 1 −0.0212(0.0225)[−0.942] −0.0352(0.0307)[−1.15] −0.2212(0.0843)[−2.62] 0.03738(0.0591)[0.632] Dinf2 0.0392(0.0208)[1.89] −0.0917(0.0282)[−3.25] −0.1435(0.0777)[−1.85] 0.0879(0.0545)[1.61] DLDebtX1 0.0171(0.0451)[0.379] −0.0441(0.0614)[−0.719] −0.0632(0.1688)[−0.375] −0.4393(0.1183)[−3.71] DLDebtX2 0.0655(0.0444)[1.48] 0.0508(0.0604)[0.841] 0.0320(0.1662)[0.193] −0.2745(0.1165)[−2.36] CI(1)1* −0.0612(0.074)[−0.819] −0.4247(0.1018)[−4.17] 1.104(0.2797)[3.95] 0.6363(0.1961)[3.25] Dum0211p 0.1891(0.0453)[4.17] −0.0553(0.0617)[−0.898] 1.1154(0.1696)[6.58] 0.2762(0.1189)[2.32] Dum0810p −0.1312(0.0433)[−3.03] 0.0228(0.0589)[0.387] 0.0279(0.1621)[0.172] 0.0769(0.1137)[0.677] (c)Colombia
Variableequation DLEmbi co DLIMACO Dinf DLDebt X
DLEmbico1 0.1520(0.095)[1.60] 1.1126(0.5134)[2.17] −1.15585(0.7058)[−1.64] −0.4547(0.3327)[−1.37] DLIMACO1 −0.01669(0.008016)[−2.08] −0.5392(0.0433)[−12.5] 0.037718(0.05953)[0.634] −0.02614(0.02806)[−0.932] Dinf1 0.01621(0.01507)[1.08] 0.1390(0.06141)[1.71] −0.184651(0.1119)[−1.65] −0.03471(0.0527)[−0.658] DLDebtX1 0.01487(0.02810)[0.501] −0.3494(0.1518)[−2.30] −0.097537(0.2087)[−0.467] −0.4635(0.09839)[−4.71] CI(1)1* −0.00061(0.00306)[−0.202] 0.1247(0.01655)[7.54] 0.03288(0.02275)[1.45] −0.005683(0.01072)[−0.53] Dum0405p −0.1057(0.02889)[−3.66] 0.02470(0.1561)[0.158] 0.16086(0.2145)[0.75] 0.00572(0.1011)[0.0566] Dum0810p −0.1548(0.03011)[−5.14] −0.3675(0.1626)[−2.26] 0.5895(0.2236)[2.64] 0.028015(0.1054)[0.266] Dum0901p −0.00769(0.030)[−0.255] −0.8094(0.1631)[−4.96] −0.1852(0.2243)[−0.826] 0.1348(0.1057)[1.28] Dum0904p 0.02359(0.02929)[0.805] −1.4419(0.1582)[−9.11] −0.02224(0.2175)[−0.102] 0.1485(0.1025)[1.45] Dum0907p −0.01486(0.03016)[−0.493] −2.3418(0.1629)[−14.4] 0.15916(0.2240)[0.711] 0.00464(0.1056)[0.0440]
26 M.L. Mari del Cristo, M. Gómez-Puig Table9 (Continued) (d)Chile
Variableequation DLEmbich DLipi Dinf DLDebtX
DLEmbich1 0.2574(0.0855)[3.01] 0.2394(0.1278)[1.87]** −0.0509(1.294)[−0.039] −0.8188(0.4075)[−2.01] DLEmbich2 −0.2627(0.08522)[−3.08] −0.077(0.1274)[−0.611] 3.3522(1.29)[2.60] −0.5122(0.4061)[−1.26] DLipi1 −0.04337(0.06672)[−0.650] −0.3102(0.099)[−3.11] −0.8168(1.010)[−0.809] 0.0184(0.3179)[0.0582] DLipi2 0.0069(0.0635)[0.109] −0.02408(0.09504)[−0.253] −2.6025(0.9622)[−2.70] −0.153(0.3030)[−0.508] Dinf1 −0.0024(0.0068)[−0.362] −0.0049(0.010)[−0.481] −0.2602(0.1042)[−2.50] −0.054(0.03281)[−1.65] Dinf2 −0.001122(0.0067)[−0.166] 0.006(0.01011)[0.665] −0.3613(0.1023)[−3.53] −0.0704(0.03222)[−2.19] DLDebtX1 −0.0069(0.02465)[−0.280] −0.0200(0.0368)[−0.545] −0.1078(0.3731)[−0.289] −0.6481(0.1175)[−5.52] DLDebtX2 −0.0063(0.0244)[−0.261] 0.03496(0.0364)[0.959] −0.1842(0.3692)[−0.499] −0.3492(0.1163)[−3.00] CI(1) 1* −0.007875(0.0080)[−0.976] 0.0018(0.0120)[0.155] 0.0939(0.1222)[0.769] −0.0318(0.0384)[−0.829] Dum0405p −0.0995(0.02314)[−4.30] −0.0123(0.0345)[−0.357] 0.0668(0.3502)[0.191] −0.0393(0.110)[−0.356] Dum0810p −0.1611(0.02433)[−6.62] −0.01164(0.0363)[−0.320] 0.0174(0.3682)[0.0473] 0.1631(0.1159)[1.41] Dum0901p −0.0058(0.02565)[−0.227] −0.2303(0.0383)[−6.01] −0.5219(0.3881)[−1.34] 0.1623(0.1222)[1.33] (e)Mexico
Variableequation DLEmbimx Diai Dinf DLDebtX
DLEmbimx1 0.1148(0.0752)[1.53] 0.9876(11.12)[0.0888] −3.0817(1.039)[−2.97] −0.5085(0.3859)[−1.32] DLEmbimx2 −0.4156(0.0714)[−5.82] 10.1342(10.56)[0.960] 0.8405(0.9866)[0.852] −0.4222(0.3665)[−1.15] DLEmbimx3 0.0448(0.0774)[0.580] 29.4665(11.45)[2.57] −0.8210(1.069)[−0.768] −1.5534(0.3973)[−3.91] DLiai1 −0.0004(0.0006)[−0.679] −0.8000(0.1026)[−7.80] 0.0213(0.0095)[2.22] 0.0046(0.0035)[1.30] DLiai2 0.0004(0.0008)[0.602] −0.5716(0.1198)[−4.77] 0.0207(0.0111)[1.86] 0.0027(0.0041)[0.663] DLiai3 0.0001(0.0006)[0.242] −0.3033(0.1031)[2.94] 0.0079(0.0096)[0.82] −0.0017(0.0035)[−0.486] Dinf1 −0.0070(0.0098)[−0.716] 1.0485(1.452)[0.722] 0.3456(0.1356)[2.55][1.34] −0.1244(0.0503)[−2.47] Dinf2 0.0132(0.0088)[1.49] −0.9278(1.315)[−0.706] 0.2636(0.1228)[2.15] −0.0649(0.0456)[−1.42] Dinf3 0.0017(0.0070)[0.252] 0.4255(1.045)[0.407] 0.2831(0.0975)[2.90] 0.0252(0.0362)[0.696] DLDebtX1 −0.0080(0.0203)[−0.393] −4.9697(3.009)[−1.65] 0.2667(0.2811)[0.949] −0.2910(0.1044)[−2.79] DLDebtX2 0.0114(0.0214)[0.533] −6.9052(3.165)[−2.18] 1.3002(0.2957)[4.40] 0.0324(0.1098)[0.296] DLDebtX3 0.0293(0.0214)[1.37] −11.0014(3.165)[−3.48] 0.0677(0.2957)[0.229] 0.1342(0.1099)[1.22] CI(1)1* 0.0003(0.0112)[0.0270] 1.4923(1.661)[0.898] −0.9421(0.1552)[−6.07] 0.1206(0.0576)[2.09] Dum0810p −0.1394(0.0161)[−8.66] −0.5771(2.379)[−0.243] 0.0734(0.2223)[0.331] −0.0255(0.0825)[−0.309] Dum0405p −0.0605(0.0164)[−3.68] −2.3491(2.431)[−0.966] −0.1993(0.2271)[−0.878] −0.0531(0.0843)[−0.630]
and the relationship between EMBI and fundamentals 27 Table9 (Continued) (f)Ecuador
Variableequation DLEmbi ec DLeai Dinf DLDebt X
DLEmbi ec 1 0.2528(0.072)[3.50] −0.086(0.1061)[−0.819] −0.0027(0.0039)[−0.700] −0.2698(0.1149)[−2.35] DLeai 1 −0.031(0.0604)[−0.527] −0.6107(0.088)[−6.88] −0.0080(0.0033)[−2.42] 0.0937(0.096)[0.0976] Dinf 1 1.0619(1.017)[1.04] −0.1161(1.493)[−0.077] −0.1312(0.055)[−2.35] −1.504(1.616)[−0.931] DLDebt X 1 0.125(0.0613)[2.04] −0.0820(0.089)[−0.911] 0.0009(0.0033)[0.273] −0.2481(0.097)[−2.55] CI(1) 1* −0.6925(1.073)[−0.645] 0.0627(1.575)[0.0399] −0.4235(0.059)[−7.17] −0.7155(1.705)[−0.42] Dum0109p 0.0125(0.0569)[0.221] 0.0596(0.083)[0.714] 0.013(0.0031)[4.22] −0.089(0.09)[−0.987] Dum0301p 0.083(0.056)[1.46] 0.0077(0.083)[0.0931] 0.017(0.0031)[5.43] 0.0109(0.09)[0.121] Dum0810p −0.4618(0.058)[−7.93] −0.1432(0.0854)[−1.68] −0.0047(0.0032)[−1.49] 0.200(0.092)[2.16] Dum0811p −0.4984(0.065)[−7.62] −0.0083(0.096)[−0.08] −0.0071(0.0035)[−1.97] 0.0721(0.1039)[0.69] Dum0906p 0.1389(0.056)[2.46] −0.0377(0.082)[−0.455] −0.0007(0.0031)[−0.257] −0.410(0.089)[−4.92] (g)Panama
Variableequation DLEmbipa DLrevc Dinf DLDebtX
DLEmbipa1 0.2995(0.074)[4.00] 0.04671(0.1630)[0.287] 3.8661(1.595)[2.42] −0.4881(0.6171)[−0.791] DLrevc1 −0.0387(0.0456)[−0.849] −0.1722(0.0992)[−1.74] 0.7122(0.9714)[0.733] 0.1170(0.3757)[0.311] Dinf1 −0.0058(0.0043)[−1.33] −0.0228(0.0095)[−2.40] −0.2284(0.093)[−2.45] 0.0769(0.036)[2.14] DLDebtX1 −0.00147(0.01302)[−0.113] 0.0337(0.02832)[1.19] 0.6640(0.2772)[2.40] −0.0085(0.1072)[−0.919] CI(1)1* −0.0988(0.028)[−3.51] 0.1816(0.0612)[2.97] −0.0633(0.5992)[−0.106] −0.1927(0.2318)[−0.832] CI(2)1* 0.0067(0.0092)[0.737] 0.00694(0.0200)[0.346] −0.9952(0.1964)[−5.07] −0.2118(0.0759)[−2.79] Dum0401p 0.02503(0.02011)[1.25] −0.00535(0.0437)[−0.122] −1.9271(0.4283)[−4.50] 0.3987(0.1656)[2.41] Dum0810p −0.1819(0.0202)[−8.99] 0.0221(0.044)[0.0502] −0.4506(0.4310)[−1.05] 0.1666(0.1667)[1.00]
Notes:Std-errorsareinparenthesisandt-valuesinbrackets.*Argentina:CI(1)=Inf.
Notes:Std-errorsareinparenthesisandt-valuesinbrackets.*Brazil:CI(1)=Lii-0.18221*Inf+0.1918*LDebtX.
Notes:Std-errorsareinparenthesesandt-valuesinbrackets.*Colombia:CI(1)=LEMBI co---1.0232*LIMACO---2.4449*Inf.
Notes:Std-errors areinparenthesesandt-valuesinbrackets.*Chile:C(1)=LEMBIch+0.07898*LDebtX---0.2549*Inf.**Whennon-significantdummieswereexcludedthiscoefficient becomessignificant.
Notes:Std-errorsareinparenthesesandt-valuesinbrackets.*Mexico:C(1)=Inf.
Notes:Std-errorsareinparenthesesandt-valuesinbrackets.*Ecuador:CI(1)=Inf1.
28 M.L.MaridelCristo,M.Gómez-Puig
Table10 Comparativeanalysistakingonlythesignificantcoefficientsintoaccount.
Variable Argentina Brazil Colombia Chile Mexico Ecuador Panama
Dependentvariable:DLEMBIspecificcountry
DLEMBI X X X X X X DLEAI X DINF DLDEBTX X DUM0810 X X X X X X X DUM0405 X X X DUM0211 X
CI() X X(CI1)(CI(1))
Dependentvariable:DLEAI*
DLEMBI X X X X(**) X DLEAI X X X X X DINF X X DDEBT X X X DUM0810 X DUM0901 X X CI() X X X(CI1)
Dependentvariable:DINF
DLEMBI X X X
DLEAI X X X X
DINF X X X X X X
DLDEBTX X X
DUM0810 X
CI() X X X X X(CI2)(CI(2))
Dependentvariable:DLDEBTX
DLEMBI X X X X X DLEAI X DINF X X X DLDEBTX X X X X X DUM0211 X DUM0810 X
CI() X X X(CI2)(CI(2))
Note:Theresultsshownaretheonesobtainedwhennon-significantdummieswereeliminated.CI():Specifiesonlythevariablesincluded ineachlongrunrelationship,whicharedescribedinTable8.*Thisvariablechangesdependingonthecountry(seeTable4).**When non-significantdummieswereexcludedthiscoefficientbecomessignificant.
emergingbondpricesisexplainedintermsofdemand.16On thedemand side,when Treasurybonds rates go up(their pricesgodown),therewillbeatendencyamonginvestors tosubstituteemergingbondsbyUSTreasurybonds,andso theEMBIpricefalls. Finally, dummydum0901prepresents thevulnerabilityofChileandColombiawithrespecttothe other countries included in the sample during the global economiccrisisof2008---2009.
Third,wedeterminedtherankofcointegration;Table6
showstheresultsofJohansen’s(1996)test,whichconcludes thatallthecountriesreflectthepresenceofjustone cointe-gratedvector;sotherankoftheirlongrunmatrixisequalto 1(withtheexceptionofPanama,whichmatrix’srankis2).
16 On the supply side, when Treasury bond rates go up, the increaseddebtservicingcostdecreasesthesupplyofUSexternal debt.Thisinturnincreasesthepriceofemergingbondsaveraged bytheEMBI.
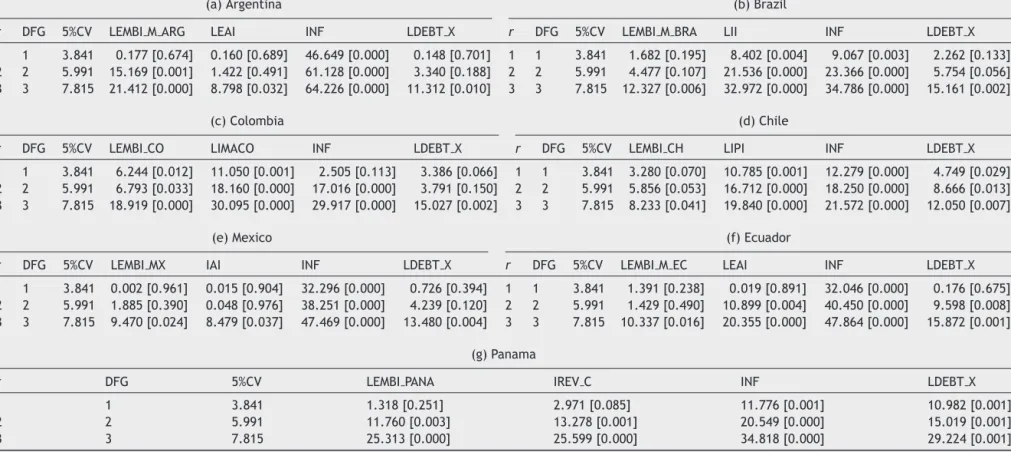
Fourth,wetestandimposeover-identifyingrestrictions onthelongrunstructure(betavectors)inordertohaveonly significantcoefficients.Table7showsthetestsofexclusion for the seven countries, and Table 8 the final cointegra-tion relationships for each of the countries. These long run relationshipswillbe addedasanother predetermined variableintothesimultaneousequationsystemand,along withdummiesandlaggeddifferencedvariables,wewilltest whethertheircoefficientsaresignificantornot.17
Finally as a fifth step, we test the CVAR model as a simultaneous equationsystem. Itsresults aresummarized in Table9a---g.Wepresent thesignificance ofthet-values for the different coefficients in order to highlight the
17 Thefirstfourstepswereperformed usingthesoftwareCATS. Recursive estimation to check parameters stability is available underrequest.
differencesbetweenthecountries18---specifically,between dollarizedandnon-dollarizedcountries.
4.2. Interpretationoftheresults
Asmentioned,theresultsoftheparameterestimationsthat describetheshortruneffectsovervariablesarepresented inTable 9a---g.Specifically, Table9a---e correspondto non-dollarized countries and Table 9f and g tothe dollarized ones(Ecuador andPanama). Inthesetables,thepresence oft-valuesmakesiteasytodistinguishbetweensignificant andnon-significant coefficientsacrossthe sevenemerging countriesinthesample.
Table10presentsthecomparativeanalysisoftheseven emergingcountries.
LookingacrossthecolumnsinTable9a---g,thefollowing conclusions can be drawn: (1)The Emerging BondMarket Index(EMBI)isgenerallyaffectedbyglobalfactors(proxied bydum0810pwhichcapturesthebeginningofthefinancial crisis)and theirownshocks,sinceallthecountriesin the sample,exceptColombia,haveasignificantlaggedDLEMBI coefficientintheirEMBIequations.Debtxdoesnotseemto berelevantforexplainingtheEMBIbehaviour,unlessa coun-tryhasdefaultedonitsdebtobligations(asEcuadordid);(2) EconomicactivityisaffectedbytheEMBIinallcountriesbut dollarizedones;whichrepresentsthefirstimportantfinding of this study, suggesting that in non-dollarized countries, debt-servicingcostsmayhavean importantimpactonthe evolutionof theeconomy;(3)Inmostcases,inflation fol-lows a long run relationship. In our opinion, this is the second important finding of this research, sinceit means thatacountrydoesnotneedtobedollarizedtoreach sta-bleinflationlevels.Inflationtargetingmightbebehindthe non-dollarizedcountries’results19;(4)Ingeneral,investors lookattheevolutionoftheEMBItomaketheirnext deci-sionsregardingsovereignbonddebtinvestment.Colombia and Panama arethe exceptions; (5) In general, the EMBI doesnotfollowalongrunrelationship(withtheexception of Mexico and Panama). (6) Finally, it seems that conta-gioneffectsarepresentinonlythreecountries:Colombia, Chile, and Mexico. These inter-relationships are captured bydum0405panddum0901pvariables.The formeraffects theEMBIinthethreecountries,whilstthelatteraffectsthe economicactivityinjustthefirsttwocountries.
5.
Conclusions
Thetwomainfindingsofthispaperare:(i)economicactivity isaffectedbytheEMBIinallthecountriesexceptthe dol-larizedones;and(ii)inflationfollowsalongrunrelationship formostofthesample(theexceptionsbeingColombiaand
18 Thiseconometricwork wascarriedoutwiththesoftware Ox Metrics.
19 Corbo and Schmidt-Hebbel (2001) analyze theexperience of LatinAmericacountrieswithinflationtargetingregimesandclassify Braziland Chileas full-fledgedinflationtargeting, whilst Colom-biaandMexicoareclassifiedaspartialinflationtargetingregimes. Theseauthorsemphasizethesubstantialprogressofthesecountries toachievelowonedigitinflationlevelswithoutoutputsacrifices.
Chile),showingthatacountrydoesnotneedtobedollarized toachieveastableinflationlevel.Ourresultssuggestthat inLatinAmericacountriesthepricingofrisk(EMBI)depends mostlyonglobalfactors.Nevertheless,itsevolutionaffects foreignlenders’ prospective debt investments, aswell as domesticeconomicactivity,exceptindollarizedcountries. These results may suggest the following conclusions. First, dollarization may ensure that currency mismatches willnotoccur during domestic economic crises;thus, the EMBIismorestableandthesecountries’accesstodebt mar-ketsiseasierduetotheirlowervulnerabilitytoEMBIshocks. Second,dollarizedcountriesarenotasdependenton inter-nationalreserves (theyuse theUS dollar both todevelop their economies and to pay their debts), as their non-dollarizedcounterparts which need international reserves topay theirdebts but use nationalcurrencies todevelop their economies. This comparative analysis between two dollarized and five non-dollarized countries suggests that dollarization may isolate the evolution of the broadest emergingmarketdebtbenchmark,theEMBI.Theseresults are particularly interesting since there are some non-dollarizedLatinAmericancountrieswhicharealreadydoing (relatively) well ontheir own. We think that theyshould encourage fiscal discipline in order to avoid a debt crisis situation since,in a default context, due tothe interre-lationship between their economic activity and the EMBI evolution;theywouldfacemuchmoretroublethan dollar-izedeconomies.
Besides,ourresultsalsosuggestthatinthelongrun, non-dollarizedcountrieswithinflationtargetingpoliciesachieve similarlevels of inflation to those obtained by their dol-larized counterparts. This result is consistent with those presented by other authors (Bernanke and Mishkin, 1997; Bernankeetal.,1999).Thenoveltyistoreachthis conclu-sion by means of the cointegrated VAR approach which identifieslong-runrelationships,includingastationary infla-tionvariableinnon-dollarizedcountries.
Acknowledgments
Financial support from Spanish Ministry of Economy and CompetitivenessthroughgrantECO2016-76203andthrough PlanEstataldeInvestigaciónCientíficayTécnicayde Inno-vaciónis gratefullyacknowledged.The authorswouldlike tothankKatarinaJuselius for their useful andinteresting commentsandsuggestions.
References
Aizenman, J., Jinjarak, Y., Park, D., 2013. Fundamentals and sovereignriskofemergingmarkets,NBERWorkingPaper18963. Baldacci,E.,Gupta,S.,Mati,A.,2008. Isit (Still)mostlyfiscal? Determinants of sovereign spreads in emerging markets, IMF WorkingPaper1---23.
Bernanke,B.S.,Mishkin,F.S.,1997.Inflationtargeting:anew frame-workformonetarypolicy?JournalofEconomicPerspectives11, 97---116.
Bernanke,B.S.,Laubach,T.,Mishkin,F.S.,Posen,A.S.,1999. Infla-tionTargeting:LessonsfromInternationalExperience.Princeton UniversityPress,USA.
30 M.L.MaridelCristo,M.Gómez-Puig Caceres,C.,Vicenzo,G.,SegovianoBasurto,M.,2010. Sovereign
spreads:globalrisk aversion,contagionor fundamentals,IMF WorkingpaperWP/10/120.
Corbo,V.,Schmidt-Hebbel,K.,2001.InflationTargetinginLatino America.CentralBankofChile,WorkingPapers,N◦105. Délano,V.,Selaive,J.,2005.Spreadsoberanos,unaaproximación
factorial.CentralBankofChileWorkingPapersN◦309. Diaz Weigel, D., Gemmill, G., 2006. What drives credit risk in
emergingmarkets.Theroleofcountryfundamentalsand mar-ketco-movements.JournalofInternationalMoneyandFinance 25,476---502.
Domowitz,I.,Glen,J.,Madhavan,A.,1998.Countryandcurrency riskpremiainanemergingmarket.TheJournalofFinancialand QuantitativeAnalysis33,189---216.
Eaton,J.,Gersowitz,M.,1981. Debtwithpotentialrepudiation: theoreticalandempiricalanalysis.ReviewofEconomicStudies XLVIII,289---309.
ECLAC,2002. Estudio Económico deAméricaLatina y elCaribe: Argentina,2001---2002.
ECLAC,2004. Estudio Económico deAméricaLatina y elCaribe: Panama,2003---2004.
ECLAC,2009. Estudio Económico deAméricaLatina y elCaribe: Colombia,2008---2009.
Edwards,S.,1986.ThepricingofBondsandBankloansin Interna-tionalmarkets. Anempiricalanalysisofdevelopingcountries’ foreignborrowing.EuropeanEconomicReview30,565---589. Eichengreen,B.,Mody,A.,1998. Whatexplainschangingspreads
onemergingmarketdebt:fundamentalsormarketsentiment?, NBERWorkingPaper6408.
Feder, G., Just, R., 1977. A study of debt servicing capacity applyinglogit-analysis. Journalof DevelopmentEconomics 4, 25---38.
Fracasso,A.,2007.Theroleofforeignanddomesticfactorsinthe evolutionoftheBrazilianEMBIspreadanddebtdynamics,HEI Workingpaper22/2007.
Frank,C.,Cline,W.,1971.Measurementofdebtservicingcapacity: anapplicationofdiscriminantanalysis.JournalofInternational Economics1,327---344.
Giambiagi,F.,Ronci,M.,2004.Fiscalpolicyanddebtsustainability: Cardoso’sBrazil,1995---2002,IMFWorkingpaperWP/04/156. Gónzalez-Rozada, M., Levy Yeyati, E., 2008. Global factors
and emerging market spreads. The Economic Journal 118, 1917---1936.
Hornbeck,J.F.,2013.Argentina’sDefaultedSovereignDebt: Deal-ingwiththeHoldouts.CRSReportforCongress,Congressional ResearchService,pp.7---5700.
Hoti,S.,McAller,M.,2004.Anempiricalassessmentofcountryrisk ratingsandassociatedmodels.JournalofEconomicSurveys18, 539---588.
IMF,2010.PanamaSelectedIssues,IMFCountryReportN◦10/315. Johansen,S.,1996.Likelihood-BasedInferenceinCointegrated
Vec-torAutoregressiveModels.AdvancedTextsinEconometrics,2nd ed.OxfordUniversityPress,Oxford.
Juselius,K.,2006.TheCointegratedVARModel:Methodologyand Applications,1sted.OxfordUniversityPress,USA.
Kamin,S.,VonKleist,K.,1999.Theevolutionanddeterminantsof emergingmarketscreditspreadsinthe1990s,BISWorkingPaper 68.
Kaminsky,G.,Schmukler,S.,2001.Shortandlongrunintegration: do capitalcontrolsmatter,Policy ResearchWorkingPaper N◦ 2660.
Kaminsky,G.,Mati,A.,Choueiri,N.,2009.Thirtyyearsofcurrency crisisinArgentina:externalshocksordomesticfragility,NBER WorkingPaperSeriesN◦15478.
Krayenbuehl,T.E.,1985.CountryRisk:AssessmentandMonitoring. LexingtonBooks,Toronto.
Krugman,P.,2013.Docurrencyregimematter?TheNewYorkTimes, Available at http://krugman.blogs.nytimes.com/2013/10/19/ do-currency-regimes-matter/?r=1
Lindao Jurado, K.E., Erazo Blum, J.C., Undergraduate The-sis 2009. Riesgo país Ecuador: Principales determinantes y su incidencia,Availableat: http://www.dspace.espol.edu.ec/ bitstream/123456789/3886/1/6413.pdf
López Herrera, F., VenegasMartínez, F.,Gurrola Ríos, C.,2013. EMBI+Mexicoysurelacióndinámicaconotrosfactoresderiesgo sistemático:1997---2011.EstudiosEconómicos28,193---216. Maltritz,D.,Molchanov,A.,2013.Analyzingdeterminantsofbonds
yield withBayesianModel Averaging.Journal ofBankingand Finance37,5275---5284.
Mathur,I.,Gleason,K.C.,Dibooglu,S.,Singh,M.,2002.Contagion effectsfromthe1994MexicanPesoCrisis:evidencefromChilean stocks.TheFinancialReview37,17---34.
McGuire,P.,Schrijvers,M.,2003.Commonfactorsinemerging mar-ketspreads.BISQuarterlyReview(December).
Morgan,J.P., 1999. IntroducingtheJP MorganEmerging Markets BondIndexGlobal(EMBIGlobal).MethodologyBrief(August). Mourelle,J., 2010. Financial Shocksand Macroeconomic Policies
DuringtheArgentineCrisisof2001---2002.InstitutdeRecherches EconomiquesetSocialesdel’UniversitéCatholiquedeLouvain, Discussionpaper2010---24.
Nogués,J.,Grandes,M.,2001.Countryrisk:economicpolicy, con-tagionseffectorpoliticalnoise?JournalofAppliedEconomics IV(May),125---162.
OECD, 2012. Transition ofthe OECD CLIsystemto a GDP-based businesscycletarjet.OECDCompositeLeadingIndicators. Rose,A.,2013.Surprisingsimilarities:recentmonetaryregimesof
smalleconomies.NationalBureauofEconomicResearchWorking PaperN◦19632.
Rowland,P.,Torres,J.,2004.DeterminantsofspreadsandCredit worthinessforemergingmarketdebt:apaneldatastudy.Bank oftheRepublicofColombia,BorradoresdeEconomíaN◦295. Rubinstein,G.,1999.Dolarización.ArgentinaenlaAldeaGlobal.
GrupoEditorLatinoamericano.
Sandoval, L., Weisbrot, M., 2009. Update on the Ecuador-ian Economy. Center for Economic and policy research http://www.cepr.net/index.php/publications/reports/ Schmukler,S.L.,2002.Pricingcurrencyriskundercurrencyboards.
JournalofDevelopmentEconomics69,367---391.
Schuknecht,L.,VonHagen,J.,Wolswijk,G.,2009.Governmentrisk premiuminthebondmarket:EMUandCanada.EuropeanJournal ofPoliticalEconomy25,371---384.
Schuknecht,L.,VonHagen,J.,Wolswijk,G.,2010.Governmentrisk premiumintheEUrevisited---theimpactofthefinancialcrisis, ECBWorkingPaperSeriesN◦1152.
Vargas,H.,González,A.,Lozano,I.,2012.Macroeconomiceffects ofstructuralfiscalpolicychangesinColombia,BISPaperN◦67.