Online issN 2345-0037. OrgANiZAtiONs AND MArkets iN eMergiNg eCONOMies, 2017, VOl. 8, No. 2(16)
FaCtorS aFFECtiNG Co
2EMiSSioN
iN ViEtNaM: a paNEl data aNalySiS
le trung Thanh*
University of Economics and Business, Vietnam National University
Nguyen duc Khuong
University of Economics and Business, Vietnam National University
Abstract. The purpose of this study is to investigate the major factors in the process of economic growth that influence the carbon dioxide (CO2) emission in Vietnam. An Autoregressive Distributed Lag (ARDL) model was used to evaluate the impact based on Environmental Kuznets curve (EKC) and Pollution haven hypothesis (PHH) in 1990–2011. The results indicate that the economic growth, en-ergy consumption, financial development and trade openness positively influence the CO2 emissions, whereas foreign direct investment has a negative impact in the short term. Coefficient of joining ASEAN is not statistically significant. The findings of this study also support the validity of EKC and PHH in the Vietnamese economy. Therefore, it is important to use green energy, examine requirements for foreign investment and adopt trade-related measures and policies to increase environmental protection.
Key words: Environmental Kuznets Curve hypothesis, pollution haven hypothesis, economic growth, CO2 emission
1. introduction
Vietnam has been considered as one of the countries that enjoy the fastest economic growth rate of around 6 percent between 2010 and 2015 (statistical yearbook of Viet-nam, 2016). however, like other countries in the world, this growth is usually accom-panied by the significant increase in energy consumption and environmental problems, for example, CO2 emissions (balibey, 2015; linh & lin, 2014). According to Vietnam development report (2011), the level of emissions per capita in Vietnam remained at about two metric tons of CO2, ranking 111th in the world and, it is expected to rise
dramatically in the coming time (Jan, 2011). Vietnam is regarded as a country with air pollution reaching alarming levels. The population growth, urbanization and industri-alization have momentous impacts on the natural environment, especially in ho Chi Minh City and hanoi.
* Corresponding author: university of economics and business, Vietnam National university. room 705, building e4, No. 144, Xuan Thuy street, Cau giay District, hanoi, Vietnam, email: [email protected]
The fact that Vietnam became a member of The World trade Organization in 2006 means that it has to fulfill a range of commitments on opening markets, which consider-ably affects its economy and environment. in this context, it is important to clarify fac-tors affecting the environment. The primary aim of this study is to examine the effects of the economic growth,energy consumption, foreign direct investment, trade openness, financial development, and participation in AseAN on CO2 emissions in Vietnam. The ArDl model is adopted in this study.
This study is organized as follows: section 2 reviews the relation between CO2 emis-sions and other factors. section 3 presents the data collection and methodology. The empirical results are shown in section 4. section 5 concludes the study.
2. literature reviews
The environmental kuznets Curve (ekC) hypothesis is one of the most popular theories about the relationship between economy and environment. in this theory, the inverted u-shape graph (kuznets, 1955) describes the non-linear relationship be-tween income and pollution. initially, it represents a positive relationship, in which, when income goes up, the environmental pollution becomes more serious. up to a certain level of income, environmental standards are enhanced. Then, the develop-ment of science and technology results in more effective pollution control. The rela-tionship is negative during this time. it means that we can reduce the degradation by improving income. There are some researchers supporting the ekC hypothesis such as Ang (2007) and Jalil and Mahmud (2009). however, studies by lacheheb, rahim and sirag (2015) indicated that ekC did not exist in Algeria; it was also not supported in the case of tunisia (Farhani & Ozturk (2015). holtz- eakin and selden (1995) only identified a linear relationship, either positive or negative. in addition, grossman and krueger (1995) provided an N shape to explain that, at very high income levels, the scope of economic activity is too broadened, so the negative impacts on the environ-ment cannot be rebalanced.
Many studies examined other additional explanatory variables or adopted different techniques to get more accurate results. For example, lau, Choong and eng (2014) discovered that the relationship between gDP and CO2 emissions was only significant when adding two variables – FDi and trade openness. Ang (2007), Chen and huang (2013) found out the effect of economic growth on the environment through energy consumption. The impacts of these variables on the environment follow two direc-tions. initially, the growth on demand for energy and natural resources increases emis-sions (positive relationship). After that, the improvement in advanced technology will reduce environmental pollution (negative relationship). in this study, we analyse six variables including: energy consumption (eC), financial development (FD), foreign direct investment (FDi), trade openness (tRADe) and participation in economic or-ganizations.
Firstly, most of the studies agree that fossil fuels will have a positive impact on emis-sions (Apergis & Payne, 2009; Mercan & karakaya, 2015) through the combustion process. According to Odhiambo (2009), energy consumption promotes economic expansion and financial development in developed countries where financial indicators make the significant contribution to total gDP (Al-Mulali & sab, 2012). however, it also generates a large amount of CO2 emissions, one of the main causes of global warm-ing. While people enjoy high income, pollution from manufacture restrains life quality and productivity in the long term and negatively affects the economic development (Omri et al., 2015). hence, Ali, yusop and hook (2015) support the issue of energy policies, green energy for example, to curb carbon emissions as well as maintain the economic growth.
secondly, the Phh explains that because of high costs for waste management in developed countries, companies tend to move production facilities to developing countries through international trade and FDi, broadening pollution in these coun-tries. balibey (2015) indicated the positive relationship between FDi and CO2 emis-sion. Al-muladi (2012) emphasized that FDi was the major cause of the expansion of CO2 emissions in Middle eastern countries. however, FDi also promotes technology transfer that will help to control pollution in the country receiving investment through environmental standards and output products. in fact, FDi contributes to the econom-ic growth and energy consumption without raising CO2 emissions in g20 countries
(lee, 2013) and briCsAM (khachoo & sofi, 2014); it even decreases CO2 in turkey (Ozturk & Oz, 2016). kivyiro and Arminen (2014) defined both positive and negative effects on environment in sub-saharan Africa.
Thirdly, trade openness affects directly CO2 emissions by reallocating resources be-tween polluted sectors. Commercial activities enable the economy to expand scale, which leads to promotion of the use of natural resources and spread of pollution (Jalil & Mahmud, 2009; sharma, 2011). lau, Choong and eng (2014) found that trade along with FDi directly influenced the economic growth and emissions. This finding is consistent with the study by bouttabba (2014) on the iranian economy. however, trade liberalization encourages the change in production technology, enhances comparative advantages for developing countries, and creates many financial resources to reduce pollution (Maji & habibullaha, 2015). it facilitates growth towards diversification in order to avoid excessive dependence on resource-based exports. like in the ekC hy-pothesis, Jayanthakumaran, Verma and liu (2012) and Akin (2014) used an inverted-u shape to illinverted-ustrate effects on emissions. trade openness intensifies pollinverted-ution inverted-up to a certain level, after that it restrains environmental degradation.
Fourthly, financial development not only stimulates the economic growth, but also affects environmental qualitites. On the one hand, financial development enables many governments to access new and cheaper sources. it means the government can afford to invest in technical innovation and advanced technology to decrease emissions in areas such as Middle east and North Africa (MeNA) (Omri et al., 2015); indonesia
(shahbaz et al., 2013); Malaysia (islam et al.,2013); 24 economies in the world (tama-zian & rao, 2010) and tunisia (Farhani & Ozturk, 2015); financial development is declared to reduce emissions through technological innovation. in addition, countries could save a large amount of money because they do not need to pay expenditure for environment protection. On the other hand, sadorsky (2010) insisted that financial development will boost energy consumption. it demonstrates the positive relationship between FD and emissions (Zhang, 2011; bouttabba, 2014) or a positive correlation but not statistical significance in the long term (Acaravci & Ozturk, 2010). last but not least, Phimphanthavong (2014) explained that the economic competition in AseAN encouraged laos to improve its economic performance, including strengthening in-vestment, and trade cooperation, which affects environmental degradation indirectly.
Different results can be derived not only selecting explanatory variables but also ap-plying various research models. With different methods such as ordinary least squares- Ols model, VeCM granger causality and Johansen cointegration, the existence of hys-teresis and constraints observed in the sample could affect the results of analysis. For example, in turkey, Ozturk and Oz (2016) pointed out that both in the short and long term, ekC hypothesis was proved with the ArDl model. earlier, halicioglu (2009) only clarified the granger causality relationship; Ozturk and Acaravci (2010) conclud-ed that the ekC hypothesis at causal framework by using a linear logarithmic model is not valid in the turkish case.
in Vietnam, there are many studies on the ekC hypothesis. Manh (2014) claimed a strong relationship between the CO2 emissions and income per capita in the period 1985–2010 and existence of the ekC in Vietnam. Meanwhile, with an insignificant co-efficient linh and lin (2014) concluded that the ekC did not exist in Vietnam. in another research, by using the Johansen cointegration test and granger causality, tang and tan (2015) showed that energy consumption, FDi and gDP were the most impor-tant determinants of CO2. inconsistent findings may arise from the lack of explanatory variables or limitation of econometric models.
3. Materials and method
in this study, the ArDl model is applied because of some advantages: (i) consistent and small sample size, estimated with a unique equation; (ii) possibility to be used irre-spective of whether variables are i (0), i (1) or a mixture of both, finally, (iii) calculating in a short-term with error correction model (eCM) and long-term model without loss of degree of freedom (Pesaran, shin & smith, 2001; Ozturk & Acaravci, 2013). in the proposed model, all variables are converted into logarithm natural. Data are collected from the World bank in the period 1990–2011.
The main objective of this research is to analyze factors affecting CO2 emissions in Vietnam. to answer this question, we study two independent cases as shown in equa-tion (1) and (2). equaequa-tion (1) illustrates the ekC hypothesis, whereas equaequa-tion (2) expresses the pollution haven hypothesis and technology transfer.
1 2 3 4 5 2 3 t 1 1 t 1j t j 1g t 1 t 1k t 1 1 1 1 1 6 7 8 9 1 t 1 t 1 t p 1 t q 1 1 1 1 1 CO CO GDP GDP GDP TRADE EC FDI FD AS + a a a a a i i g h h k i j g h k a a a a m l n n p p t m n p q b c d e f x y z Dum EAN 1 2 3 4 2 3 t 1 1 t 1j t j 1g t 1 t 1 1 1 1 5 6 7 8 9 1k t 1 t 1 t 1 t p 1 t q 1 1 1 1 1 1
CO CO TRADE TRADE TRADE
EC FDI FD AS + a a a a i i g h h i j g h a a a a a k m l n n p p t k m n p q b c d e f GDP x y z Dum EAN
COEKC = f(GDP, GDP2 , EC, FD, FDI, TRADE, Dum
ASEAN ) (1)
COPHH = f(TRADE, TRADE2, EC, FD, FDI, GDP, Dum
ASEAN) (2) ArDl models for two cases are presented in equations (1a) and (1b), as follows:
(1a)
(1b) where: CO: per capita of CO2 emissions (metric tons per capita); gDP: per capita income; eC: per capita of energy consumption (kg oil per capita); FDi: foreign di-rect investments (boP, current us $); tRADe: trade openness, calculated as the ratio of the total value of exports and imports to total real gDP (%); FD: financial development, represented by domestic credit to private sector (islam et al., 2013); DumAseAN: dummy D equals 1 when Vietnam joins AseAN, otherwise it equals 0, and ε is error.w
Coefficients d1g and e1h indicate the corresponding shape of the hypothesis. if d1g
is smaller than 0 and statistically significant, the model suggests the existence of ekC hypothesis with the inverted u shape, while when e1h, is smaller than 0 and statistically significant, it is illustrated by an N shape.
We establish the relationship by using the ArDl model in the following four steps. Firstly, cointegration is calculated by bounds test with F statistics. secondly, the ArDl with optimal lag is estimated based on schwarz-bayes Criterion (sbC) or Akaike in-formation Citerion (AiC). Thirdly, the relationship between economic growth and CO2 emissions in a short term and a long term is analysed. Finally, the stability and compatibility of models are examined by heteroskedasticity test (het), Correlation langrange multiplier test (lM), ramsey reset test (reset), Cumulative sum of recursive residuals (CusuM) and Cumulative sum of squares of recursive residuals (CusuMsq). in fact, eviews 9.5 software can help to choose automatically optimal lag with a fixed DumAseAN variable.
bounds test is based on the hypothesis that variables have i (1) or i (0), therefore occurrence of variable i(2) makes models inappropriate. Augmented Dickey-Fuller test statistic is used to reject i(2) or more. The bounds tests are shown in equations (2a) and (2b) as follows (Jayanthakumaran, Verma & liu, 2012; Akin, 2014):
(2a)
(2b) in both equations (2a) and (2b), coefficients b, c, d, e, f, x , y, z represent a short-term relationship, λ, λ1, λ2, λ3, λ4, λ5, λ6, λ7, λ8 show a long-term relationship. F test demon-strates cointegration with null hypothesis h0 λ= λ1= λ2= λ3= λ4= λ5 =λ6= λ7= λ8= 0. let us assume that upper critical bounds – uCb are the values when the variable is i (1) and lower critical bounds – lCb when the variable is i (0). Cointegration exists if F> uCb; it does not exist if F <lCb; and is inconclusive if lCb <F <uCb. if cointegration exists, we estimate the long-run and short-run models. equations (3a) and (3b) illus-trate the relationship in a short term as follows:
(3a)
(3b)
4. results and discussion
environmental qualities and economic growth have a strong relationship. Polluted environment constrains the economic development because an input component for economic growth is taken from the environment. The World bank indicator database shows that environmental pollution in Vietnam annually damages 5% of gDP. emis-sions per capita in 1960 were 0.21 tons, in 1991 were 0.31 tons, but increased sharply to 1.97 tons in 2011, while gDP per capita only rose from 143 usD in 1991 to 1,542 usD in 2011. some economic experts predict that if gDP doubles without environmental
1 2 3 4 2 3 t 0 2 t 2j t j 2g t 2 t 1 1 1 1 5 6 7 8 2 t 2 t 2 t 2 t p t 1 1 t 1 1 1 1 1 2 3 2 t 1 3 t 1 4 t CO CO GDP GDP GDP TRADE x EC FDI FD CO GDP GDP GDP TRA a a a a i i g h h i j g h a a a a k k m l n n p k m n p b c d e f y z
15EC FDIt 1 6 t 1 FD7 t 1 8DumASEANt 1 2t 1 2 3 4 2 3 t 0 2 t 2j t j 2g t 2 t 1 1 1 1 5 6 7 8 2 t 2 t 2 t 2 t p t 1 1 t 1 1 1 1 1 2 3 2 t 1 3 t CO CO x EC FDI FD CO a a a a i i g h h i j g h a a a a k k m l n n p k m n pb c TRADE d TRADE e TRADE
f GDP y z TRADE TRADE TRADE
1 TRA4 t 1 5EC FDIt 1 6 t 1 FD7 t 1 8DumASEANt 1 2t
1 2 3 4 2 3 t 3 3 t 3j t j 3g t 3 t 1 1 1 1 5 6 7 8 3k t 3 t 3 t 3 t p 1 1 1 1 8 t 1 3 CO CO GDP GDP GDP TRADE EC FDI FD DumASEAN a a a a i i g h h i j g h a a a a k m l n n p k m n p t b c d e f x y z ECT
1 2 3 4 2 3 t 3 3 t 3j t j 3g t 3 t 1 1 1 1 5 6 7 8 3k t 3 t 3 t 3 t p 1 1 1 1 8 t 1 3CO CO TRADE TRADE TRADE
GDP EC FDI FD DumASEAN a a a a i i g h h i j g h a a a a k m l n n p k m n p t b c d e f x y z ECT
protection, the pollution will expand three or four-fold in the next 10 years. in the pe-riod 2000–2009, total primary energy consumption in Vietnam grew on average by 6.54% per year. The size and efficiency of energy consumption are low while the inten-sity of using energy is twice as high as the average of the world. in 1991, energy con-sumption was 269 kg of oil per capita and increased to 667 in 2013.
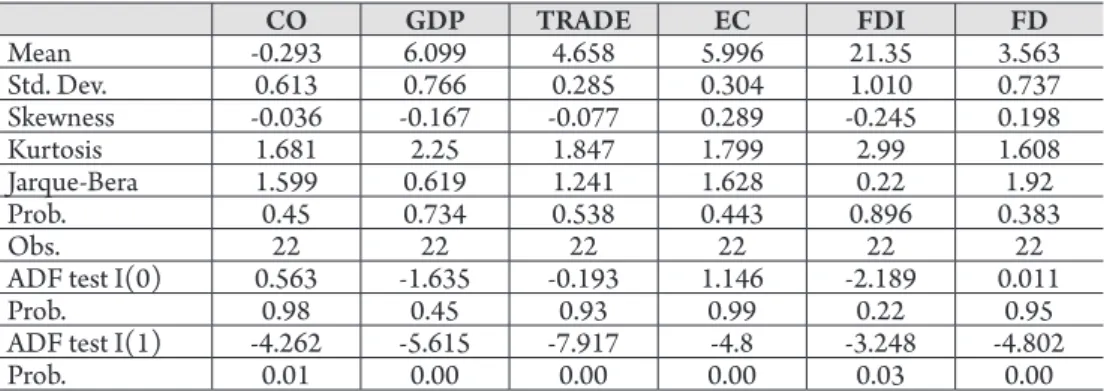
(a) table 1 reports summary statistics of the annual data. The result of ADF test in-dicates that at the 5% level of significance, all variables are feasible to use ArDl at first difference.
tAble 1. results of statistical analysis
Co Gdp tRAdE EC Fdi Fd Mean -0.293 6.099 4.658 5.996 21.35 3.563 std. Dev. 0.613 0.766 0.285 0.304 1.010 0.737 skewness -0.036 -0.167 -0.077 0.289 -0.245 0.198 kurtosis 1.681 2.25 1.847 1.799 2.99 1.608 Jarque-bera 1.599 0.619 1.241 1.628 0.22 1.92 Prob. 0.45 0.734 0.538 0.443 0.896 0.383 Obs. 22 22 22 22 22 22
ADF test i(0) 0.563 -1.635 -0.193 1.146 -2.189 0.011
Prob. 0.98 0.45 0.93 0.99 0.22 0.95
ADF test i(1) -4.262 -5.615 -7.917 -4.8 -3.248 -4.802
Prob. 0.01 0.00 0.00 0.00 0.03 0.00
(b) establishing ArDl for the two cases with all variables and rejecting variables that are insignificant, we have results in table 2. F test is greater than uCb at the significant level 1%, so we could reject the null hypothesis of no cointegration. it is understood that the pure ekC and Phh models have only independent variables (gDP, gDP2) or (tRADe, tRADe2).
tAble 2: Cointegration bound test results
Model F-statistic k Significance i0 bound i1 bound
ekC & eC, tRADe 5.2732 4 1% 3.29 4.37
Phh & eC, FD, FDi 10.9621 5 1% 3.06 4.15
(c) table 3 presents ArDl model with optimal lag. based on AiC and sbC, we selected two optimal ArDl models for two cases: ArDl(1, 1, 1, 2, 2) and ArDl(2, 1, 1, 0, 0, 1).
tAble 3. ardl optimal model results
EKC & EC, tRAdE pHH& EC, Fd, Fdi
ardl(1, 1, 1, 2, 2) ardl(2, 1, 1, 0, 0, 1)
Variable Coef. Prob. Variable Coef. Prob.
CO(-1) -0.7037 0.10** CO(-1) -0.053 0.82
gDP -2.4885 0.10** CO(-2) -0.767 0.01***
gDP2 0.1548 0.19 tRADe(-1) 3.279 0.06** gDP2(-1) -0.3955 0.03*** tRADe2 -0.642 0.01*** eC 2.0484 0.00*** tRADe2(-1) -0.283 0.12* eC(-1) 1.6353 0.03*** FD 0.130 0.18 eC(-2) -0.426 0.27 FDi -0.073 0.03*** tRADe -0.0579 0.80 eC 1.206 0.01*** tRADe(-1) 0.6117 0.02*** eC(-1) 1.049 0.01*** tRADe(-2) -0.1762 0.24 C -29.7277 0.00*** C -39.126 0.00*** *, **, *** significant at 15%, 10%, 5 % level
(d) short run and long run ArDl models are shown in table 4. The main results of our research are as follows:
(i) the ekC hypothesis with the inverted- u shape exists only in the long term in Vietnam. in the short term, the relationship between income and CO2 emissions is illustrated by a u-shape, not complying with the ekC (the coef-ficient of gDP2 is 0.155). An increase of 1% in real gDP per capita leads to
a reduction of 2.488% in CO2 emission in the short term but enlargement of 1.6412% in the long term. Meanwhile, gDP2 broadens emissions by 0.155%
in the short term and reduces it by 0.14% in the long term. Our result contrasts with linh and lin (2014); Al-Mulali, saboori and Ozturk (2015), whereas it complements Manh (2014) for the impact of energy consumption.
(ii) trade openness has a positive impact on CO2 emissions, each increasing percent of the trade openness leads to a 6.63% rise in CO2 emissions in the short term and about 5.46% in the long term. This was attributed to the val-ue of Vietnamese imports being greater than that of exports in the consid-ered period. The ratio export to import for Vietnam was about 0.39 in 1990 and grew to 0.95 in 2011, which was always less than 1. The coefficient of tRADe2 is negative and statistically significant (cf. Akin, 2014) and
sup-ports Phh in Vietnam. The highest value is 214.56%, after that trade open-ness will reduce pollution.
(iii) energy consumption always maintains 2-dimensional relationships in both cases. in the case of the ekC, an increase of 1% in eC leads to 2.048% emissions in the short run and 1.9121% in the long run. This coefficient is higher than other countries in Asia. it is 1.15 for China , 0.97 for india and 0.7 for Malaysia (islam et al., 2013). The positive relationship between eC and CO2 emissions is also consistent with the results from the study by tang and tan (2015) in Vietnam and most of studies in the world such as: hali-cioglu (2009), Apergis and Payne (2009), Mercan and karakaya (2015) and Chen and huang (2013). Our result supports the view of Ang (2007) that the influence of the economic growth is explained by energy consumption and pollution expansion in the long term. The impact of eC decreases when
considering models in the case of Phh. One percent increase in eC causes only a 1.1957% increase in CO2 in the short term and that of 1.235% in the long run, which shows that technology transfer has promoted innovation to help narrow emissions.
(iv) The influence of FDi on the CO2 emissions is not reflected in the case of the Phh instead of the ekC hypothesis. The study results show important similarities with Maji and habibullaha (2015) to suggest that FDi plays a (significant) role in emission reduction. When FDi inflow to Vietnam in-creases by 1%, the degradation will drop by 0.0647% in the short term and by 0.0402% in the long term. This is explained by the contribution of FDi to the economic growth by improving industrial production capacity and exports. small reduction may stem from slow transfer of advanced technolo-gies. On the other hand, most of the FDi allocated to underdeveloped sec-tors is protected. Although FDi creates more job opportunities for those who are not highly skillful, it does not provide the same advantages for the domestic private sector and might prevent the labor mobility in the country, especially labor with high levels of workmanship. The decrease in labor pro-ductivity is illustrated by low growth of income. Therefore the impact of FDi does not comply with the hypothesis.
(v) Financial development in Vietnam has a statistically significant positive re-lationship with pollution in the short term but insignificant in the long term. each added percent of FD increases environmental pollution by 0.1189% (about 0.13% in the long run). Our result is similar to the findings by Al-Mulali and sab (2012), Farhani and Ozturk (2015), bouttabba (2014). it is explained by the fact that the private sector is entitled to less prefer-ential treatment from the government. The private sector, mostly small and medium-sized businesses, has restricted access to commercial capital. in ad-dition, the existence of institutional barriers and unfavorable business envi-ronment restrains domestic private enterprises from the motivation for long-term investment, expanding the business scale, or innovating technology to improve productivity and competitiveness. Continuous usage of outdated technologies causes low productivity and negative impact on environment. (vi) Finally, there is no evidence for the assumption that Vietnam’s
participa-tion in AseAN would affect indirectly the environmental degradaparticipa-tion in the country. The coefficient eCM (-1) is negative and statistically significant, which confirms a stable long-run relationship and efficient establishing.
So, the error correction mechanism for this model is working properly, which means that carbon emission converges to its long run equilibrium by 170.4% speed of adjustment in the case of Equation (1) and 180.06% in the case of Equation (2).
tAble 4. Estimated short and long run coefficients EKC & EC, tRAdE
short run long run
Variable Coef. Prob. Variable Coef. Prob.
D(gDP) -2.488 0.00 gDP 1.6412 0.00 D(gDP2) 0.155 0.01 gDP2 -0.1413 0.00 D(eC) 2.048 0.00 eC 1.9121 0.00 D(eC(-1)) 0.426 0.05 tRADe 0.2216 0.20 D(tRADe) -0.058 0.60 C -17.4493 0.00 D(tRADe(-1)) 0.176 0.06 eCM(-1) -1.704 0.00
eCM = CO - (1.6412*gDP -0.1413*gDP2 + 1.9121*eC + 0.2216*tRADe -17.4493) pHH& EC, Fd, Fdi
short run long run
Variable Coef. Prob. Variable Coef. Prob.
D(CO(-1)) 0.7747 0.00 D(tRADe) 6.6324 0.00 tRADe 5.4556 0.00 D(tRADe2) -0.6420 0.00 tRADe2 -0.5081 0.00 D(eC) 1.1957 0.00 eC 1.2389 0.00 D(FD) 0.1189 0.06 FD 0.0714 0.17 D(FDi) -0.0647 0.02 FDi -0.0402 0.01 eCM(-1) -1.8006 0.00 C -21.4931 0.00
eCM = CO- (5.4556*tRADe -0.5081*tRADe2 -0.0402*FDi +1.2389*eC + 0.0714*FD -21.4931)
Where: D(gDP)= ∆gDPt - gDPt -1; D(CO(-1))= ∆COt-1 - COt-2;
D(eC)= ∆eCt - eCt -1; D(FD)= ∆FDt - FDt -1; D(FDi)= ∆FDit - FDit -1; (e) residual and stability diagnostic results in table 5 accepted the null
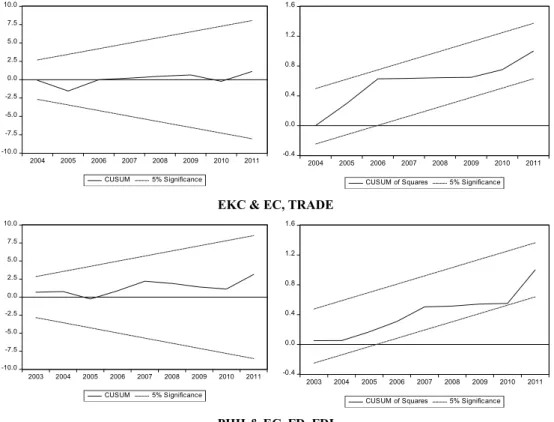
hypoth-esis h0: model has no heteroscedasticity, no correlation level 2 and no omitted variables. since CusuM and CusuMsq lines stay within the critical bounds at the 5 % level (Figure 1), the model estimations are stable.
tAble 5. diagnostic results
Model HEt lM rESEt CUSUM CUSUMSQ
ekC & eC, tRADe
Coef. 9.6386 5.0595 3.7962 stable stable
Prob. 0.56 0.08 0.09 stable stable
Phh & eC, FD, FDi
Coef. 12.6523 4.6310 2.9976 stable stable
Fig. 1. plot of cumulative sum and cumulative sum-squared
5. Conclusions
by using an ArDl model, this research analyses factors affecting CO2 emissions in the period 1990–2011. The results of this study show that while the ekC hypothesis only exists in the long term, the Phh hypothesis occurs in Vietnam in both a short and a long term. The openness of economy has a positive impact on emissions. gDP per capita reduces emissions in the short term but increases the level of pollution in the long term. energy consumption plays an important part in promoting emission. The role of FDi is only significant in the theory of Phh. The Financial development shows positive considerable impact in the short term. This raises the issue of expansion of trade and economic growth, while ensuring control of environmental degradation. Ad-ditionally, these results do not find any evidence of the negative effect on the increase of CO2 emission since Vietnam joined AseAN.
The difference between coefficient gDP2 in the short run and long run in Vietnam
could be explained by the ideas in salim, rafiq & shafiei (2017). Developing econo-mies achieve a certain level of economic growth, their emissions tend to decline. it is when environmental standards are raised after the pursuit of economic goals. Another important result is that the coefficients of Vietnam are similar to those of lao
(Phim--10.0 -7.5 -5.0 -2.5 0.0 2.5 5.0 7.5 10.0 2004 2005 2006 2007 2008 2009 2010 2011 CUSUM 5% Significance -0.4 0.0 0.4 0.8 1.2 1.6 2004 2005 2006 2007 2008 2009 2010 2011
CUSUM of Squares 5% Significance EKC & EC, TRADE
-10.0 -7.5 -5.0 -2.5 0.0 2.5 5.0 7.5 10.0 2003 2004 2005 2006 2007 2008 2009 2010 2011 CUSUM 5% Significance -0.4 0.0 0.4 0.8 1.2 1.6 2003 2004 2005 2006 2007 2008 2009 2010 2011
CUSUM of Squares 5% Significance PHH & EC, FD, FDI
phathvong, 2014), indonesia, the Philippines in the short-term; and Malaysia, singa-pore and Thailand (saboori & sulaiman, 2013) or China (Jalil & Mahmud, 2009) in the long term. This requires a careful consideration of characteristics of each member in cooperation policy. basically, analyzing the impact of economic development on environment by the Phh is more appropriate than the ekC hypothesis in Vietnam. According to our calculation, trade openness at the extreme points is 214.56% of total real gDP (trade openness was 178.77% in 2015). Assuming that remaining conditions do not change, there is a big gap before the expansion of trade openness could restrain emissions. especially, in the upcoming time when Vietnam becomes the member of economic organizations and implements commitments on opening markets, the risks to the environment would continue to spread. besides, financial development and eco-nomic growth have a positive influence on emissions. Thus, the ecoeco-nomic development policies need to strengthen the role of environmental protection.
Our research supports the view that economic growth increases pollution through the use of energy. This requires Vietnam to develop green energy, green industry and improve energy productivity to achieve high gDP growth rates and lower environmen-tal emissions.
According to our study, FDi contributes to reducing the CO2 emissions. however, in Vietnam, there were periods in which FDi caused serious pollution, especially with untreated sewage and industrial wastewater discharged into rivers, which degraded eco-systems and threatened the lives and health of people. For that reason, Vietnam needs to enhance the inspection requirements for foreign investors and accelerate the transfer of advanced environmentally-friendly technologies. green growth has been the leading strategy today.
references
Acaravci, A., & Ozturk, i. (2010). On the relationship between energy consumption, CO2
emissions and economic growth in europe. Energy, 35 (12), 5412–5420.
Akın, C.s. (2014). The impact of Foreign trade, energy Consumption and income on CO2
emissions. International Journal of Energy Economics and Policy, 4 (3), 465–475.
Al-mulali, u. (2012). Factors affecting CO2 emission in the Middle east: A Panel Data Analysis.
Energy, 44 (1), 564–569.
Al-Mulali, u., & sab, C.N.b. (2012). The impact of energy consumption and CO2 emission on
the economic and financial development in 19 selected countries. Renewable and Sustainable Energy
Reviews, 16 (7), 4365–4369.
Al-Mulali, u., saboori, b., & Ozturk, i. (2015). investigating the environmental kuznets curve
hypothesis in Vietnam. Energy Policy, 76, 123–131.
Ali, h.s., yusop, Z.b., & hook, l.s. (2015). Financial Development and energy Consumption
Nexus in Nigeria: An Application of Autoregressive Distributed lag bound testing Approach.
Inter-national Journal of Energy Economics and Policy, 5 (3), 816–821.
Ang, J.b. (2007). CO2 emissions, energy consumption, and output in France. Energy Policy,
Apergis, N., & Payne, J.e. (2009). CO2 emissions, energy usage, and Output in Central
Ameri-ca. Energy Policy, 37, 3282–3286.
balibey, M. (2015). relationships among CO2 emissions, economic growth and Foreign Direct
investment and the environmental kuznets Curve hypothesis in turkey. International Journal of
Energy Economics and Policy, 5 (4), 1042–1049.
bouttabba, M.A. (2014). The impact of Financial Development, income, energy and trade on
Carbon emissions: evidence From the indian economy. Economic Modelling, 40, 33–41.
Chen, J.h., & huang, y.F. (2013). The study of the relationship between Carbon Dioxide
(CO2) emission and economic growth. Journal of International and Global Economic Studies, 6 (2),
45–61.
Farhani, s.. & Ozturk, i. (2015). Causal relationship between CO2 emissions, real gDP, energy
consumption, financial development, trade openness, and urbanization in tunisia. Environmental
Science and Pollution Research, 22 (20), 15663–15676.
general statistics Office of Vietnam. (2016). Statistical yearbook of Vietnam. hanoi: statistical
Publishing house.
grossman, g.M., & krueger, A.b. (1995). economic growth and the environment. Quarterly
Journal of Economics, 112, 353–378.
halicioglu, F. (2009). An econometric study of CO2 emissions, energy Consumption, income
and Foreign trade in turkey. Energy Policy, 37, 1156–1164.
holtz-eakin, D., & selden, t. M. (1995). stoking the fires? CO2 emissions and economic growth.
Journal of Public Economics, 57, 85–101.
islam, F. et al. (2013). Financial development and energy consumption nexus in Malaysia: A
multivariate time series analysis. Economic Modelling, 30, 435–441.
Jalil, A., & Mahmud, s. F. (2009). environment kuznets curve for CO2 emissions: a
cointegra-tion analysis for China. Energy Policy, 37, 5167–5172.
Jan, b. (2011). Vietnam development report 2011: natural resources management. Washington,
DC: World bank. http://documents.worldbank.org/curated/en/509191468320109685/Vietnam-development-report-2011-natural-resources-management.
Jayanthakumaran, k., Verma, r., & liu, y. (2012). CO2 emissions, energy Consumption, trade
and income: A Comparative Analysis of China and india. Energy Policy, 42, 450–460.
khachoo, q., & sofi, i. (2014). The emissions, growth, energy use and FDi Nexus: evidence
from briCsAM. International Journal of IT, Engineering and Applied Sciences Research, 3 (8), 1–9.
kivyiro, P., & Arminen, h. (2014). Carbon Dioxide emissions, energy Consumption,
econom-ic growth, and Foreign Direct investment: Causality Analysis for sub-saharan Afreconom-ica. Energy, 74,
595–606.
kuznets, s. (1955). economic growth and income inequality. American Economic Review, 45,
1–28.
lacheheb, M., rahim, A. s. A., & sirag, A. (2015). economic growth and Carbon Dioxide
emis-sions: investigating the environmental kuznets Curve hypothesis in Algeria. International Journal of
Energy Economics and Policy, 5 (4), 1125–1132.
lau, l., Choong, C., & eng, k. (2014). investigation of the environmental kuznets Curve for
Carbon emissions in Malaysia: Do Foreign Direct investment and trade Matter?. Energy Policy, 68,
490–497.
lee, J.W. (2013). The Contribution of Foreign Direct investment to Clean energy use, Carbon
emissions and economic growth. Energy Policy, 55, 483–489.
linh, D.h., & lin, s.M. (2014). CO2 emissions, energy consumption, economic growth and
Maji, i.k., & habibullaha, M.s. (2015). impact of economic growth, energy Consumption and
Foreign Direct investment on CO2 emissions: evidence from Nigeria. World Applied Sciences
Jour-nal, 33 (4), 640–645.
Manh, P.h. (2014). The green growth in Vietnam in terms of energy consumption and CO2
emission. Journal of Science and Technology Development, 17, 14–25 (in Vietnam).
Mercan, M., & karakaya, e. (2015). energy Consumption, economic growth and Carbon
emission: Dynamic Panel Cointegration Analysis for selected OeCD Countries. Procedia
Econom-ics and Finance, 23, 587–592.
Odhiambo, N.M. (2009). energy consumption and economic growth nexus in tanzania: An
ArDl bounds testing approach. Energy Policy, 37 (2), 617–622.
Omri, A. et al. (2015). Financial Development, environmental quality, trade and economic growth: What Causes What in MeNA Countries. iPAg working papers 2015–622.
Ozturk, i., & Acaravci, A. (2010). CO2 emissions, energy consumption and economic growth in
turkey. Renewable and Sustainable Energy Reviews, 14, 9, 3220–3225.
Ozturk, Z., & Oz, D. (2016). The relationship between energy Consumption, income, Foreign
Direct investment, and CO2 emissions: The Case of turkey. Journal of The Faculty of Economics and
Administrative Sciences, 6 (2), 1–20.
Pesaran, M.h., shin, y., & smith, r.J. (2001). bounds testing approaches to the analysis of level relationships. Journal of Applied Econometrics, 16, 3, 289–326.
Phimphanthavong, h. (2014). The impacts of economic growth on environmental Conditions in laos. International Journal of Business Management & Economic Research, 4 (5), 766–774.
saboori, b., sulaiman, J. (2013). CO2 emissions, energy consumption and economic growth in
Association of southeast Asian Nations (AseAN) countries: a cointegration approach. Energy, 55,
813–822.
salim, r., rafiq, s., & shafiei, s. (2017). urbanization, energy Consumption, and Pollutant emission in Asian Developing economies: An empirical Analysis. ADbi Working Paper 718. to-kyo: Asian Development bank institute.Available: https://www.adb.org/publications/urbaniza-tion-energy-consumption-pollutant-asian-developing-economies.
sharma, s. s. (2011). Determinants of Carbon Dioxide emissions: empirical evidence from 69
Counties. Applied Energy, 88 (1), 376–382.
sadorsky, P. (2010). The impact of financial development on energy consumption in emerging
economies. Energy Policy, 38, 2528–2535.
shahbaz, M. et al. (2013). economic growth, energy consumption, financial development,
in-ternational trade and CO2 emissions in indonesia. Renewable and Sustainable Energy Reviews, 25,
109–121.
tamazian, A. And rao, b.b. (2010). Do economic, financial and institutional developments
mat-ter for environmental degradation? evidence from transitional economies. Energy Economics, 32 (1),
137–145.
tang, C.F., & tan, b.W. (2015). The impact of energy Consumption, income and Foreign Direct
investment on Carbon Dioxide emissions in Vietnam. Energy, 79, 447–454.
Zhang, y.J. (2011). The impact of financial development on carbon emissions: An empirical analysis in China. Energy Policy, 39, 2197–2203.