System-performance modeling
for massively multiplayer
online role-playing games
&
M. Ye L. Cheng
Massively multiplayer role-playing games (MMORPGs) are among the most popular types of online game. A successful title may have tens of thousands or even millions of subscribers and, at any given time, may have thousands of players online. This paper presents a method for modeling MMORPG system performance and applies it in an analysis of two real MMORPGs. The results show that a strong linear relationship exists between performance metrics at the server side and the number of concurrent players online. As a result, utilization of IT resources, including network traffic and server load, can be predicted, given the number of concurrent players. The performance model presented here can be used for automated IT resource allocation at runtime and is thus useful in the context of utility computing and on demand systems.
INTRODUCTION
Online games are the trend of the day. Online game services such as PlayStation** online, Xbox** Live, GameSpy** Arcade, and other independent PC-based services are becoming increasingly popular. In their 2004 prediction, International Data Corpo-ration (IDC) estimated industry revenue to reach $656.3 million in 2004 and grow to over $2 billion by 2008.1Online games enable multiple players to simultaneously interact in a‘‘game world’’to which they connect over a network. Most online games today follow a client/server model; research is ongoing concerning the feasibility of other types of architecture, such as peer-to-peer and grid architec-tures.2,3
PC-based online games can be classified into two subcategories—multiplayer online games (MOGs) and massively multiplayer online games
(MMOGs)—based on the maximum number of simultaneous players in a single game world. Popular MMOGs might have thousands of players online at any given time, usually exclusively on a company-owned server. On the other hand, MOGs usually have less than 50 players online and are usually played on private servers. MOGs are frequently adopted by fast-paced game genres like first-person-shooter (FPS) games in which response latency is the most critical factor, aside from game content, in the game experience. Some examples of FPS games are Doom,** Quake,** Half-Life,** and
ÓCopyright 2006 by International Business Machines Corporation. Copying in
printed form for private use is permitted without payment of royalty provided that (1) each reproduction is done without alteration and (2) the Journal reference and IBM copyright notice are included on the first page. The title and abstract, but no other portions, of this paper may be copied or distributed royalty free without further permission by computer-based and other information-service systems. Permission to republish any other portion of the paper must be obtained from the Editor. 0018-8670/06/$5.00Ó2006 IBM
Counter-Strike,4,5which are session-based games in which the goal is for a player’s alter ego to
accumulate successful‘‘kills’’against other players. To support more players, MOGs can scale up by horizontally replicating the game world without coordination or synchronization between these worlds.
The first and most popular type of MMOG is the massively multiplayer online role-playing game (MMORPG) genre, which can be traced to the nongraphical online multiuser dungeon (MUD) games of the 1970s and became popular in the late 1990s. Reference 6 estimates that MMORPGs hold a 95.5 percent share of the MMOG market. Some examples of MMORPGs are EverQuest**, Lineage**, and World of Warcraft**.7–9MMORPGs are also called state-world (PSW) or persistent-world (PW) games because the game persistent-world is normally hosted by a company and is always
available, and world events happen continually, even while some of the players are not playing their character. Players may retain the same title for several years. Popular MMORPG game titles have large numbers of subscribers.Figure 1, based on Reference 6, shows the statistics up to May 2005.
From the figure, we can see that subscriptions to the same title vary over time. Such dynamics of subscription bring challenges to gaming service providers who traditionally install a dedicated infrastructure for each title, due to the high risk of over- and under-allocation of resources and poten-tially poor resource utilization. This situation may become worse, as the number of commercially operated game titles has increased dramatically in recent years.
A successful gaming service provider must be able not only to satisfy its subscribers’ demand for high
Figure 1
MMOG active subscriptions
Reprinted with permission from B. S. Woodcock, An Analysis of MMOG Subscription Growth (May 2005) **Trademark or registered trademark of their respective companies.
0 250 500 750 1000 1250 1500 1750 2000 2250 2500 2750 3000 3250
Jan-97 Jul-97 Jan-98 Jul-98 Jan-99 Jul-99 Jan-00 Jul-00 Jan-01
Jul-01 Jan-02 Jul-02 Jan-03 Jul-03 Jan-04 Jul-04 Jan-05 Jul-05
Total Current Subscribers (in thousands)
Ultima Online** Lineage** EverQuest**
Dark Age of Camelot** RuneScape** Final Fantasy XI** Ragnarok Online (JP)** Star Wars Galaxies** Lineage II City of Heroes** EverQuest II World of Warcraft**
quality and attractive game content but also to reduce the risk of high investment in game hosting infrastructure associated with the difficulty of predicting the success of a new game title. The utility computing model, (also called‘‘on de-mand,’’10‘‘utility data center,’’11or‘‘just in time computing’’12) is believed to be the solution to this problem from an infrastructure perspective. For example, Shaikh et al. propose an on demand service platform for hosting large-scale multiplayer games.13The key idea proposed is sharing IT resources across multiple game titles or customers by dynamically provisioning and deprovisioning resources for a title or customer from a shared resource pool.
A critical component for these solutions is the
provisioning manager, which is responsible for resource provisioning and deprovisioning, such as the IBM Tivoli Intelligent Orchestrator (TIO). The TIO is an off-the-shelf product that automatically deploys and configures servers, software, and net-work devices in a data center environment.14The primary function of a provisioning manager is to collect performance and availability metrics from game servers, predict their trends, and decide how to adjust resource allocation accordingly.
Many studies have been performed to understand the online game traffic model and its impact on the Internet. According to a study on backbone traffic,15 about 3–4 percent of the traffic is generated by six popular online games. Borella16tried to use extreme distribution, exponential distribution, or determin-istic models to model the packet inter-arrival time and packet size of Quake, a popular FPS game. Farber17found that the traffic for another FPS game, Counter-Strike, follows Borella’s findings. Later, Feng et al.18analyzed a 500-million-packet trace of a Counter-Strike server and performed a similar study for three other FPS games. Their study indicated that game traffic is highly predictable and is character-ized by bursts of small packets.
Chen et al.19analyzed a 1,356-million-packet trace of a TCP (Transmission Control Protocol)-based midsize MMORPG, which normally runs at a slower pace than FPS games. Their analysis of selected connections revealed that the traffic model of MMORPG games is similar to FPS games in that it is characterized by tiny packet size and periodicity. The periodicity is caused by the periodic update of global events at a frequency of once every several minutes. They further indicate that for each
con-nection, the bandwidth needed is 7 Kbps at the server side, on average. However, considering the huge number of simultaneous players, the total bandwidth required for the MMORPG server side is very considerable. This study, also of a TCP-based large-size MMORPG, found that the bandwidth required at the server side showed a strong linear relationship with the number of simultaneous play-ers. Server CPU usage can also be calculated, given the number of simultaneous players.
Although we obtained results which were compat-ible with previous studies, our study differed from them in focusing on the relationship between the number of simultaneous players and required system resource levels rather than on building a network traffic model. The main assumption of our study is that there should be a stable and predictable model for that relationship in the long term although there are bursts of small packets from time to time. Part of the proof for this assumption comes from the design philosophy of MMORPGs. An attempt is typically made to design MMORPGs in a balanced manner; that is, different kinds of actions available to players in the game should keep some sort of balance in resource allocation. Furthermore, although server broadcasts for global events (e.g., new map, non-player character (NPC), update) are periodically conducted, we argue that in a large game world each game server takes care of the global events on the portion of the game world assigned to it, and each game server could use a different frequency of broadcast. Hence, the traffic for the whole game world would not show a periodicity property, due to the diversity of global events. Our experiment strongly supported this. Finally, all previous studies indicated that game traffic is predictable.16–19Although a network traffic model and its analysis are very important for understanding the impact of MMOG traffic on the Internet, our study is meaningful for game service providers in the context of resource planning and management at runtime. Some of the results reported in this paper were published in Reference 20. The remainder of the paper is organized as follows. The next section briefly reviews two popular game world organization schemas for MMORPGs. The third section illustrates the model used for MMORPG system performance modeling in this paper. Ex-periments and data analysis on two MMORPG titles
are reported in the fourth section. Finally, we conclude our discussion in the fifth section.
GAME WORLD ORGANIZATION IN MMORPGS
MMORPGs normally have a large game world, supporting several thousand simultaneous players.
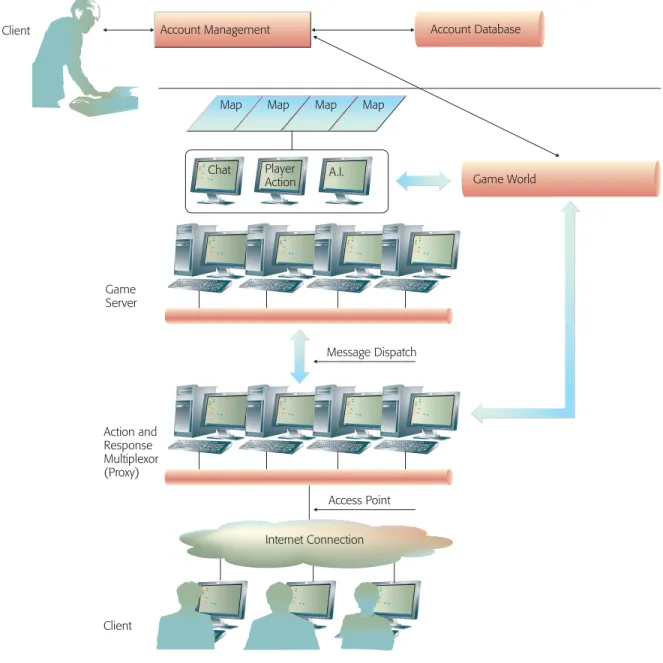
Figure 2shows a typical multitiered client/server architecture for MMORPGs. A proxy server farm communicates with all players. Usually, a load-balancing algorithm, such as‘‘round robin,’’is used to select a proxy for a player who wants to join the game. Frequently, a single game server cannot
handle all game events efficiently on such a large scale, requiring the world to be divided into several smaller parts which are served by a cluster of game servers. Depending on whether the server process boundaries are explicitly observable inside the game, there are two types of architecture for MMORPGs: the zoned architecture and the seamless architecture.
Thezoned architecturewas pioneered by EverQuest. In its original format, each zone runs its own process on its own server and manages state in its
Figure 2
Typical multitiered client/server architecture for MMORPGs
Access Point Action and Response Multiplexor (Proxy) Client Message Dispatch Game World
Client Account Management Account Database
Map Map Map Map
Chat Game Server Internet Connection Player Action A.I.
own memory space. Later, this design was improved to allow a unique process to manage all zones on a single game server but keep each zone independent by mapping between zones and physical game servers with a static process and using configuration files.
The first step for a client in playing such a game is to log on to a login server. Once authenticated, the client is instructed to disconnect from the login server and to connect to a‘‘starting zone’’server (for a new player), or to the last zone server to which the player was connected (for a returning player). When the player switches to a different zone, the client is again instructed to drop the current connection and connect to the new zone server. Each zone has a limit on how many users it will allow to connect at once. When that limit is reached, the zone is‘‘full’’
and will not allow new players in until a current player leaves. This puts an absolute cap on the number of users this model can support. To deal with this problem, Sony introduced the concept of a
shard. Each shard is a duplicated instance of the whole game world. By replicating shards, an MMORPG can theoretically serve an unlimited number of players. Most current MMORPGs adopt a zone architecture and a solution utilizing shards. Such a solution has some limitations. Separating players into separate shards limits their ability to interact. Because players are split first by zone and then by shard, players on different zones of the same shard can only engage in limited interaction, such as text chatting, while players in different shards have no chance to meet each other. This solution also causes abnormal interruption of game playing when the player switches to a‘‘full’’zone, and at the moment when he or she disconnects from the previous zone, the player cannot connect to the new zone. In this case, the player may lose his or her status in the game unless it is written to external storage.
In addition, the non-Gaussian distribution of players on each zone causes some zone servers to be overloaded while others are idle,21thus inefficiently utilizing processors. Due to the static bundle of zone and game servers, it is impossible to address this problem at runtime, so resources are wasted and operation costs are increased. Reliability problems can also be caused if players have to wait for the entire shard to be recovered whenever a server in the cluster breaks down or a game process crashes.
To address the limitations of the‘‘zoned plus shard’’
solution, theseamless architecturewas developed. A seamless game world is one in which a player may be unknowingly interacting with objects that are actually being controlled by multiple game processes or servers. There is no perceivable difference from the player’s viewpoint. Like the zoned architecture, the game world is divided into several small pieces and managed by a cluster of game servers. The major difference is that in a seamless architecture game servers need to collaborate with each other to process the game events that have impact across process boundaries and update the status of influ-enced avatars properly. Process boundaries become dynamically changeable to balance the load on each server in the game server cluster. Some designs even go a step further to include some utility-computing features, such as dynamic server provisioning and deprovisioning for the server cluster.21–23
The major advantages of a seamless game world lie in the larger contiguous game world that is enabled. This leads to a more immersive environ-ment for players and increases the flexibility of game design. Load balancing at runtime increases the scalability of the whole system. At runtime, game processing load can be moved from either failed servers or crashed game processes to other servers. The major disadvantage is that this architecture adds complexity to many aspects of game design and implementation. For example, players’ interaction across servers has to be implemented asynchronously (e.g., using message passing or shared memory). Middleware is being developed to solve this problem and simplify such implementations.21–24
A MODEL FOR MMORPG SYSTEM PERFORMANCE
Because most MMORPGs operate in client/server mode, two performance metrics, network and server performance, are of interest. These metrics relate to the major cost factors of a game’s hosting infra-structure—bandwidth and computing power.
Network traffic in MMORPGs
Game traffic includes traffic related to game logic and to ancillary functions. Each of these traffic types is comprised of an incoming part and an outgoing part. Normally, updates of a player’s status are sent not only to the player but to all other players whose
‘‘area of interest’’(AOI) includes that player.25The AOI of a player represents the scope of that player’s
perceptions in the game world, according to the game design. Most MMORPGs allow players to chat by using text messages. Accordingly, our network traffic model consists of three parts: the output traffic model, the input traffic model, and chat messages.
Output traffic model
In MMORPGs, unlike normal Web applications, the server-side processing is based on‘‘rounds,’’that is, the players take turns in controlling the game world. Each round may last several hundred milliseconds. The incoming requests from clients are first put in an incoming queue. In each processing round, the game server iteratively picks up requests in sequence from the incoming queue, processes them, and puts the outgoing messages (updates) in another queue, the outgoing queue. Finally, the updates in the outgoing queue are sent to interested clients in a burst at the end of each round. It is worth noting that even if a client does not have any update for itself, the game server may still send it updates about those players in its AOI as well as regular synchronous packets to maintain the connection. Therefore, the rate of updates is roughly propor-tional to the number of players in the AOI. Based on this sequence of events, the output message traffic model can be described by:
NOutðtÞ ¼ln3nðtÞ ð1Þ wheren(t) is the number of concurrent players at timet, andlnis the message size coefficient.
Input traffic model
The dominant part of all incoming traffic is the requests from connected clients to perform some action in the game, such as moving, fighting, or chatting. Chatting is discussed in the next sub-section. Another part of the incoming traffic is composed of synchronous packets for purposes of connection maintenance, which are either‘‘ heart-beat’’messages sent by the client when the player does not take any action for a specific period, or acknowledgement packets responding to a game server’s query. Because connection maintenance is necessary only for inactive players who comprise a small part of all players, we can roughly estimate that input traffic is proportional to the number of players and the heartbeat rate. Nonetheless, as pointed out in Reference 19, the actions of players are often successive and bursty and exhibit temporal locality. A more accurate model for input traffic
requires detailed study of the behavior of game players; our simplified treatment is open to debate, and we will discuss it further in the next section. Our input traffic model can be described as:
NInðtÞ ¼gAction3nðtÞ þhn3nðtÞ: ð2Þ
gActionis a coefficient based on action messages, which are related to the player’s action style and distribution, andhnis the average heartbeat rate for
nplayers.
Chat messages
Chatting by using text messages is the most popular collaboration mechanism for players in MMORPGs. New types of collaboration mechanism are emerg-ing, such as voice chat. Chat messages could be treated as a kind of action message by the game server or could be dispatched by a dedicated chat server. In either case, chat messages fall into one of three categories:
1. Peer-to-peer messages—A player sends messages to another player. The traffic caused by such messages can be described by Equation 3, where ]is the message size coefficient.
NP2PðtÞ ¼] 3nðtÞ: ð3Þ 2. Broadcast messages—A player broadcasts
mes-sages to all the other players. It is obvious that the traffic caused by a single broadcast message is proportional to the number of concurrent players: one incoming message andn(t)1 outgoing messages. Hence the entire traffic caused by broadcast chatting is proportional to the square of the number of concurrent players, wherebis the message size coefficient.
NBroadcastðtÞ ¼b3nðtÞ 2
: ð4Þ
3. Multicast chat messages—A player sends mes-sages to a group of players. Because the size of the group is relatively small, the model can be simplified to Equation 3, resulting in
NChat¼NP2PþNBroadcast:
Putting all of these factors together, we have:
NðtÞ ¼NOutðtÞ þNInðtÞ þNChatðtÞ: ð5Þ As mentioned in the last section, both incoming traffic and chat traffic depend on the behavior of players. For example, when players fight each other
or nonplayer characters in a battlefield, the coef-ficient in Equation 2 is fairly high. However, according to the design philosophy of MMORPGs, a good game should be a balanced one, that is, one in which the different kinds of action available keep some sort of balance. In our case, we noticed that large-scale battlefields are the territories of senior players who are more powerful, whereas junior players, who make up the largest portion of the population, are busy self-training individually or playing in small groups to improve their skills. Hence, we can roughly assume that each individual player’s behavior is independent of that of the other players in this study. Furthermore, as we discussed in the introduction, the traffic for a game shard does not show an apparent periodicity property due to the diversity of global-event update frequency. Thus, from the overall game world and statistic perspec-tive, the user-behavior-related coefficientsgAction
and]should be constant. This allows the traffic model in MMORPG to be simplified to:
NðtÞ ¼NOutðtÞ þNInðtÞ þNChatðtÞ
¼ ðlnþgActionþhnþ]Þ3nðtÞ þb3nðtÞ2 ¼uk3nðtÞ þb3nðtÞ
2
; ð6Þ
whereukandbare the coefficients which should be constant at the game shard level. Equation 6 could be further simplified if the traffic caused by broad-cast chat is small and thus negligible to:
NðtÞ ¼NOutðtÞ þNInðtÞ þNChatðtÞ ¼uk3nðtÞ þb3nðtÞ2
’uk3nðtÞ: ð7Þ
Thus, network traffic can be modeled by the number of concurrent players.
Server performance in MMORPGs
It is well known that in traditional Web applications, server performance can be modeled by the arrival rate.26For most Internet applications, this model can be expressed as a linear function:
UðtÞ ¼kðtÞ ukþb; ð8Þ
whereU(t) is the resource utilization rate,k(t) is the arrival rate at timet, usually defined as the number of requests from clients,bstands for the server resources used by the functions deployed at the server side that are not related to any requests, and
ukis the resource utilization rate for one request. In our study,bandukrepresent the CPU usage rate of the game servers.
Although the pattern of MMORPG network traffic is quite different from that of Web applications, Equation 8 can be used to determine the resource utilization rate at the server side for the following reasons. First, the design of game servers follows the producer-consumer pattern in which incoming requests from clients are first put into the incoming queue, and in each round of processing, the game server iteratively picks up requests in sequence from the incoming queue and processes them. Whereas in a given processing round the number of incoming requests could differ from the number of processed requests (e.g., in the statistically unlikely event of queue overflow), under normal conditions the game server should process all requests. Second, as shown in Equation 2, the incoming requests are proportional to the number of players, and thus the arrival rate of incoming messages can be repre-sented by the number of concurrent players. Another factor that would undermine the linear relationship between server performance and num-ber of concurrent players is the load-balancing algorithm. The number of concurrent players is defined as the number of players in an entire game world, and these players are distributed to each proxy server and game server by the load balancer. If we tokenize the number of players on each game server askigðtÞ;and the number of players on each proxy server askipðtÞ;we get the total number of players at timet: kðtÞ ¼ X N i¼1 kigðtÞ ¼X N i¼1 kipðtÞ; ð9Þ
wherek(t) is the total number of players at timet
andNis the total number of game servers. Because the number of proxy servers is the same as the number of game servers, the total number of proxy servers is alsoN. In the game system that we analyzed,N¼4. Therefore, a point that needs to be considered is: How does the load balancer distribute the players to each server? If the load balancer distributes the players to each server randomly, it cannot be guaranteed that the data will exhibit a linear relationship, even if each of them follows Equation 10, wherekigðtÞis the number of players on game serveriat timet,U(t)iis the resource utilization rate of serveri,biindicates the server resources used by the functions deployed at the server side that are not related to any requests, and
ukiis the resource utilization rate used by one request of serveri:
kiðtÞ ¼UðtÞi=ukibi=uki: ð10Þ We define a load balancer to be proportion-consistentif the algorithm used by it dispatches the traffic to each resource proportionally and the proportion does not change over time. Using this definition, we can state that if each server’s performance has a linear relationship to the number of players on this server and the load balancer is proportion-consistent, then every server’s perfor-mance also has a linear relationship with the number of players in the entire game world. Because the proof of this is straightforward, it is omitted here. The load balancer in our system uses a WRR (weighted round robin) algorithm to dispatch the players, so it is clearly proportion-consistent.
EXPERIMENTS AND ANALYSIS
In this section, we present our experimental and analytical results for a zoned MMORPG and a seamless MMORPG.
Experimental results for a zoned MMORPG
A zoned MMORPG game, which is one of the most popular titles in China, was analyzed by using the model described in the previous section. In this game, players were indirectly connected to game servers through proxy servers. In each shard, there were four proxy servers that had full connections to four game servers. The configuration of a shard was composed of four proxy servers and four game servers. Every server had a Pentium** 4 1.8Hz CPU, 2 GB of RAM, and ran Windows 2000**. A‘‘sniffer’’
was attached to the network to track all network traffic. Each shard had an Internet connection with a bandwidth of 32Mb.
Network traffic in a zoned MMORPG
In order to analyze network performance, a heavily loaded shard was selected for monitoring, having a number of concurrent players which varied from 1500 to 2500. By associating it with the number of concurrent players calculated from the log informa-tion in the database, their interrelainforma-tionship could be
found. First, a linear model was evaluated by calculating the linear correlation coefficientCov
between the number of concurrent players and the network traffic, according to Equation 11,
Cov½nðtÞ;NðtÞ ¼ X ½nðtÞ EðnðtÞÞ ½NðtÞ EðNðtÞÞ f g ffiffiffiffiffiffiffiffiffiffiffiffiffiffiffiffiffiffiffiffiffiffiffiffiffiffiffiffiffiffiffiffi D½nðtÞ D½NðtÞ p ; ð11Þ in whichDðxÞ ¼mPðx2Þ ðPxÞ2 andmis the number of data points.
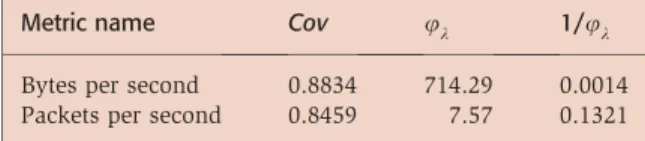
Next, a robust regression algorithm was used to obtain the parameterukin Equation 7. The two curvesN(t) andn(t)ukcould then be plotted together and compared. A detailed discussion of the algorithm used can be found in Reference 27. Two network traffic metrics were analyzed: bytes per second and packets per second.Table 1shows the results, a strong linear relationship between these metrics.Covis the correlation coefficient calculated according to Equation 11, andukis the parameter in Equation 7 estimated by the robust regression algorithm.
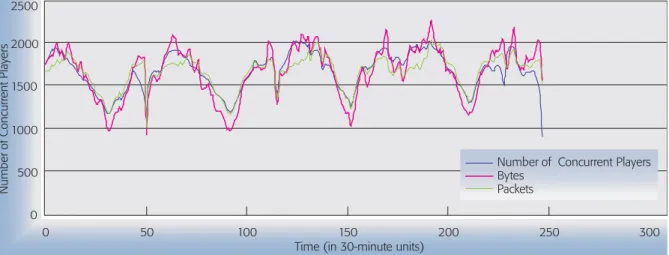
Figure 3shows the robust regression results. The x-axis represents time, using a sample rate of 30 minutes. The dark purple line is the concurrent player number, and the green line is mapped from the packet traffic to the concurrent player number as
mp(t)0.132, wheremp(t) is the packet traffic. Similarly, the red line is mapped from the byte traffic to the number of concurrent players asmb(t)0.0014, wheremb(t) is the byte traffic.
Although network traffic fluctuated significantly, its relationship with the number of concurrent players strongly followed Equation 7.
Server performance in a zoned MMORPG
In order to evaluate the server performance model, the Windows** Performance Monitor was used to record the CPU utilization of the related game processes every 5 seconds. These results were then summed to obtain the entire utilization on each server.
Two metrics, server performance and number of players, were analyzed (with a sample rate of one hour to smooth out disturbances), and the server performance was averaged during the interval. The procedure was similar to that of the network traffic Table 1Linear relationship and parameters of
network traffic and number of concurrent players
Metric name Cov uk 1/uk
Bytes per second 0.8834 714.29 0.0014 Packets per second 0.8459 7.57 0.1321
analysis: first, a correlation valueCov(k(t),U(t)) between CPU utilization and number of concurrent players was calculated; next, the robust regression algorithm was used to find the parameters of Equation 12, which is a transformation of Equation 8, in order to plot the lines in the same figure:
kðtÞ ¼UðtÞ=ukb=uk: ð12Þ
In this equation,U(t) the server performance,uk
represents the server’s CPU utilization cost per player, andbrepresents the resources consumed by non-game-related processes or daemons. As in Equation 8,bandukare the coordinates of the CPU usage rate of game servers. OnceU(t) is obtained, the number of concurrent playersk(t) can be calculated by performing integration (see Equation 12).
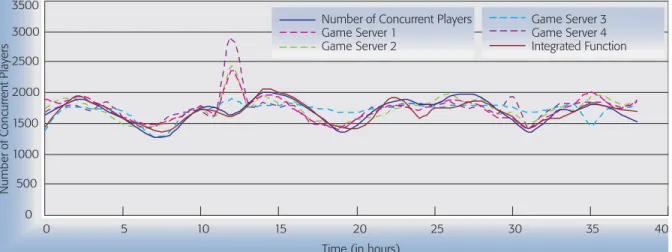
Table 2summarizes the results, which show that almost all of the servers have a strong linear relationship with the number of concurrent players except game server 4.Figure 4plots the robust
regression result of the servers. It can be seen that although the correlation coefficient of game server 4 is 0.3491, its server performance still fits Equation 8 very well. If some outlying points, less than 5 percent of the original data set, are removed, game server 4 also exhibits a high linear relationship with the concurrent player number with a correlation value of 0.6731.
Because each game server is associated with some zones of the game world, the number of players on each server is equal to the number of players on those zones in the server. Therefore, whether the load-balancing algorithm for the game server is proportion-consistent is decided by the geographical distribution of players. This is why the correlation coefficients of game servers are poorer than those of proxy servers (see Table 2). On the other hand, if every server followed Equation 10, the number of concurrent players for the entire game world would follow Equation 13.Table 3shows the results for the entire game world.Cov(k0,k) indicates that the linear relationship is improved (see the brown line in Figure 4). kðtÞ0¼ X 4 i¼1 UðtÞi=uki X4 i¼1 bi=uki ð13Þ
Experimental results for a seamless MMORPG
To evaluate our performance model with a seamless MMORPG, an open-source MMORPG game, Cross-Fire,28was selected and modified with our MMORPG middleware.22It then had most of the
Figure 3
Robust regression results for network traffic and number of concurrent players
0 500 1000 1500 2000 2500 0 50 100 150 200 250 300
Time (in 30-minute units)
Number
of
Concurr
ent Players
Number of Concurrent Players Bytes
Packets
Table 2Server performance vs number of concurrent players using robust regression algorithm to esti-mate parameters of Equation 8
Server ID Cov 1/uk b/uk
Game server 1 0.648 39.4 2561.1 Game server 2 0.6258 45.7 2827.2 Game server 3 0.6049 9.388 698.44 Game server 4 0.3491 76.7 6599
features of a seamless MMORPG, including a contiguous game world and runtime load balancer. With the code of CrossFire in hand, more probes were set to capture further information, such as the CPU utilization rate of each game server, number of players, network data flow, and so forth. To compare it with the zoned game, we adopted a similar infrastructure deployment schema, including four game servers and one proxy server. Each server used the Red Hat** 9.0 operating system, a 2.8 GHz CPU, and 512 MB of RAM. A simulation‘‘robot’’was developed for the client side of CrossFire to simulate the online game player’s behavior, such as walking and fighting with other players. The robot connected to the game servers indirectly through the proxy.
Server performance in a seamless MMORPG
In order to evaluate the server performance model, the CPU utilization of the related game processes was logged every 1 second; these results were then summed to obtain the entire utilization, as we did for the zoned MMORPG.
According to Equation 11, the linear model was evaluated by calculating the correlation coefficient between the number of players and CPU utilization.
Then the regression algorithm was used to find the parameters of Equation 12.
Figure 5shows the relationship between the number of concurrent players and CPU utilization for all four game servers. Unlike the previous experiment on zoned MMORPGs, we can obtain each server’s number of players and CPU in this case and display them separately. Because the simulation robot keeps adding avatars into the game world, in the following figures the number of players is always increasing during the test period. From these figures, a strong linear relationship between the number of concurrent players and the CPU utiliza-tion can be clearly seen.Table 4summarizes the results, which show that all of the servers have a strong linear relationship with the number of concurrent players.
We also summed the total number of players for the four game servers and evaluated the relationship between the total number of players and CPU utilization. We found that they exhibited a strong linear relationship as well, with a relationship coefficient of 0.9907.
Figure 4
Linear relationship between server performance and number of concurrent players
Number of Concurr ent Players 0 500 1000 1500 2000 2500 3000 3500 0 5 10 15 20 25 30 35 40
Number of Concurrent Players Game Server 1
Game Server 2
Time (in hours)
Game Server 3 Game Server 4 Integrated Function
Table 3Linear relationship between the integrated results and the number of concurrent players
Server group Cov(k,k0) 1/uk1 1/uk2 1/uk3 1/uk4
X
4
i¼1
bi=uki
Figure 5
CPU utilization vs number of concurrent players for four game servers
0 1 2 3 4 5 6 7 8 9 0 10 20 30 40 50 60 70
Number of Concurrent Players
CP U Utilization 0 5 10 15 20 25 0 50 100 150 200 250 300
Number of Concurrent Players
CP U Utilization 0 1 2 3 4 5 6 7 8 9
Number of Concurrent Players
CP U Utilization 0 10 20 30 40 50 60 70 80 CP U Utilization 0 5 15 10 20 25 0 50 100 150 200 250
Number of Concurrent Players Game Server 1
Game Server 2
Game Server 3
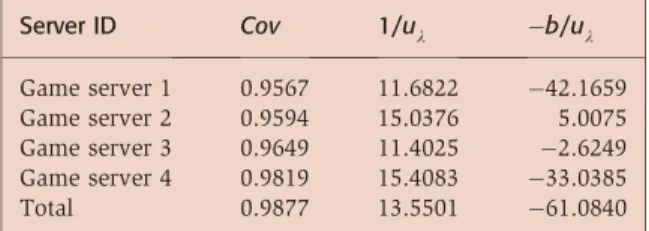
In order to analyze the impact on the performance of agents, we also compared the total number of players and agents with CPU utilization.Table 5
shows the results. Comparing Tables 4 and 5, we can see that the linear relationship between the number of players and CPU utilization is a little stronger than the relationship between the CPU utilization and the total number of players and agents. We can thus conclude that the number of players is a good parameter with which to model the server’s performance.
Network traffic in a seamless MMORPG
Another important performance metric is network traffic. Two network traffic metrics were analyzed:
the input traffic, which is the traffic from the simulation robot to the game server (e.g., the player’s commands); and the output traffic, which is the data flow from the game server to the robot (e.g., the game server’s update messages to the client). As was the case for the zoned experiments, traffic was divided into bytes per second and packets per second.Figure 6shows the relationship between the number of concurrent players and the number of input packets, input bytes, output packets, and output bytes. From the figure, we can see that the network traffic’s relationship with the number of concurrent players strongly follows Equation 7. Table 4Server performance and number of
con-current players Server ID Cov 1/uk b/uk Game server 1 0.9573 9.5329 40.2860 Game server 2 0.9786 10.1730 6.2004 Game server 3 0.9834 8.1566 1.5212 Game server 4 0.9851 13.2100 25.4584 Total Number of Concurrent Players 0.9907 10.8225 48.5844
Table 5Server performance and number of con-current players and agents
Server ID Cov 1/uk b/uk Game server 1 0.9567 11.6822 42.1659 Game server 2 0.9594 15.0376 5.0075 Game server 3 0.9649 11.4025 2.6249 Game server 4 0.9819 15.4083 33.0385 Total 0.9877 13.5501 61.0840 0 50 100 150 200 250 300 1 19 37 55 73 91 109 127 145 163 181 199 217 235 253 271 289 307 325
Time (in minutes)
Number
of
Concurr
ent Players
Figure 6
Network traffic vs number of concurrent players for Server 1
Number of Concurrent Players Mapped function of Input Packets Mapped function of Input Bytes Mapped function of Output Packets Mapped function of Output Bytes
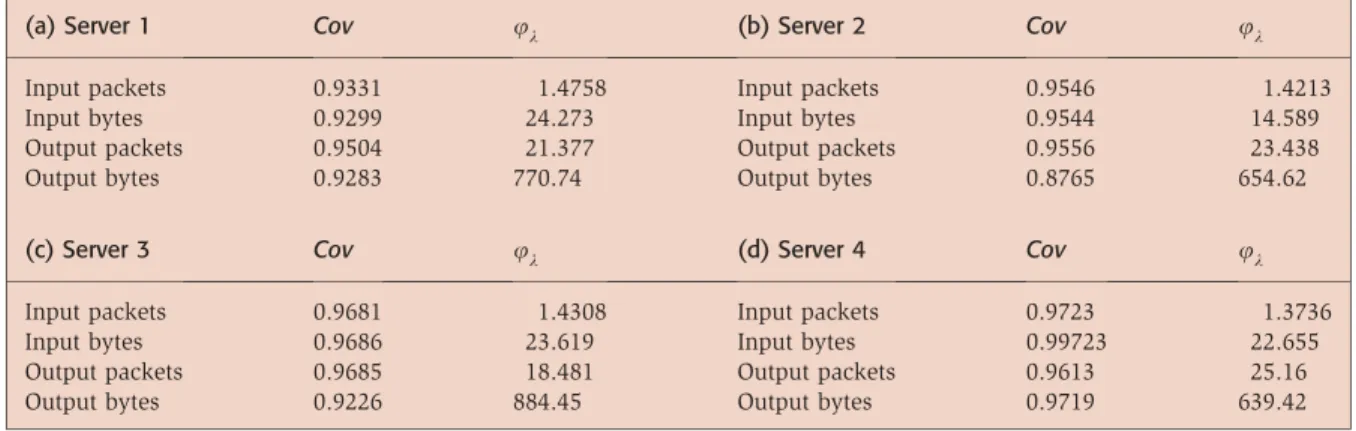
Table 6shows the results for all four game servers, indicating a strong linear relationship between them.Covis the correlation coefficient calculated according to Equation 11, andukis the parameter in Equation 7 estimated by the regression algorithm. As before, in order to analyze the impact on agent performance, we compared the total number of players and agents with network performance.
Table 7shows the results.
From Tables 6 and 7, we can see that there is a stronger linear relationship between the number of players and the CPU utilization than pertains for the total number of players and agents. We can conclude from this that the number of players is a good parameter with which to model the server performance.
SUMMARY AND FUTURE WORK
This study has proposed a performance model for MMORPGs. By evaluating two MMORPGs with different game-world organization mechanisms, we demonstrated that the performance metrics at the server side have a strong linear relationship with the number of concurrent players. The results make it is easy and straightforward for MMORPG service providers to predict resource requirements for their gaming infrastructure at runtime in an automated way. Though the scope of our study was limited to two MMORPGs, we believe the results can be generalized to other MMORPGs with similar themes and styles.
As mentioned in our discussion, game design and player behavior have significant impact on the
traffic model and resource usage model at the server end. As the MMORPG is quickly evolving in terms of adopting features of other game genres, the game system will definitely become more complicated, as will the behavior of players. In our future work, we plan further study of the changes taking place in both the design pattern of
MMORPGs and user behavior and the development of a more accurate model for the purposes of prediction.
ACKNOWLEDGMENTS
The authors would like to thank Sheng Lu for his valuable comments in the discussion of this paper’s topics, and Liqin Shen, Ling Shao, and Jun Liu for their assistance and encouragement in this study. The authors also acknowledge the anonymous reviewers for their constructive criticism.
**Trademark, service mark, or registered trademark of Microsoft Corporation, Sony Computer Entertainment, Inc., GameSpy Industries, Inc., Intel Corporation, Id Software, Inc., Valve Corporation, NCsoft Corporation, Blizzard Entertain-ment, Inc., or Red Hat, Inc. in the United States, other countries, or both.
Table 6Linear relationship and parameters of network traffic and the number of concurrent players for (a) Server 1; (b) Server 2; (c) Server 3; and (d) Server 4.
(a) Server 1 Cov uk (b) Server 2 Cov uk
Input packets 0.9331 1.4758 Input packets 0.9546 1.4213
Input bytes 0.9299 24.273 Input bytes 0.9544 14.589
Output packets 0.9504 21.377 Output packets 0.9556 23.438
Output bytes 0.9283 770.74 Output bytes 0.8765 654.62
(c) Server 3 Cov uk (d) Server 4 Cov uk
Input packets 0.9681 1.4308 Input packets 0.9723 1.3736
Input bytes 0.9686 23.619 Input bytes 0.99723 22.655
Output packets 0.9685 18.481 Output packets 0.9613 25.16
Output bytes 0.9226 884.45 Output bytes 0.9719 639.42
Table 7Network traffic and total number of players and agents Server ID Input packets Input bytes Output packets Output bytes Game server 1 0.9275 0.9243 0.9452 0.9247 Game server 2 0.9421 0.9423 0.9455 0.8692 Game server 3 0.9531 0.9536 0.9551 0.9165 Game server 4 0.9703 0.9702 0.9595 0.9712
CITED REFERENCES
1. US Online PC Gaming 2004–2008 Forecast and Analysis: Growth Continues, International Data Corp. (IDC) (De-cember 2004), http://www.idc.com/getdoc.
jsp?containerId¼32473.
2. T. Iimura, H. Hazeyama, and Y. Kadobayashi,‘‘Zoned Federation of Game Servers: A Peer-to-Peer Approach to Scalable Multi-player Online Games,’’Proceedings of ACM SIGCOMM 2004 Workshops on NetGames ‘04, ACM Press, New York (2004), pp. 116–120, http://portal.acm. org/citation.cfm?id¼1016549&coll¼GUIDE&dl¼
GUIDE&CFID¼52856997&CFTOKEN¼73726409. 3. P. Rosedale and C. Ondrejka,‘‘Enabling Player-Created
Online Worlds with Grid Computing and Streaming’’
(September 2003), http://www.gamasutra.com/ resource_guide/20030916/rosedale_01.shtml. 4. Id Software, http://www.idsoftware.com/.
5. Valve Corporation, http://www.valvesoftware.com/. 6. B. S. Woodcock,‘‘An Analysis of MMOG Subscription
Growth–Version 18.0,’’MMOGCHART.COMonline pub-lication (October 2005), http://www.mmogchart.com/. 7. Welcome to Station.com, Sony Online Entertainment
(SOE), http://www.station.sony.com/en/.
8. NcSoft Corporation, http://www.ncsoft.com/eng/index. asp.
9. Blizzard Entertainment, http://www.blizzard.com/. 10. On Demand Business, IBM Corporation, http://www.
ibm.com/ondemand.
11. HP Utility Data Center: Enabling Enhanced Data Center Agility, International Data Corp. (IDC) (May 2003), http://www.hp.com/large/globalsolutions/ae/pdfs/ udc_enabling.pdf.
12. N1eGrid Technology—Just In Time Computing, Sun Microsystems (2003), http://www.sun.com/software/ solutions/n1/wp-n1.pdf
13. A. Shaikh, S. Sahu, M. Rosu, M. Shea, and D. Saha,
‘‘Implementation of a Service Platform for Online Games,’’Proceedings of ACM SIGCOMM 2004 Workshops on NetGames ‘04,ACM Press, New York (2004), pp. 106– 110.
14. IBM Tivoli Intelligent Orchestrator, IBM Corporation (2004), http://www-306.ibm.com/software/tivoli/ products/intell-orch.
15. S. McCreary and K. Claffy,‘‘Trends in Wide Area IP Traffic Patterns: A View from Ames Internet Exchange,’’
Proceedings of 13th ITC Specialist Seminar on IP Traffic Measurement, Modeling, and Management(2000), http://www.caida.org/outreach/papers/2000/AIX0005/. 16. M. S. Borella, J. Farber, W. Feng, and K. Chen,‘‘Source Models of Network Game Traffic,’’Computer Communi-cations,23, No. 4, 403–410 (February 2000).
17. J. Farber,‘‘Network Game Traffic Modelling,’’Proceedings of the First Workshop on Network and System Support for Games,ACM Press, New York (2002), pp. 53–57. 18. W. C. Feng, F. Chang, W. C. Feng, and J. Walpole,‘‘A
Traffic Characterization of Popular On-line Games,’’
IEEE/ACM Transactions on Networking13, No. 3, 151– 156 (June 2005).
19. K. Chen, P. Huang, C.-Y. Huang, and C.-L. Lei,‘‘Game Traffic Analysis: An MMORPG Perspective,’’Proceedings of the International Workshop on Network and Operating System Support for Digital Audio and Video (NOSSDAV), pp. 19–24 (2005).
20. G. Huang, M. Ye, and L. Cheng,‘‘Modeling System Performance in MMORPGs,’’Proceedings of the 1st IEEE International Workshop on Networking Issues in Multi-media Entertainment NIME’04at IEEE GlobeCom (2004), pp. 512–518, http://huang_gao.nease.net/research/ msp_mmorrg.pdf.
21. Sun Game Server Technology: An Executive Overview, Sun Microsystems (June 2004), http://developers.sun.com/ techtopics/gametech/reference/docs/
simserverwp052604.pdf.
22. M. Ye and L. Cheng,iMMOG Design Report, IBM China Research Lab (2004).
23. BigWorld Technology (2004), http://www.bigworldtech. com/introduction.php.
24. Product Review: Massively Multiplayer Online Game Middleware, Gamasutra (January 2003), http://www. gamasutra.com/features/20030115/ferguson_01.htm. 25. J. Smed, T. Kaukoranta, and H. Hakonen,A Review on
Networking and Multiplayer Computer Games, Technical Report 454, University of Turku Centre for Computer Science (2002), http://staff.cs.utu.fi/staff/jouni.smed/ papers/TR454.pdf.
26. D. A. Menasce´ and V. A. F. Almeida,Capacity Planning for Web Performance: Metrics, Models, & Methods, Prentice Hall PTR, Upper Saddle River, NJ (1998). 27. P. J. Rousseeuw and A. M. Leroy,Robust Regression and
Outlier Detection, John Wiley & Sons, Hoboken, NJ (1987).
28. CrossFire—The Multiplayer Adventure Game, Real Time Enterprise Ltd., http://crossfire.real-time.com/.
Accepted for publication September 2, 2005.
Meng Ye
IBM Research Division, China Research Laboratory, Building 19, Zhongguancun Software Park, 8 Dongbeiwang West Road, Haidan Dist., Beijing 100094, People’s Republic of China ([email protected]). Mr. Ye is a research staff member in the High Performance Computing group at IBM’s China Research Laboratory. He received a B.S. degree in computer software from Sichuan University, Chengdu, China in 1991, an M.S. degree in computer science from Southwest Jiaotong University, Chengdu, China in 1994, and an M.Phil. degree in information systems from City University of Hong Kong in 1999. He worked for the Institute of Computing Technology of the China Academy of Science before joining IBM in 1999.
Long Cheng
IBM Research Division, China Research Laboratory, Building 19, Zhongguancun Software Park, 8 Dongbeiwang West Road, Haidan Dist., Beijing 100094, People’s Republic of China ([email protected]). Mr. Cheng is a research and development engineer in the High Performance Computing group at IBM’s China Research Laboratory. After receiving a Ph.D. degree from NanKai University, TianJin, China in 2003, he joined the IBM China Research Laboratory.&